


In order to avoid delay in the diagnosis of acute appendicitis and reduce the margin of error, the use of scales has been used. The aim of this study was to compare the effectiveness of the Alvarado and RIPASA scores in the clinical diagnosis of acute appendicitis and to correlate with the histopathological results.
MethodsProspective, longitudinal, analytical, comparative and observational study. Patients with abdominal pain syndrome suggestive of acute appendicitis and submitted to surgical intervention were included; the Alvarado and RIPASA scores were simultaneously applied. The pathology report was obtained and the efficacy of both scores for the diagnosis of acute appendicitis was compared.
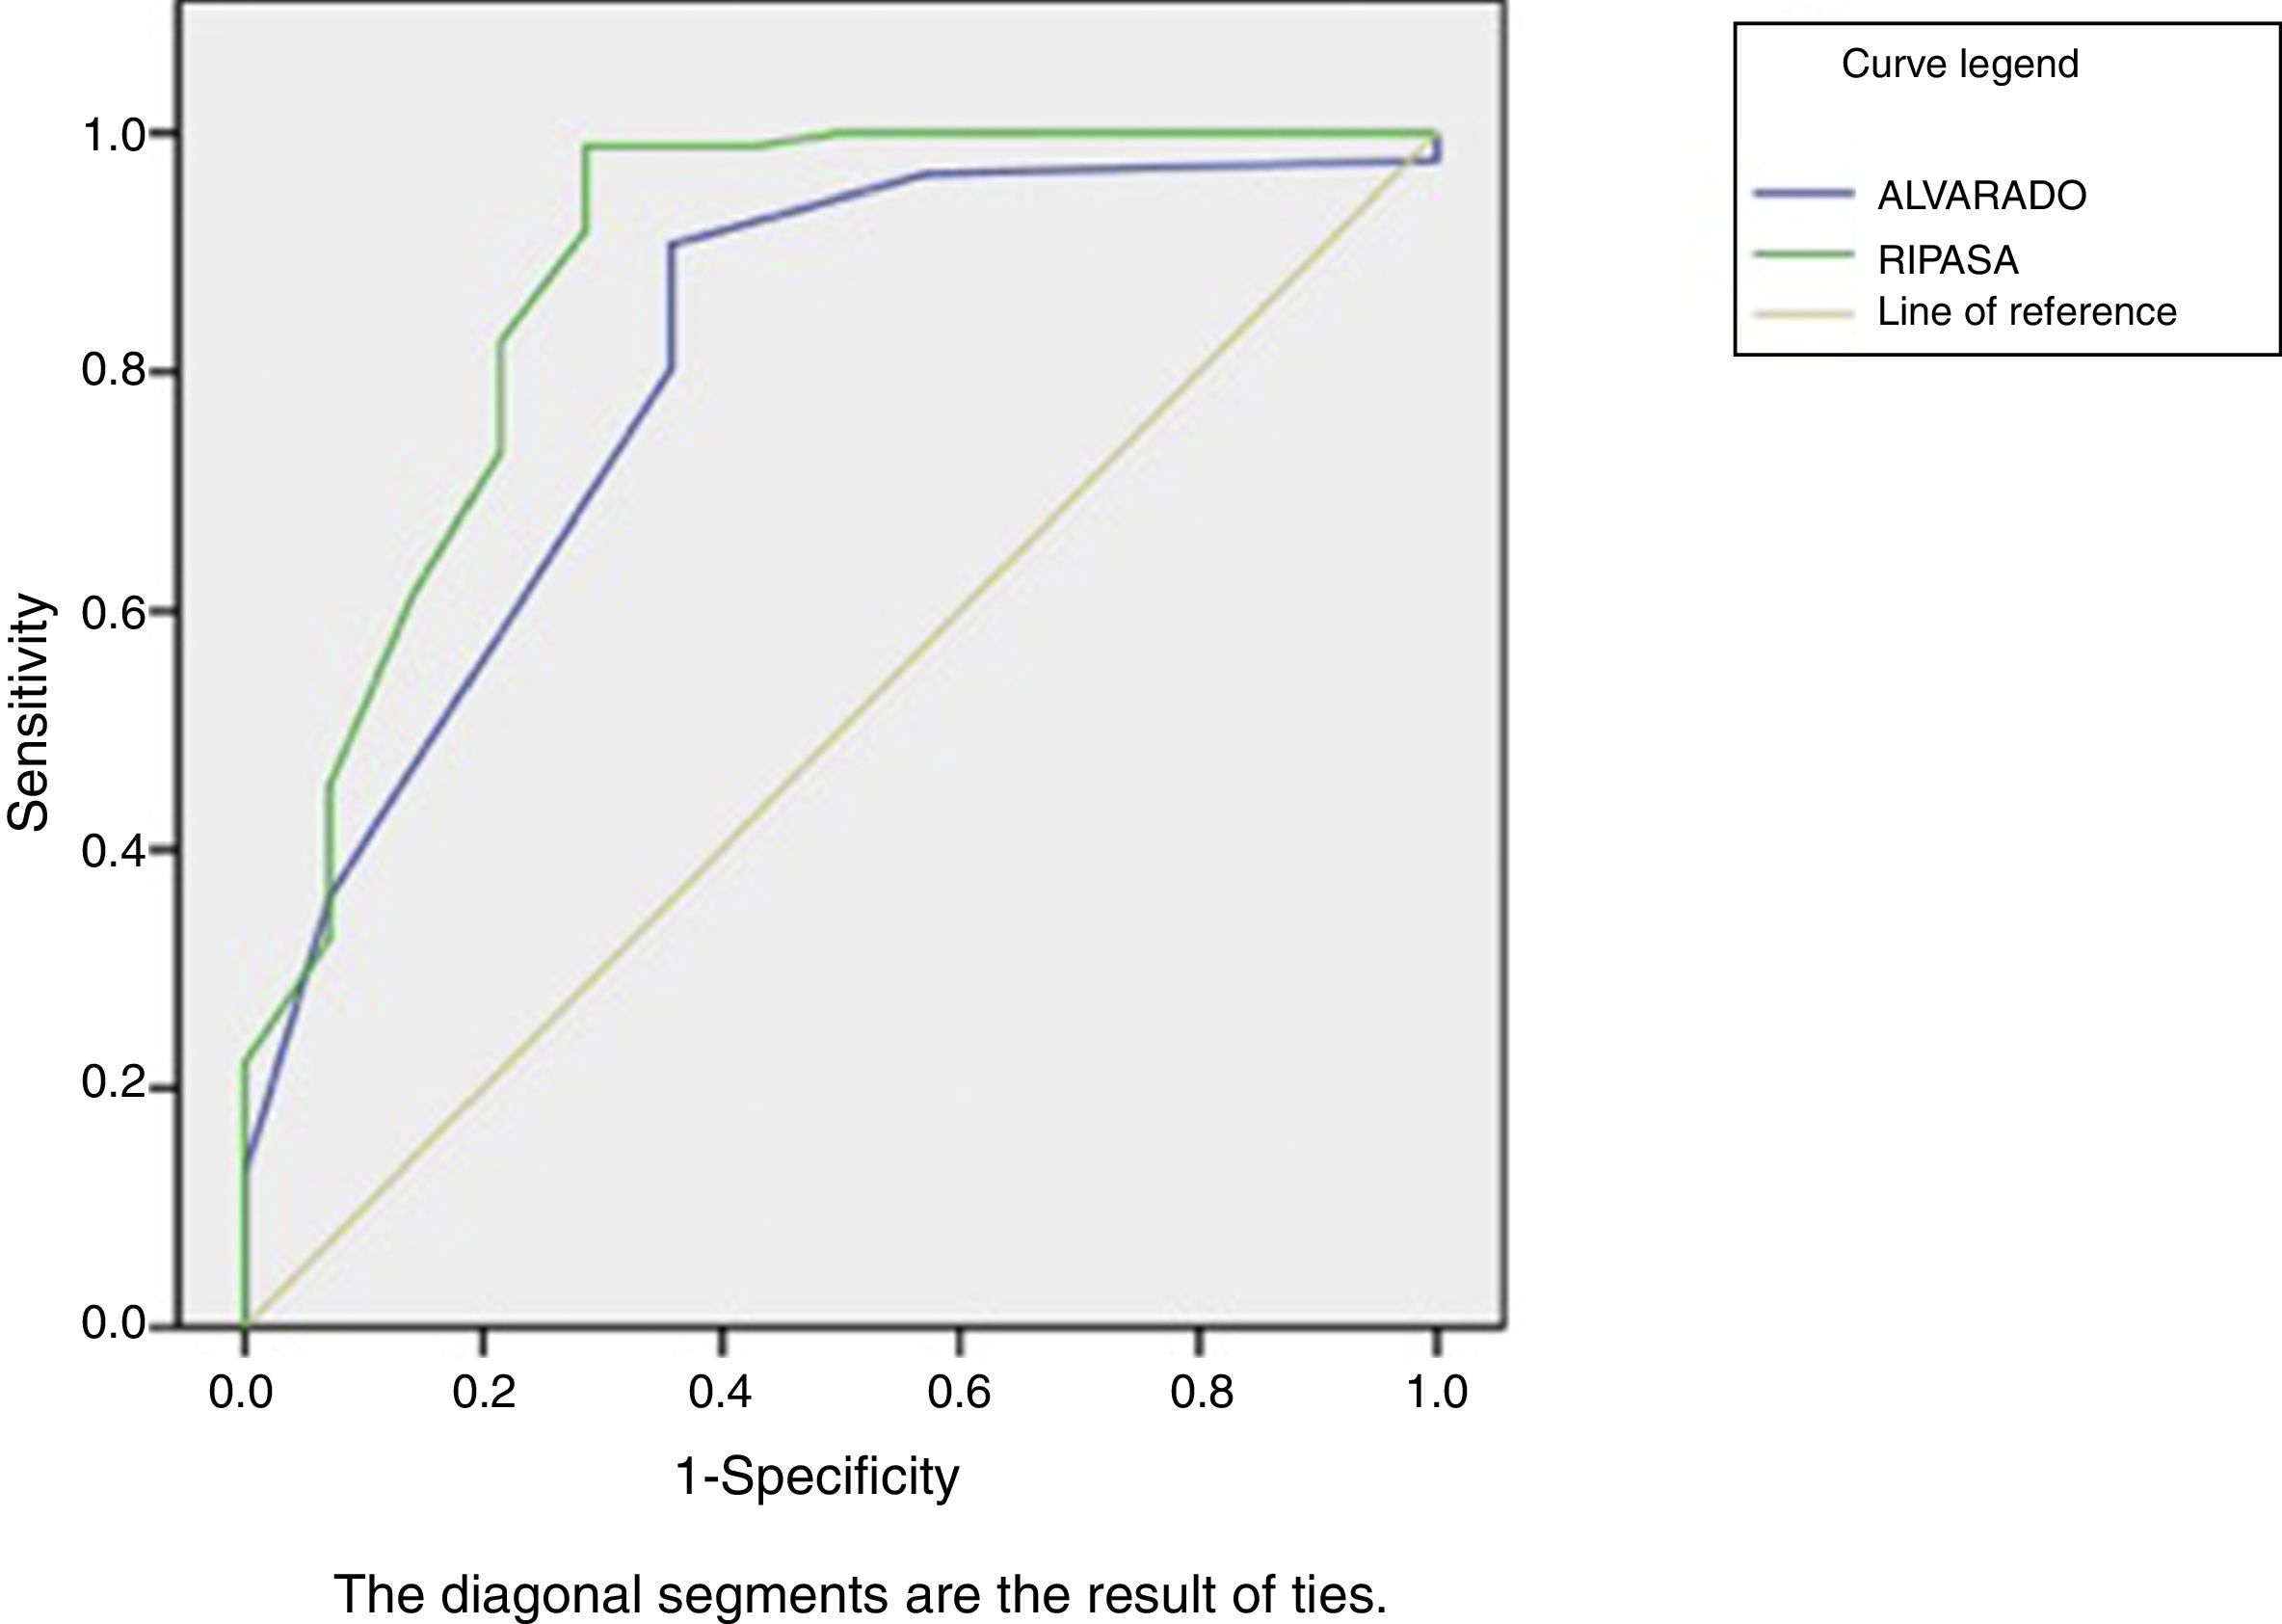
ResultsOne hundred patients were included. It was shown that the RIPASA score demonstrated greater diagnostic accuracy compared to the Alvarado score, with sensitivity of 98.8% and specificity of 71.4% versus 90.7% and 64.3%, respectively. The RIPASA score showed an area under the curve of 0.88 and the Alvarado scale of 0.80.
ConclusionsThe RIPASA score is a more specific, convenient and accurate system than the Alvarado score for the Mexican population.
Con el fin de evitar retardo en el diagnóstico de apendicitis aguda y disminuir el margen de error, se ha recurrido a la aplicación de escalas. El objetivo de este estudio fue comparar la eficacia de las escalas Alvarado y RIPASA en el diagnóstico clínico de apendicitis aguda y correlacionar con el resultado de patología.
MétodosEstudio longitudinal prospectivo, analítico, comparativo. Se incluyeron pacientes con síndrome doloroso abdominal sugestivo de apendicitis aguda e intervenidos quirúrgicamente; se les aplicaron en forma simultánea las escalas de Alvarado y la RIPASA. Se obtuvo el reporte de patología y se comparó la eficacia de ambas escalas para el diagnóstico de apendicitis aguda.
ResultadosSe incluyeron 100 pacientes. La escala RIPASA demostró mayor certeza diagnóstica en comparación con la escala de Alvarado, con sensibilidad del 98,8% y especificidad del 71,4% versus 90,7% y 64,3%, respectivamente. La escala RIPASA mostró un área bajo la curva de 0,88 y la escala de Alvarado, de 0,80.
ConclusionesLa escala RIPASA es un sistema más específico, conveniente y certero que la escala de Alvarado para la población mexicana.
Acute appendicitis (AA) is associated with 10% morbidity and 0.24%–4.0% mortality rates1 and is the most frequent diagnosis worldwide for emergency surgeons, representing up to 20% of all surgical operations.2 It occurs most frequently between the second and fourth decades of life, with a timely diagnosis that is difficult and predominantly symptoms-based.3
The percentage of negative appendectomies (10%–15%) has not changed with the introduction of ultrasound and computed tomography, while the percentage of misdiagnosis in patients undergoing laparoscopic appendectomy is significantly higher than in open appendectomy. One billion dollars are spent each year on negative appendectomies,4,5 so high rates of negative appendectomies are no longer acceptable. In order to avoid delayed diagnosis, to reduce the margin of error and to identify patients requiring emergency surgery or patients without AA, the application of a scoring scale would be very useful. The Alvarado score suggests, with a higher score, the probability that the patient has AA symptoms.6
A new systems, the Raja Isteri Pengiran Anak Saleha Appendicitis (RIPASA) score, seems to have greater sensitivity and specificity for the diagnosis of AA and a significant reduction of negative appendectomies.7,8
The purpose of this study was to apply both scales in the emergency department in cases of patients with presumptive diagnosis of AA and to compare these with the pathology reports after appendectomy, thereby comparing the efficacy, sensitivity and specificity of the Alvarado and RIPASA scores in the diagnosis of AA at a tertiary hospital serving the population of eastern Mexico.
MethodsAn analytical, observational study was conducted between June 1 and December 31, 2016 in patients of both sexes who were 18 years of age or older and came to the emergency department of the Hospital de Alta Especialidad of Veracruz with suspected diagnosis of AA and underwent appendectomy. Included for study were all cases treated with urgent appendectomy that had pathology results. The study was approved by the hospital's Ethics Committee.
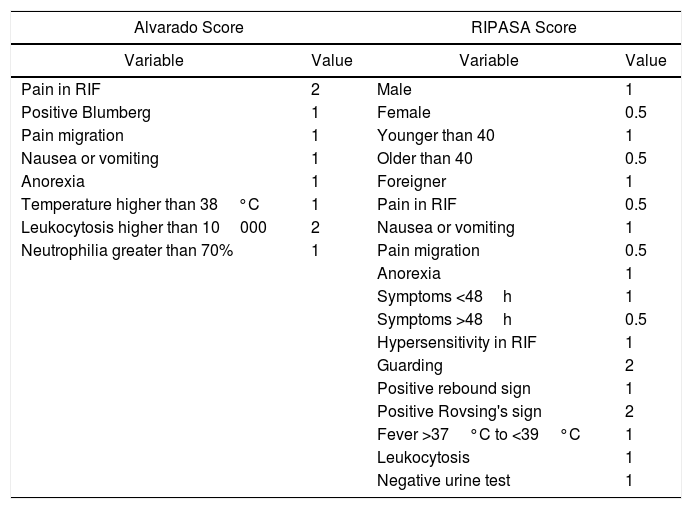
Instruments. The 2 different classifications, the Alvarado and the RIPASA scores, were applied to each of the patients by a resident doctor in surgery, without influencing the surgeon's decision regarding surgical intervention. The Alvarado score (published in 1986) is an assessment chart (Table 1), whose sum gives a maximum of 10 points with a higher probability that the patient has AA.6 The RIPASA score (published in 2010) is purported to have greater sensitivity and specificity.7
Variables in the Alvarado and RIPASA Scales and Their Values.
| Alvarado Score | RIPASA Score | ||
|---|---|---|---|
| Variable | Value | Variable | Value |
| Pain in RIF | 2 | Male | 1 |
| Positive Blumberg | 1 | Female | 0.5 |
| Pain migration | 1 | Younger than 40 | 1 |
| Nausea or vomiting | 1 | Older than 40 | 0.5 |
| Anorexia | 1 | Foreigner | 1 |
| Temperature higher than 38°C | 1 | Pain in RIF | 0.5 |
| Leukocytosis higher than 10000 | 2 | Nausea or vomiting | 1 |
| Neutrophilia greater than 70% | 1 | Pain migration | 0.5 |
| Anorexia | 1 | ||
| Symptoms <48h | 1 | ||
| Symptoms >48h | 0.5 | ||
| Hypersensitivity in RIF | 1 | ||
| Guarding | 2 | ||
| Positive rebound sign | 1 | ||
| Positive Rovsing's sign | 2 | ||
| Fever >37°C to <39°C | 1 | ||
| Leukocytosis | 1 | ||
| Negative urine test | 1 | ||
RIF: right iliac fossa.
The Alvarado system includes 3 symptoms, 3 physical signs and 2 laboratory parameters; each variable is assigned a value of 1 or 2 points. The result consists of the sum of the values, with a maximum score of 10. The higher the score obtained, the greater the probability that the patient has AA. Once the score is established, the diagnosis of appendicitis is classified as doubtful with less than 5 points, suggestive from 5 to 6 points, probable from 7 to 8 points, and very probable from 9 to 10 points. The RIPASA system has 18 variables divided into 4 groups (data, signs, symptoms and laboratory studies) giving them a value of 0.5 to 2, with a maximum score of 16 and, according to the score, the probability of diagnosis is: less than 5 points (unlikely), 5–7 points (low probability), 7.5–11.5 points (high probability), and greater than 12 points (diagnosis of appendicitis).
Regardless of the Alvarado and RIPASA scores for each patient with suspected AA, the surgeon in charge requested complementary studies according to the case. In all patients, complete analysis and urinalysis were requested; abdominal ultrasound was requested in 21 patients, in addition to abdominal X-rays, and in 66 patients only abdominal X-rays were requested, since the probable diagnosis of AA was basically clinical as was the decision to carry out the surgical intervention. It should be mentioned that axial tomography is not a study that is routinely requested at our hospital in cases of suspected AA.
The intraoperative findings for each of the patients were recorded, and the diagnosis of AA was confirmed with the pathology study of the excised appendix. After patients were discharged, they were followed-up in the outpatient setting for at least 30 days.
Statistical AnalysisA descriptive statistical analysis of the demographic data of the population was completed, as well as the analysis of diagnostic tests, using the pathology report as a gold standard (sensitivity, specificity, positive predictive value [PPV], negative predictive value [NPV]). With these data, ROC curves were generated to compare both scores.
Afterwards, we calculated the likelihood ratio. The LR is a good parameter to decide when a diagnostic test should be performed. The LR is calculated by dividing the probability of obtaining a positive result when the subject is ill by the probability of obtaining the same result when he/she is healthy; in other words, sensitivity divided by 1−specificity. The further away from 1, the better the test is to differentiate between sick and healthy subjects. For example, if an LR is 5 (or 5 to 1) the test result will occur 5 times in those in which the disease is present, for each time it occurs in those subjects in whom the disease is absent (LR+ will always be greater than 1 and LR− will be less than 1).
LR+ indicates at what point an individual is more likely to be positive in reality (when the test says it is positive). In contrast, LR− indicates at what point a person is more likely to be negative in reality when the test is positive.
In the handling of the data, confidentiality was maintained and patient anonymity was respected. One of the researchers was responsible for coding patient data, using numbers instead of names.
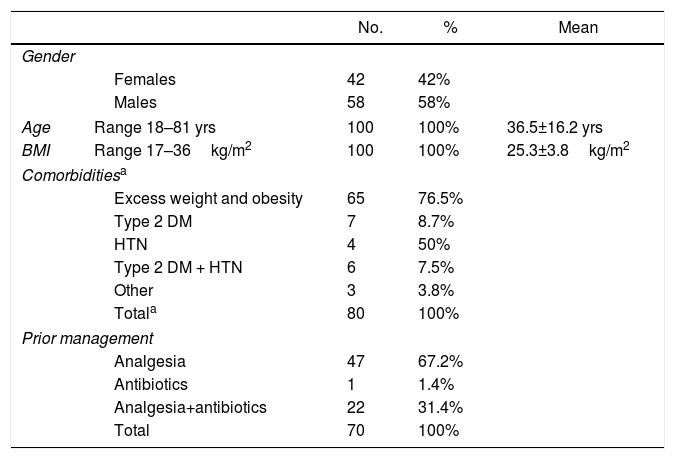
ResultsDuring the recruitment period, out of the 218 patients treated in one year, a total of 100 patients were included in this study (46%); 42 were female and 58 males, with a male:female ratio of 1.7:1 (Table 2). Mean patient age was 36.5±16.2 yrs (range 18–81 yrs). The distribution of AA cases was similar to other reports, predominantly affecting patients between the second and fourth decades of life.
Distribution of the Variables of the Patients Included.
| No. | % | Mean | ||
|---|---|---|---|---|
| Gender | ||||
| Females | 42 | 42% | ||
| Males | 58 | 58% | ||
| Age | Range 18–81 yrs | 100 | 100% | 36.5±16.2 yrs |
| BMI | Range 17–36kg/m2 | 100 | 100% | 25.3±3.8kg/m2 |
| Comorbiditiesa | ||||
| Excess weight and obesity | 65 | 76.5% | ||
| Type 2 DM | 7 | 8.7% | ||
| HTN | 4 | 50% | ||
| Type 2 DM + HTN | 6 | 7.5% | ||
| Other | 3 | 3.8% | ||
| Totala | 80 | 100% | ||
| Prior management | ||||
| Analgesia | 47 | 67.2% | ||
| Antibiotics | 1 | 1.4% | ||
| Analgesia+antibiotics | 22 | 31.4% | ||
| Total | 70 | 100% | ||
The body mass index is calculated by dividing weight in kilos by height squared in meters. Overweight/obese was defined by an abnormal/excessive accumulation of fat. The WHO definitions: BMI equal to or greater than 25 is overweight; BMI equal to or greater than 30 is obese.
DM: diabetes mellitus; HTN: hypertension; BMI: body mass index.
The mean body mass index was 25.3±3.8kg/m2 (range 17–36kg/m2). Out of the total, 70 patients received prior medical management, 65 (92.9%) prescribed by a physician and 5 (7.1%) self-medication; 47 (67.2%) of these patients received only analgesia, 22 (31.4%) patients received analgesia plus antibiotics and one patient (1.4%) only antibiotic.
Pain and hypersensitivity in the right iliac fossa occurred in 100% of the patients, followed by leukocytosis in 91%, pain upon abrupt decompression in 90%, neutrophilia in 90%, guarding in 82%, negative urine test in 80%, increase in body temperature in 75%, anorexia in 73%, nausea and vomiting in 62%, and migration of pain in 44%.
80% of all patients had one or several comorbidities, the most frequent of which was excess weight in 48 patients and obesity in 17 patients (65 patients, 76.5%); 7 (8.7%) patients also had type 2 diabetes mellitus; 4 (5%) patients presented hypertension; 6 (7.5%) presented both; and 3 (3.8%) patients presented other comorbidities.
The average time between the onset of the symptoms and the first medical assessment was 45.5±35h (range 8–144h). The average time that elapsed from the initial assessment by the surgeon until the surgical resolution was 8.5±4.0h (range 2–48h). Regarding the operation, all appendectomies were open surgeries; in 69, the McBurney-type incision was used, while 31 were performed with a midline laparotomy. Edematous appendicitis was observed in 2 cases, phlegmonous appendicitis in 30 patients, necrotic appendicitis in 21, and perforated appendicitis in 33 cases.
Postoperative complications occurred in 8 patients (4 seromas, 2 infections of the surgical site and 2 residual abscesses). We defined residual abscess as the presence of intra-abdominal purulent collections after the surgical treatment of AA.
The rate of negative appendectomies (histologically normal appendix) was 14%. There were no deaths during the present study. The average hospital stay was 3.5±1.8 days (range 1–21 days).
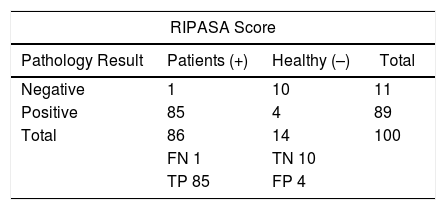
Upon applying the grading systems to the patients in the study, we found that the RIPASA score showed greater diagnostic certainty compared to the Alvarado score, with a sensitivity of 98.8%, specificity 71.4%, PPV 95.5% and NPV 90.9% vs sensitivity 90.7%, specificity 64.3%, PPV 94.1% and NPV 60%, respectively (Table 3). The RIPASA score showed an area under the curve (AUC) of 0.88 compared to the Alvarado score, which is 0.80 (Fig. 1).
2×2 Contingency Table Where the Results Were Obtained.
| RIPASA Score | |||
|---|---|---|---|
| Pathology Result | Patients (+) | Healthy (–) | Total |
| Negative | 1 | 10 | 11 |
| Positive | 85 | 4 | 89 |
| Total | 86 | 14 | 100 |
| FN 1 | TN 10 | ||
| TP 85 | FP 4 | ||
| Alvarado Score | |||
|---|---|---|---|
| Pathology Result | Patients (+) | Healthy (–) | Total |
| Negative | 6 | 9 | 15 |
| Positive | 80 | 5 | 85 |
| Total | 86 | 14 | 100 |
| FN 6 | TN 9 | ||
| TP 80 | FP 5 | ||
| RIPASA Score | |||
|---|---|---|---|
| Sensitivity | Specificity | PPV | NPV |
| 0.99 | 0.71 | 0.96 | 0.91 |
| Alvarado Score | |||
|---|---|---|---|
| Sensitivity | Specificity | PPV | NPV |
| 0.91 | 0.64 | 0.94 | 0.60 |
FN: false negative; FP: false positive; TN: true negative; TP: true positive; NPV: negative predictive value; PPV: positive predictive value.

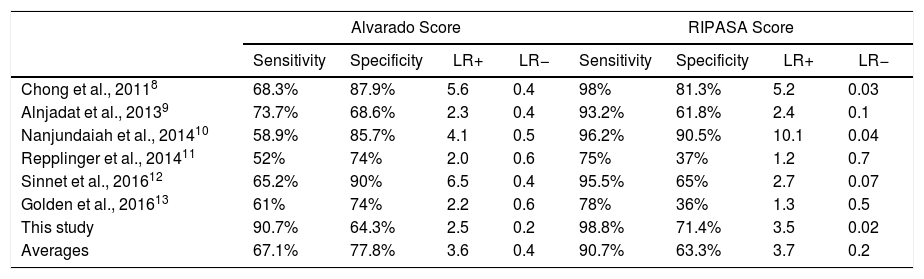
Later, we calculated the LR for our results and for each of the previous similar reports (Table 4). In the case of our study, the positive LR was 3.5 and the negative LR 0.02 for the RIPASA score, compared to the positive LR of 2.5 and the negative LR of 0.2 for the Alvarado score. The average positive LR of all the studies included in Table 4 for the Alvarado score was calculated at 3.6 (range 2.0–6.5) and was slightly higher for the RIPASA score at 3.7 (with a much wider range: 1.2–10.1); the average specificity was 77.8% (64.3%–90%) for the Alvarado scale and 63.3% (36%–90.5%) with a wider range for RIPASA; the average sensitivity was 67.1% (52%–90.7%) vs 90.7% (75%–98.8%) for the Alvarado and RIPASA scores, respectively.
Comparison of the Sensitivity and Specificity of the Alvarado Score and the RIPASA Score in Different Publications.
| Alvarado Score | RIPASA Score | |||||||
|---|---|---|---|---|---|---|---|---|
| Sensitivity | Specificity | LR+ | LR− | Sensitivity | Specificity | LR+ | LR− | |
| Chong et al., 20118 | 68.3% | 87.9% | 5.6 | 0.4 | 98% | 81.3% | 5.2 | 0.03 |
| Alnjadat et al., 20139 | 73.7% | 68.6% | 2.3 | 0.4 | 93.2% | 61.8% | 2.4 | 0.1 |
| Nanjundaiah et al., 201410 | 58.9% | 85.7% | 4.1 | 0.5 | 96.2% | 90.5% | 10.1 | 0.04 |
| Repplinger et al., 201411 | 52% | 74% | 2.0 | 0.6 | 75% | 37% | 1.2 | 0.7 |
| Sinnet et al., 201612 | 65.2% | 90% | 6.5 | 0.4 | 95.5% | 65% | 2.7 | 0.07 |
| Golden et al., 201613 | 61% | 74% | 2.2 | 0.6 | 78% | 36% | 1.3 | 0.5 |
| This study | 90.7% | 64.3% | 2.5 | 0.2 | 98.8% | 71.4% | 3.5 | 0.02 |
| Averages | 67.1% | 77.8% | 3.6 | 0.4 | 90.7% | 63.3% | 3.7 | 0.2 |
LR(+): positive likelihood ratio; LR(−): negative likelihood ratio.
We compared the sensitivity results of both classifications between patients with appendicitis; likewise, among patients without appendicitis we compared the results in terms of specificity (McNemar's test for paired data). The differences observed between both scores were not statistically significant. The AUC values (from both ROC curves) were compared, and the difference was not statistically significant (DeLong technique, Med Cal software).
DiscussionThe purpose of our study was to compare the ability of two clinical scoring systems, the Alvarado and the RIPASA scores, to diagnose or rule out appendicitis since computed tomography, ultrasound and laparoscopy have not been able to reduce the percentage of diagnostic error.14
It has been proposed that the rate of negative appendectomies should not surpass 15%, and at the same time we should reduce the incidence of perforation.14 In order to increase the diagnostic certainty and consequently reduce the percentage of negative appendectomies, these clinical scoring systems have been developed. Our research assessed the utility of such scales in the population of the eastern region of the country, and greater sensitivity and specificity were found with the RIPASA score. ROC curves were generated (Fig. 1), demonstrating a greater AUC for the RIPASA score compared to the Alvarado score; this represents better sensitivity/specificity for the RIPASA scale.
In the study by Golden et al. in the United States, the reported AUC were inverted: 0.67 for the RIPASA score and 0.72 for the Alvarado score.13 This may be due to the population studied, since it has been reported that the RIPASA scale was initially designed for the Asian population because the Alvarado scale did not demonstrate diagnostic reliability in that population.7
With regards to sensitivity and specificity, Velázquez et al. reported that they used the Alvarado score in 113 patients, observing a sensitivity of 99% and a specificity of 62%, which is similar to our data.15 Cedillo et al. observed in 99 patients a higher specificity of the Alvarado score (57%) compared with computerized tomography or ultrasound in the first 24h after onset.16
Within the studies comparing both systems (Table 4), Chong et al. reported for the RIPASA score a sensitivity of 98% and a specificity of 81.3%, while for the Alvarado score they observed a sensitivity of 68.3% and a specificity of 87.9%.8 Alnjadat and Abdallah showed a sensitivity of 93.2% and specificity of 61.8% for RIPASA, and a sensitivity of 73.7% with a specificity of 68.6% for Alvarado.9 Two additional studies11,13 reported the lowest specificity found for the RIPASA scale. Likewise, Sinnet et al.12 demonstrated a specificity of 65% for RIPASA, which was lower than the specificity of 90% for Alvarado.
In contrast, Nanjundaiah et al. reported a sensitivity and specificity for RIPASA of 96.2% and 90.5%, and for Alvarado of 58.9% and 85.7%, respectively.10 Finally, the non-comparative study by Butt et al.17 observed a specificity of 93% and a sensitivity of 96.7% (LR+ 13.8 and LR− 0.04) for the RIPASA score. These studies8–13 show that, in general terms, the RIPASA as well as the Alvarado scores are relatively sensitive and specific for the diagnosis of AA. Some authors have also shown their advantage over imaging studies,16 although this has not been confirmed by others.13 The specificity of RIPASA, as in the article by Nanjundaiah et al.,10 was superior to Alvarado at our hospital (Table 4). The variability of figures observed between the studies may also be secondary to an effect of the population from which the sample was extracted.
Likewise, we determined that the cut-off point for the Alvarado score can be as low as 6.5 (recommended between 7 and 7.510) and 9.25 for the RIPASA score using ROC curves, since this cut-off point obtains a balance between specificity and sensitivity.
Then we approached the task of calculating the positive LR for each comparative report (Table 4), and the average of these studies was slightly higher (3.7 vs 3.6) for the RIPASA scale.
The rate of negative appendectomies reported in our study was 14%, similar to reports in the international literature.14,18,19 The use of these classifications has been reported to have an effect on the percentage of negative appendectomies, and in the study by Chong et al., these authors managed to reduce the rate to only 6.9%.8 Although 70% of patients arrived at our hospital with previous medication (analgesia and antibiotics), this did not reduce the diagnostic effectiveness of the scoring systems.
Despite the fact that 80% of our patients had one or several comorbidities, only 8% of patients presented surgical complications. The average time between the onset of symptoms and the first medical assessment was 45.5h. General practitioners should be trained in the use of these scales to avoid delay in diagnosis.
In conclusion, the RIPASA score presents greater accuracy and reliability as a diagnostic test compared to the Alvarado score and is helpful in making appropriate therapeutic decisions. In hospitals like ours, the diagnosis of AA relies greatly on the clinical evaluation performed by surgeons. An adequate clinical scoring system would avoid diagnostic errors, maintaining a satisfactory low rate of negative appendectomies by adequate patient stratification, while limiting patient exposure to ionizing radiation, since there is an increased risk of developing cancer with computed tomography, particularly for the pediatric age group.13,20
Conflict of InterestsThe authors have no conflict of interests to declare related with this research.
Please cite this article as: Arroyo-Rangel C, Limón IO, Vera ÁG, Guardiola PM, Sánchez-Valdivieso EA. Sensibilidad, especificidad y fiabilidad de la escala RIPASA en el diagnóstico de apendicitis aguda en relación con la escala de Alvarado. Cir Esp. 2018;96:149–154.
