


Say on pay (SOP) is a relatively new governance mechanism that allows shareholders to pronounce on the suitability on executives’ compensation. The literature has mainly examined SOP effects on Anglo Saxon contexts of corporate governance, reporting mixed results and highlighting the need to deepen our understanding of its real impact, as well as its interactions with other mechanisms of governance. Concerning these gaps, the present research analyzes the effectiveness of SOP as a mechanism for aligning CEO compensation in the context of Spanish listed companies – a good representative model of continental European systems of corporate governance–. It also examines the moderating effect of board monitoring and ownership structure. Using panel data and linear regression methodologies on a set of companies from 2013 to 2016, the results show that SOP generally increases the alignment of CEO compensation, although its effectiveness is reduced in companies with overcompensated CEOs and in owner-managed companies.
CEO compensation in large listed companies remains one of the most relevant and controversial topics in current academic debate (Murphy, 2013). Regular, large payments to CEOs highlight the potential for misalignment with firm performance that is generally associated with managerial opportunism (Core et al., 1999; Gomez-Mejia and Wiseman, 1997; Jensen and Murphy, 1990; Tosi et al., 2000). In response to this danger, a set of corporate and institutional mechanisms have been developed to help companies to reduce potential agency conflicts brought about by CEO compensation (Holmstrom, 1979; Jensen and Meckling, 1976; Young et al., 2008). At company level, boards of directors (and compensation committees), the primary and most important governance mechanisms monitoring CEO compensation, have not traditionally been very effective in aligning CEO compensation with firm performance (Hermalin and Weisbach, 2003; Ingley and Walt, 2005; Sanchez-Marin et al., 2010). At an institutional level, the implementation of Codes of Good Governance across different countries (e.g., Cadbury Code, 1992; Final NYSE Corporate Governance Rules, 2003), bringing together a set of recommendations to encourage CEO compensation alignment, have not also brought about greater linkage between CEO compensation and firm performance either (Aguilera and Cuervo-Cazurra, 2004).
These inefficiencies have stimulated the emergence of new mechanisms of corporate governance, among which say on pay (SOP) is one of the most noteworthy (Conyon and Sadler, 2010; Ferri and Maber, 2013; Stathopoulos and Voulgaris, 2016). SOP is an initiative launched by the United Kingdom (UK) by the Directors’ Remuneration Report (2002), in which, with the purpose of greater compensation transparency (Conyon and Sadler, 2010), the board of directors is required to submit CEO compensation to vote at the Annual Shareholder Meeting. A number of countries have followed the UK with the introduction of similar legislation, including the United States (US), Australia, the Netherlands, Norway, Switzerland, and Sweden. In the European Union, 19 countries have already introduced the SOP mechanism, generally as a legal requirement (European Commission Report, 2010), and Spain has not been immune to this tendency, introducing compulsory SOP voting in the Sustainable Economy Act (Ley de Economía Sostenible, 2011).
Although the result of SOP voting is not usually binding – with the exceptions of Scandinavian countries, Netherlands, Switzerland and Japan, which have enforced a binding model, most Continental European countries as well as Anglo-Saxon countries have implemented advisory systems (albeit the UK implemented the binding model in 2014) –, shareholders can show their (dis)satisfaction and their opinion will be one element in the board's considerations when designing CEO compensation (Conyon and Sadler, 2010; Ertimur et al., 2013). Thus, the implementation of SOP could limit the potential discretion and lack of independence of the board designing CEO compensation, promoting transparency by providing a new means for shareholders to express themselves (Conyon and Sadler, 2010), and hence improving corporate governance efficiency in terms of aligning executive compensation with shareholders’ interests (Deane, 2007; Mangen and Magnan, 2012; Pagnattaro and Greene, 2011).
The literature analyzing the effects of SOP is recent and, as such, still sparse. Specific studies examining the consequences of SOP in terms of CEO pay setting process generally has reported mixed results. While some research indicates that SOP is an effective mechanism to align CEO compensation (Cai and Walking, 2011; Ferri and Maber, 2013; Kimbro and Xu, 2016), others do not find clear influences (Alissa, 2015; Conyon and Sadler, 2010), and they may even be directly critical, showing reverse effects of SOP on CEO compensation alignment (Armstrong et al., 2013; Levit and Malenko, 2011). In addition, the effectiveness of SOP within the overall corporate governance framework of the firm remains largely unexplored, and its interaction with other governance mechanisms (e.g., managerial ownership, board independence), as well as with the CEO's power (e.g., entrenchment) has not yet been properly examined. Moreover, the extant literature is largely focused on the Anglo-Saxon environment, with most of papers centered either on the UK (Alissa, 2015; Conyon and Sadler, 2010; Ferri and Maber, 2013; Gregory-Smith et al., 2014) or the US (Armstrong et al., 2013; Balsam et al., 2016; Brunarski et al., 2015; Cai and Walking, 2011; Kimbro and Xu, 2016), which limits the knowledge about the effects of SOP on executive compensation, and its interaction with other aspects of the institutional context of corporate governance with different conditions of ownership structure, shareholders protection, voting rights and capital markets.
Therefore, considering these gaps, and with the aim of drawing a more comprehensive picture of SOP, the purpose of this research is to analyze the effectiveness of SOP as a mechanism for aligning CEO compensation. Specifically, we examine, over a set of 114 Spanish listed companies between 2013 and 2016, both the direct effects of SOP on CEO compensation design and its indirect effects considering the interactive (moderating) influence of other firm governance mechanisms – represented by the board monitoring effectiveness and the ownership structure characteristics. We thus contribute with this research to the literature on shareholder activism, firstly, by increasing the still scarce and contradictory knowledge about the impact of SOP on firm decision-making processes in terms of executive compensation alignment (Krause et al., 2014; Mangen and Magnan, 2012). Secondly, by responding to calls regarding the need to include other firm's corporate governance mechanisms in the analysis of the SOP effectiveness (Stathopoulos and Voulgaris, 2016). Thirdly, by answering the calls concerning the need to incorporate the influence of the institutional environment in the examination of SOP effects on executive compensation practices across countries (Correa and Lel, 2016). Our paper analyzes the impact of SOP in Spain, a representative model of the Continental European system of corporate governance, contributing to a better understanding of SOP consequences by offering a comparison with those in the Anglo-Saxon environment.
The paper is structured as follows. First, the theoretical aspects are set out, leading to the formulation of hypotheses. Then, the methodology is described, to show how the variables are measured and the empirical analyses are performed. Finally, the results are presented and discussed in terms of both academic and practical implications.
Theoretical framework and hypothesesPositive effects of say on payAgency theory proposes that owners of companies should establish governance mechanisms to safeguard their interests in order to minimize conflicts derived from the separation of ownership and management (Holmstrom, 1979; Jensen and Meckling, 1976). Among these mechanisms SOP has been adopted recently for listed firm with the main purpose of monitoring executive compensation (Alissa, 2015; Cai and Walking, 2011; Ferri and Maber, 2013). There are four arguments that support the shareholder-alignment hypothesis (Brunarski et al., 2015) regarding the positive association between a negative SOP voting results and the alignment of CEO compensation with firm performance as a response to ultimately correct agency problems and increase shareholder wealth.
First, SOP reduces information asymmetries, providing more information to shareholders – in order to cast their votes at the Annual Shareholder Meeting – about the CEO compensation policies (Greenstone et al., 2006). Based on this information, the potential adverse publicity and loss of reputation for the CEO, caused by a lack of support shown by SOP, favor a more efficient design of CEO compensation (Ertimur et al., 2013; Grundfest, 1993). In addition, the SOP process increases communication between the compensation committee and shareholders encouraging the former to design executive compensation more carefully based on performance (Correa and Lel, 2016; Deane, 2007). Thus, although the vote is usually advisory, the board of directors does consider SOP voting results in the CEO pay setting process.
Second, shareholders are able to identify and penalize – with a negative vote – CEOs who receive misaligned compensation (Balsam et al., 2016; Kimbro and Xu, 2016). Brunarski et al. (2015) state that shareholders act rationally voting against CEO compensation when it is high – in terms of pay level – but especially when it is misaligned – in terms suboptimal compensation that is only loosely linked to firm performance. This reasoning increases at the extent on which shareholders perceive more potential agency conflicts in their companies in terms of rent expropriations through disproportionate payment levels usually poorly linked with the value of the firm (Alissa, 2015; Young et al., 2008). If companies in this scenario do not react to a low SOP support by aligning CEO compensation, shareholders perceive it negatively, voting against CEO compensation in subsequent SOP processes, in the end forcing the alignment of his/her compensation (Brunarski et al., 2015).
Third, SOP presence increases sensitivity to “rewarding underperformance”. This sensitivity is greater in companies with a high SOP voting dissent and in companies whose executive are compensated without clear performance references (Ferri and Maber, 2013), which leads to a stronger link between CEO compensation and firm performance. This tendency is revealed in the study of Ferri and Maber (2013) who point out that a low SOP support involves a decrease of cases of invariable CEO compensation – by means of removing the most controversial compensation provisions – as well as a significant decline of pay levels together with increases in the alignment of CEO compensation in situations of firm failure. Likewise, Gregory-Smith et al. (2014) report a significant change in executive compensation arrangements (primarily a more aligned compensation) only in cases with high percentages of negative voting.
Finally, although CEO appointment is usually made by the board of directors, he/she is ultimately elected by shareholders. In this context, part of the literature shows that CEO turnover is also influenced by SOP voting results (Alissa, 2015; Armstrong et al., 2013), decreasing when shareholders give a massive SOP support or when, in spite of high levels of SOP dissent, the CEO redirects his/her behavior according to shareholders interests. Since usually the shareholders are interested in the proper alignment of executive compensation, boards of directors and CEOs tends to accept and implement measures to align the CEO pay setting process in order to mitigate agency conflicts.
On the basis of the above arguments, and considering that empirical studies mainly show a significant impact of low SOP support on the CEO compensation setting process (Balsam et al., 2016; Cai and Walking, 2011; Ertimur et al., 2013; Ferri and Maber, 2013; Kimbro and Xu, 2016; Stathopoulos and Voulgaris, 2016), we expect high levels of negative voting to contribute to a greater alignment of CEO compensation to firm performance, thereby reducing agency conflicts. Therefore:Hypothesis 1 Low SOP support influences positively the alignment of CEO compensation.
Critics of SOP claim, based on the agency theory, that shareholders cannot have enough information, incentives and knowledge to reasonably decide on CEO compensation (Alissa, 2015; Gordon, 2009). On the basis of this idea, some authors suggest that it is better for the CEO pay setting process to be left to the board and compensation committee, on the grounds that they are more qualified for this task (Bainbridge, 2009; Loveira, 2011). Since most of shareholders are not able to assess both the CEO compensation package and the pay setting process properly, they often merely accept CEO compensation by assenting in SOP voting (Bainbridge, 2009; Loveira, 2011). Consequently, an important proportion of shareholders cast their vote without a genuine knowledge of how their actions will affect the alignment of CEO compensation with the firm's interests.
Moreover, the effort to understand and discuss CEO compensation can be seen as futile by most shareholders – who are too small to have any significant effect on corporate decisions – because of their belief that their SOP votes will not have enough influence on the board to trigger a significant reaction (Alissa, 2015). For the average shareholder, given the length and complexity of corporate disclosure documents, especially regarding executive compensation, the opportunity cost entailed in becoming informed before voting is quite high (Bainbridge, 2009). Accordingly, the necessary ex-ante investment of time and effort in making informed SOP voting decisions simply is not worthwhile.
Furthermore, from an institutional viewpoint (Oliver, 1992), some studies warn of the influence of the boards in convincing shareholders to vote in favor of CEO compensation, even though this compensations is misaligned, so that SOP fails in its primary role (Levit and Malenko, 2011; Morgan et al., 2006). The firm can engage in impression management (or symbolic compliance) by biasing information about executive compensation, taking the board largely symbolic, rather than substantive, actions in response to shareholder activism (Berrone and Gomez-Mejia, 2009; David et al., 2007; Westphal and Zajac, 1994, 1995, 1998). This behavior supports the window-dressing hypothesis (Brunarski et al., 2015), based on the idea that a CEO who has misaligned compensation, after receiving a low level of SOP voting support, will try to appease shareholders by superficial acts that do not really involve changes that affect their wealth or the value of the company. Mangen and Magnan (2012) point out that misaligned executive compensation that is legitimized by shareholders through a positive SOP voting result will become institutionalized and socially recognized and, consequently, difficult to change without considerable social, functional or political pressure.
These undesirable effects of SOP may occur mostly in firms with overcompensated CEOs – those who receive suboptimal compensation, significantly misaligned from firm performance – receiving a high level of SOP support. In these firms, research has concluded that favorable SOP results generate more misaligned CEO compensation packages in subsequent years (Brunarski et al., 2015; Conyon and Sadler, 2010). As Morgan et al. (2006) suggest, firms with overcompensated CEOs receiving a high proportion of SOP approval might view the vote as a strong endorsement of the boards monitoring and/or their CEOs performance. The vote may signal to the CEO and to the board – which has already signaled their commitment to the overcompensation of the CEO – that shareholders have abdicated their monitoring responsibilities (Brunarski et al., 2015), which may substantially exacerbate further expropriations and agency costs.
All the above arguments lead us to expect that a high level of SOP support in companies with overpaid CEOs will legitimate board of directors pay setting processes, aggravating the subsequent misalignment of CEO compensation with firm performance.Hypothesis 2 High SOP support influences negatively the alignment of CEO compensation in companies with an overcompensated CEO.
Based on the arguments cited in connection with our first hypothesis, which support a positive impact of SOP on pay arrangements conducive to a better alignment of CEO compensation, it is important to analyze the role played by the firm's other governance mechanisms. When SOP works as it is intended, the board of directors and the ownership structure–the two most relevant internal governance mechanisms of a firm–may act as drivers of SOP, either weakening or strengthening its effects on the alignment of CEO compensation. It is expected that the effectiveness of board monitoring, as well as the characteristics of the ownership structure, can have important implications for the effectiveness of SOP in securing alignment in CEO compensation. However, few studies have explicitly investigated the potential interactive effects of SOP together with these other governance mechanisms (Stathopoulos and Voulgaris, 2016).
Regarding board monitoring, Ertimur et al. (2013) indicate that shareholders are likely to be increasingly active when casting their vote if they perceive that there are more independent directors on the board, expecting thus these boards to be more receptive to their views on the alignment of CEO compensation. In addition, Alissa (2015) indicates that the dissatisfaction shown by shareholders in SOP, together with the proportion of independent directors, relates positively to CEO turnover. Concerning ownership structure, Cai and Walking (2011) and Kimbro and Xu (2016) indicate that ownership concentration and the majority presence of external owners or institutional investors increases monitoring of executive pay and the probability that overpaid CEOs will find little support in SOP voting.
Partially combining the effectiveness of board monitoring and the ownership structure (using both as control variables), Conyon and Sadler (2010) find an inverse relationship between the concentration of ownership, the effectiveness of board monitoring and SOP dissension. They show a higher level of SOP support – that is, a more investor approval of the CEO compensation setting processes – as the concentration of institutional ownership and board independence (in terms of growing representation of institutional directors) increases, which ultimately is also correlated with firm performance, indicating an improvement of CEO compensation alignment. This is consistent with the findings of Alissa (2015), who suggests that company boards seem to respond to shareholder dissatisfaction by adjusting CEO compensation decisions, but only to a certain extent, which depends on the structure of ownership and the power of the main shareholders.
From the above we can infer, on a more general level, that the effect of SOP on CEO compensation is moderated by the effectiveness of board monitoring which ultimately depends on the type of majority shareholder. Based on the ownership classification of firms differentiating owner-controlled (OC) companies from owner-managed (OM) companies (Baixauli-Soler and Sanchez-Marin, 2011, 2015; Tosi and Gomez-Mejia, 1994; Young et al., 2008),1Stathopoulos and Voulgaris (2016) maintain that the lower level of board monitoring found in OM companies involves less aligned CEO compensation which, paradoxically, is not necessarily associated with greater dissension in the SOP vote. On the contrary, SOP support is usually higher in OM than in OC companies, because in the former the controlling shareholders, who form part of the firm management team, are voting for their own compensation and usually have the power to secure approval. Accordingly, in OM firms, managers increase rent extraction through executive payments, resulting in both higher and misaligned CEO compensation.
Considering these arguments, it is expected that the effectiveness of board monitoring positively influences the relationship between a low level of SOP support and the alignment of CEO compensation, the relationship being stronger in OC companies than in OM companies. Therefore:Hypothesis 3a The effectiveness of board monitoring exerts a positive moderating effect in the relationship between low SOP support and the alignment of CEO compensation. Low SOP support influences the alignment of CEO compensation more positively in OC companies than in OM companies.
This analysis focuses on listed Spanish companies. This feature of the research is particularly relevant as the previous literature has focused on US and UK listed firms (Brunarski et al., 2015; Conyon and Sadler, 2010; Ferri and Maber, 2013; Mangen and Magnan, 2012), all representatives of the Anglo-Saxon model of corporate governance. The Spanish system of corporate governance, representative of continental European models, is characterized by a high concentration of ownership, the existence of cross-holdings, low protection of minority shareholders, an underdeveloped capital market and a low degree of liquidity, and the presence of a one-board structure in which a single governing body simultaneously performs supervision and direction (Baixauli-Soler and Sanchez-Marin, 2015; De Andres et al., 2005; La Porta et al., 1999). As a result, in Spanish companies, rather than principal–agent conflict (Jensen and Meckling, 1976), principal–principal conflict occurs between majority and minority shareholders (Baixauli-Soler and Sanchez-Marin, 2015; La Porta et al., 1999). In addition, since external or market-based mechanisms of corporate governance are practically non-existent (Sanchez-Marin and Baixauli-Soler, 2014), the type of majority owner, which has a major impact on the effectiveness of the board's monitoring, can influence (and differentiate) the effects of SOP outcomes on the CEO compensation setting process.
Our study comprises 114 firms, from sectors other than the financial sector, and all listed Spanish companies (twelve companies were excluded because their information about SOP or CEO compensation was not available). The study covers the period from 2013 (the first year with available information about SOP voting results) to 2016. Three main sources of information were used for collecting data. First, the Spanish Securities and Exchange Commission (Comisión Nacional del Mercado de Valores), which publishes the Corporate Governance Reports and the Directors Compensation Reports for listed companies annually. The Corporate Governance Reports provide information on corporate governance characteristics including those related to ownership structure and boards of directors. The Directors Compensation Reports provide information on SOP voting results and on CEO compensation. Second, the SABI (Sistema de Análisis de Balances Ibéricos) database provided the economic and financial information of companies. And, third, the Datastream database was used to collect the stock returns of companies.
VariablesCEO compensation (C_CEO). CEO compensation was measured through two variables: (1) CEO cash compensation (cash C_CEO), which is the sum of fixed compensation (sum of fixed cash compensation, compensation for attending commissions, and compensation for membership of other group companies), short-term variable compensation (short-term variable compensation in cash), long-term variable compensation (total of long-term variable compensation in cash and exercised stock options obtained during the year) and payment in kind (total of allowances and other benefits); and (2) CEO total compensation (total C_CEO), which is the CEO cash compensation, plus stock options and shares granted (total market value of stock options and shares granted) and long-term incentive plans (total value of long-term incentive plans). This study uses the natural logarithm of C_CEO to reduce dispersion (Armstrong et al., 2013; Core et al., 1999; Kimbro and Xu, 2016).
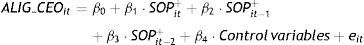
Aligned CEO compensation (ALIG_CEO). To estimate the degree of alignment of CEO compensation with firm performance, we follow the procedure used by Core and colleagues (Core et al., 1999, 2008), that has been extensively used in measuring expected compensation (e.g., Alissa, 2015; Armstrong et al., 2013; Balsam et al., 2016; Brunarski et al., 2015; Cai and Walking, 2011; Correa and Lel, 2016; Ferri and Maber, 2013), and which is obtained by regressing the natural logarithm of CEO compensation on proxies for economic determinants of CEO compensation. Specifically:
where CEO compensation (C_CEO) is measured alternatively as cash compensation (cash C_CEO) and total compensation (total C_CEO); Tenure (TEN) is the number of years the CEO has been in office at the end of year t. We expect that an increase in the tenure indicates an increase in the CEO's influence on the board when designing their compensation (Core et al., 1999); sales (SALES) is the natural logarithm of sales of the company; return on assets (ROA) is calculated as the ratio of net income to the book value of the firm's total assets; stock returns (RET) is the 52 week total return for years t and t−1; and book-to-market (BTM) is the book value of equity divided by market capitalization at the end of year t−1. Finally, we control for the industry of each company through dichotomous variables (dt), calculated from the primary Standard Industrial Classification (SIC) associated with each of them, and we also control the time effect (dt), again controlled through dichotomous variables.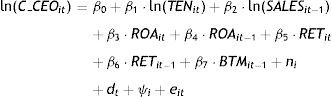
CEO overcompensation. The previous literature argues that CEO overcompensation is an indicator of significant deviations of compensation regarding company performance (Alissa, 2015; Ferri and Maber, 2013). Taking this into account, from aligned CEO compensation we subsequently can estimate CEO overcompensation (OVERC_CEO), calculated as shown in Model 2 (Alissa, 2015; Brunarski et al., 2015): the logarithm of CEO compensation–considering alternatively cash compensation (cash C_CEO) and total compensation (total C_CEO) – divided by aligned CEO compensation – also considering alternatively cash aligned compensation (cash ALIG_CEO) and total aligned compensation (total ALIG_CEO).
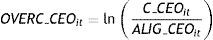
Furthermore, following the procedure of Brunarski et al. (2015), CEOs are classified through a dichotomous variable: DOVERC_CEO, which takes the value 1 when the CEO is overcompensated – that is, when his/her compensation is above the median – and 0 otherwise.
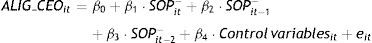
SOP support. Considering that SOP support is a positive assessment of CEO compensation when shareholders vote in favor and a negative assessment when shareholders vote against or abstain (Conyon and Sadler, 2010; Ferri and Maber, 2013; Hooghiemstra et al., 2015), we measured SOP through (1) SOP support and (2) shareholder satisfaction. First, SOP support considers the percentage of votes (positive, negative and abstentions) from the total number of votes that each company receives in each period. From this definition, we create two variables: low SOP support (SOP−), defined as the sum of the percentage of negative votes and abstentions, and high SOP support (SOP+), defined as the percentage of positive votes (Conyon and Sadler, 2010; Correa and Lel, 2016; Ferri and Maber, 2013). Second, shareholder satisfaction is based on the proportion of favorable votes regarding the appropriateness of CEO compensation (Brunarski et al., 2015; Pagnattaro and Greene, 2011). We create from this approach a dichotomous variable, DSOP, which takes the value 1 when the percentage of favorable votes is below to the median value for positive votes (dissatisfied shareholders), and takes the value 0 when the percentage of favorable votes is equal to or higher than the median (satisfied shareholders). We use this dummy variable to segment the sample between companies with dissatisfied shareholders and companies with satisfied shareholders.
Firm's governance mechanisms. We operationalized firm's governance mechanisms through both the effectiveness of monitoring by the board and the characteristics of the ownership structure. The effectiveness of board monitoring is proxied by two variables representing the degree of independence of boards in taking decision about CEO pay (Balsam et al., 2016; Ertimur et al., 2013; Ferri and Maber, 2013): (1) board independence (INDEP), a variable that measures the number of independent directors as a proportion of the total number of directors (Conyon and Peck, 1998); and (2) duality (DUAL), a dichotomous variable that takes the value 1 when the same individual is chairman of the board and CEO of the company, and 0 otherwise (Boyd, 1994). Ownership structure is represented by the type of majority shareholder control in the company, measured following the procedure used by Tosi and Gomez-Mejia (1994). Companies are classified into three groups: owner-controlled companies (OC), owner-managed companies (OM) and manager-controlled companies (MC). If any single individual or institution outside the firm owns 5% or more of the company's stock, the classification is OC. The firm is classified as OM if any individual within the firm (including the CEO) owns 5% or more of the company's stock. If the above criteria are not met, the company is considered to have dispersed ownership, and the classification is MC.
Control variables. In addition to the variables that indirectly control for CEO compensation in Model 1, we consider some additional variables that potentially influence CEO compensation. The percentage of ownership in the CEO's hands (OWN_CEO), indicates the extent of CEO power to influence the design of his/her own compensation (Core et al., 2008; Tosi et al., 2000). Ownership concentration (HERF) is measured by the Herfindahl index (Baixauli-Soler and Sanchez-Marin, 2011; Bushee, 1998). This index is the sum of the squares of the market shares of the four largest shareholders expressed as fractions, and ranges from 0 (dispersed ownership) to 1 (concentrated ownership). Business complexity (COMPL), measured by the logarithm of the ratio of intangible assets to the firm total assets (Carpenter and Sanders, 2002; Finkelstein and Boyd, 1998). Leverage (LEV), is calculated as the long-term and current debt divided by the book value of equity (Armstrong and Vashishtha, 2012). Finally, business diversification (DIV), proxied by the number of four-digit secondary SIC codes associated with the company (Miller et al., 2002).
ModelsTo test the hypotheses we use a regression analysis on Eqs. (3)–(5), considering alternatively as dependent variables cash and total compensation. The base years used are 2015 and 2016, since we can analyze the effects after two periods – there are thus two delays.
First, we test the influence of a low SOP support on alignment of CEO compensation. Eq. (3) is estimated using first the whole sample of companies and subsequently dividing the sample into two subgroups: (1) companies with dissatisfied shareholders (DSOP takes the value 1); and (2) companies with satisfied shareholders (DSOP takes the value 0). The dependent variable is aligned CEO compensation, which we estimate with the model of Core et al. (1999, 2008) (see Eq. (1)). The independent variables are low SOP support (SOP–) and the control variables. We expect β2 and β3 indicate a significant and positive influence on aligned CEO compensation, mainly in companies with dissatisfied shareholders. However, we do not expect β1 to have any effect, because this effect is deferred to subsequent periods (Cai and Walking, 2011; Ertimur et al., 2013; Ferri and Maber, 2013; Kimbro and Xu, 2016).
Second, to test the second hypothesis we formulate Eq. (4), which is estimated using the whole sample of companies and, subsequently, dividing the sample into two subgroups: (1) companies whose CEOs are overcompensated (DOVERC_CEO takes the value 1); and (2) companies whose CEOs are not overcompensated (DOVERC_CEO takes the value 0). The dependent and independent variables are the same as used previously, with the exception of SOP which is measured through high SOP support (SOP+). We expect β2 and β3 to have a significant and negative influence on alignment of CEO compensation when the sample is restricted to the subgroup of companies whose CEOs are overcompensated. Meanwhile, as in the previous model, we do not expect β1 to have any effect (Conyon and Sadler, 2010; Brunarski et al., 2015).
Finally, Eq. (5) is formulated to test Hypothesis 3. In this model, we add the moderating effect of effectiveness of board monitoring. The dependent variable is alignment of CEO compensation, and the independent variables are low SOP support (SOP−), the effectiveness of board monitoring – measured by the degree of independence of the board and duality – the interaction effect between low SOP support and supervisory effectiveness of the board and the control variables. To test Hypothesis 3a, first, we estimate using the whole sample of companies that are controlled by owners or managers and, subsequently, to test Hypothesis 3b, two subgroups are distinguished to analyze the effectiveness of board monitoring: OC companies (59 firms) and OM companies (52 firms), removing MC companies of our analyses due to their insignificance representativeness (only 3 firms). We expect the same signs for β1, β2 and β3 as we obtained in Eq. (3). In addition, we expect a positive and significant influence for β4, β8 and β10 on alignment of CEO compensation, because board independence favors the alignment of CEO compensation. In contrast, we expect a significant and negative influence for β5, β9 and β11 because duality limits the alignment of CEO compensation. As in the previous models, we do not expect β6 and β7 to have any effect. In addition, we compare OC and OM expecting the moderating effect of the effectiveness of board monitoring to be greater in OC companies than OM companies.
ResultsDescriptive statistics and correlations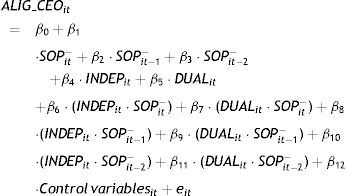
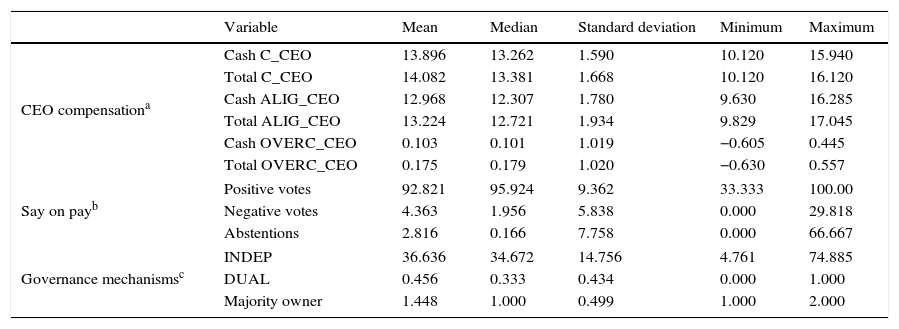
Table 1 contains a description of basic statistics. Regarding CEO compensation, the values (in logarithms) shown in Table 1 indicate that the average CEO cash compensation amounts to one million euros, rising to one and a half million euros when total compensation is considered. In addition, the standard deviations indicate the existence of a large compensation gap between CEOs. Regarding aligned CEO compensation, as shown in the previous literature (Alissa, 2015; Brunarski et al., 2015), the total compensation for CEOs is, on average, more than what may be considered optimal. Furthermore, overcompensated CEOs receive a high level of excess compensation, as CEOs obtain additional payments not linked to the economic and financial indicators of the company. However, the large standard deviation indicates that compensation excess (or deficit) varies depending on the firm. Regarding SOP voting results, more than 92% of shareholders approve CEO compensation, while about 8% show their dissatisfaction by casting a negative vote or abstaining. These results are consistent with evidence given in the literature (Conyon and Sadler, 2010). In relation to corporate governance variables, the average proportion of independent directors on boards is 37%, ranging from 5% to 75%. The average duality is 0.45, indicating that a half of the companies have the CEO and chairman positions occupied by the same person. Concerning the type of majority owner, although there is certain balance between OC and OM companies, OC companies (59 firms) predominate over OM companies (52 firms).
Summary of sample characteristics (2013–2016).
| Variable | Mean | Median | Standard deviation | Minimum | Maximum | |
|---|---|---|---|---|---|---|
| CEO compensationa | Cash C_CEO | 13.896 | 13.262 | 1.590 | 10.120 | 15.940 |
| Total C_CEO | 14.082 | 13.381 | 1.668 | 10.120 | 16.120 | |
| Cash ALIG_CEO | 12.968 | 12.307 | 1.780 | 9.630 | 16.285 | |
| Total ALIG_CEO | 13.224 | 12.721 | 1.934 | 9.829 | 17.045 | |
| Cash OVERC_CEO | 0.103 | 0.101 | 1.019 | −0.605 | 0.445 | |
| Total OVERC_CEO | 0.175 | 0.179 | 1.020 | −0.630 | 0.557 | |
| Say on payb | Positive votes | 92.821 | 95.924 | 9.362 | 33.333 | 100.00 |
| Negative votes | 4.363 | 1.956 | 5.838 | 0.000 | 29.818 | |
| Abstentions | 2.816 | 0.166 | 7.758 | 0.000 | 66.667 | |
| Governance mechanismsc | INDEP | 36.636 | 34.672 | 14.756 | 4.761 | 74.885 |
| DUAL | 0.456 | 0.333 | 0.434 | 0.000 | 1.000 | |
| Majority owner | 1.448 | 1.000 | 0.499 | 1.000 | 2.000 | |
Cash C_CEO is the logarithm of cash compensation received by the CEO and the total C_CEO is the logarithm of total compensation received by the CEO; ALIG_CEO is the logarithm of estimated compensation through the model of Core et al. (1999, 2008) (cash and total); and OVERC_CEO is the logarithm of CEO overcompensation (cash and total).
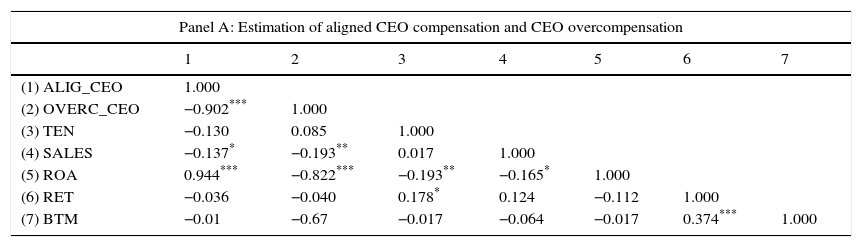
Table 2 contains correlations between the set of variables. Panel A shows correlations of variables that use the model of Core et al. (1999, 2008) to estimate the alignment of CEO compensation. Panel B shows correlations of variables related to the hypothesis testing. In Panel A, the high negative correlation between ALIG_CEO and OVERC_CEO is striking as well as the correlations between compensation variables and ROA. Moreover, sales are negatively correlated with ALIG_CEO and OVERC_CEO. In Panel B, compensation variables (ALIG_CEO and OVERC_CEO) and SOP variables (SOP+ and SOP−) are negatively correlated to each other. In addition, the correlation between board independence/duality and SOP variables is also significant. The correlation between the remaining explanatory variables is not high. Also, VIF values are less than 5 and condition indexes are less than 30, indicating an absence of significant multicollinearity between independent variables (Hair et al., 1999).
Correlations between variables.a
| Panel A: Estimation of aligned CEO compensation and CEO overcompensation | |||||||
|---|---|---|---|---|---|---|---|
| 1 | 2 | 3 | 4 | 5 | 6 | 7 | |
| (1) ALIG_CEO | 1.000 | ||||||
| (2) OVERC_CEO | −0.902*** | 1.000 | |||||
| (3) TEN | −0.130 | 0.085 | 1.000 | ||||
| (4) SALES | −0.137* | −0.193** | 0.017 | 1.000 | |||
| (5) ROA | 0.944*** | −0.822*** | −0.193** | −0.165* | 1.000 | ||
| (6) RET | −0.036 | −0.040 | 0.178* | 0.124 | −0.112 | 1.000 | |
| (7) BTM | −0.01 | −0.67 | −0.017 | −0.064 | −0.017 | 0.374*** | 1.000 |
| Panel B: SOP support and aligned CEO compensation | |||||||||||
|---|---|---|---|---|---|---|---|---|---|---|---|
| 1 | 2 | 3 | 4 | 5 | 6 | 7 | 8 | 9 | 10 | 11 | |
| (1) ALIG_CEO | 1.000 | ||||||||||
| (2) OVERC_CEO | −0.902*** | 1.000 | |||||||||
| (3) SOP+ | 0.010 | −0.082 | 1.000 | ||||||||
| (4) SOP− | −0.010 | 0.082 | −0.78*** | 1.000 | |||||||
| (5) INDEP | −0.022 | 0.059 | −0.212** | 0.212** | 1.000 | ||||||
| (6) DUAL | 0.051 | −0.005 | −0.126* | 0.126* | 0.211** | 1.000 | |||||
| (7) OWN_CEO | −0.101 | 0.107 | 0.164* | −0.164* | 0.099 | 0.279*** | 1.000 | ||||
| (8) HERF | −0.030 | 0.046 | −0.036 | 0.036 | −0.016 | −0.128 | −0.012 | 1.000 | |||
| (9) LEV | −0.007 | 0.032 | 0.109 | −0.109 | −0.064 | −0.157* | 0.067 | 0.037 | 1.000 | ||
| (10) COMPL | 0.021 | −0.092 | −0.084 | 0.084 | −0.087 | −0.117 | −0.074 | −0.027 | 0.009 | 1.000 | |
| (11) DIV | −0.142 | 0.146* | 0.031 | −0.031 | 0.094 | −0.104 | −0.021 | −0.082 | −0.005 | −0.061 | 1.000 |
ALIG_CEO is the logarithm of estimated compensation through the model of Core et al. (1999, 2008); OVERC_CEO is the logarithm of CEO overcompensation; SOP+ is the percentage of positive votes received by each company in the SOP; SOP− is the sum of the percentage of negative votes and abstentions received by each company in the SOP; INDEP is measured by the percentage of independent outside directors on the board of directors; DUAL is measured by a dummy – 1 if there is duality and 0 otherwise; TEN is the logarithm of the time, in years, the CEO has spent in office; SALES is logarithm of sales, in euros, of each company; ROA is the return on assets; RET is the 52 week total return; BTM represents the book to market ratio, considered as the book value of assets divided by market capitalization; OWN_CEO is the percentage of ownership in the hands of the CEO; HERF measures the degree of concentration of ownership through Herfindahl index; LEV represents the degree of leverage of the company; COMPL refers to the level of business complexity; DIV measures the degree of diversification of the company.
Regarding estimation of aligned CEO compensation, we use panel data methodology in order to control for the unobservable heterogeneity, preventing biased results. In view of the Hausman test results (Hausman, 1978), we can better estimate aligned CEO compensation using the random effects approach. Our results (available upon request to the authors) indicate that the main determinants are the length of CEO tenure, the company sales in the previous year and the ROA in the current and previous years. These results are similar to those of Core et al. (2008) and Brunarski et al. (2015). Based on aligned CEO compensation, we calculate CEO overcompensation, using Equation 2, which represents the excess in CEO compensation based on the ratio between CEO compensation and aligned CEO compensation. As shown in Table 1, the results indicate that approximately 10% of CEO cash compensation is overcompensation, while this excess rises to 20% if we consider CEO total compensation.
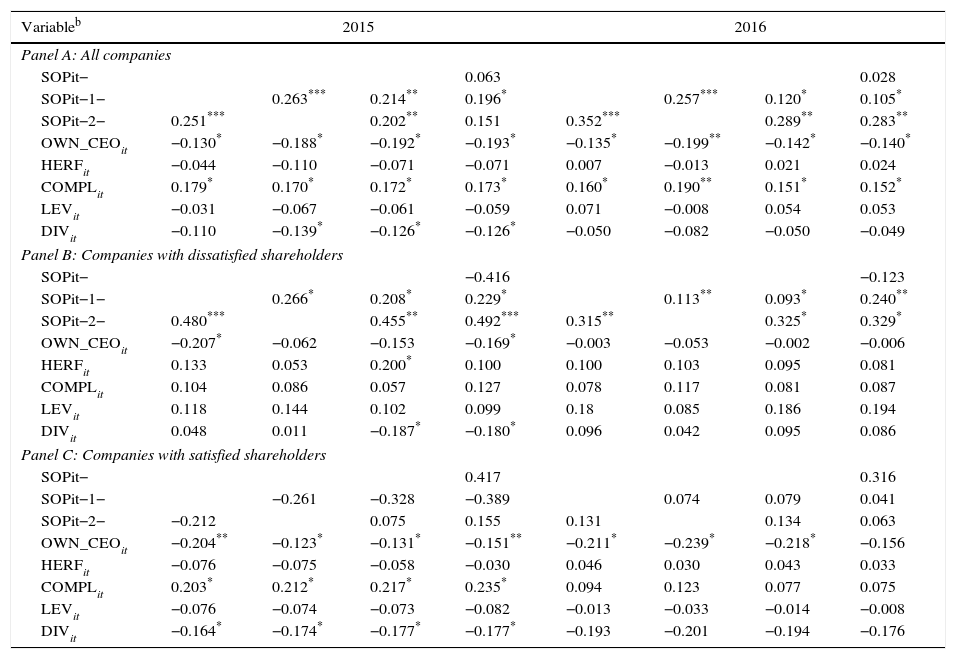
Testing the hypothesesTable 3 shows the regressions of Model 3 to test Hypothesis 1. First, we estimate the model using the whole sample, obtaining a significant and positive influence of low SOP support on aligned CEO compensation in the following years, which indicates that SOP results influence CEO compensation arrangements in the following years. Second, in order to analyze the moderating effects of shareholder satisfaction with CEO compensation, the sample was divided into two subgroups – companies with dissatisfied shareholders and companies with satisfied shareholders. In companies with dissatisfied shareholders results are similar to those for the whole sample. In contrast, in companies with satisfied shareholders, the effect of a low SOP support on the alignment of CEO compensation is not significant because shareholders do not feel the need to change compensation packages. These results are consistent and confirm Hypothesis 1. Regarding the control variables, CEO ownership is the variable with the greatest influence on the design of aligned compensation. In particular, its impact is negative, which means that an increase in CEO ownership implies greater CEO power and, thus, a decrease in aligned compensation. In addition, company diversification has a negative impact on aligned compensations, while the company complexity had a positive impact in 2015, but in 2016 the impact of complexity was only significant in Panel A.
Low SOP support and aligned CEO compensation.a
| Variableb | 2015 | 2016 | ||||||
|---|---|---|---|---|---|---|---|---|
| Panel A: All companies | ||||||||
| SOPit− | 0.063 | 0.028 | ||||||
| SOPit−1− | 0.263*** | 0.214** | 0.196* | 0.257*** | 0.120* | 0.105* | ||
| SOPit−2− | 0.251*** | 0.202** | 0.151 | 0.352*** | 0.289** | 0.283** | ||
| OWN_CEOit | −0.130* | −0.188* | −0.192* | −0.193* | −0.135* | −0.199** | −0.142* | −0.140* |
| HERFit | −0.044 | −0.110 | −0.071 | −0.071 | 0.007 | −0.013 | 0.021 | 0.024 |
| COMPLit | 0.179* | 0.170* | 0.172* | 0.173* | 0.160* | 0.190** | 0.151* | 0.152* |
| LEVit | −0.031 | −0.067 | −0.061 | −0.059 | 0.071 | −0.008 | 0.054 | 0.053 |
| DIVit | −0.110 | −0.139* | −0.126* | −0.126* | −0.050 | −0.082 | −0.050 | −0.049 |
| Panel B: Companies with dissatisfied shareholders | ||||||||
| SOPit− | −0.416 | −0.123 | ||||||
| SOPit−1− | 0.266* | 0.208* | 0.229* | 0.113** | 0.093* | 0.240** | ||
| SOPit−2− | 0.480*** | 0.455** | 0.492*** | 0.315** | 0.325* | 0.329* | ||
| OWN_CEOit | −0.207* | −0.062 | −0.153 | −0.169* | −0.003 | −0.053 | −0.002 | −0.006 |
| HERFit | 0.133 | 0.053 | 0.200* | 0.100 | 0.100 | 0.103 | 0.095 | 0.081 |
| COMPLit | 0.104 | 0.086 | 0.057 | 0.127 | 0.078 | 0.117 | 0.081 | 0.087 |
| LEVit | 0.118 | 0.144 | 0.102 | 0.099 | 0.18 | 0.085 | 0.186 | 0.194 |
| DIVit | 0.048 | 0.011 | −0.187* | −0.180* | 0.096 | 0.042 | 0.095 | 0.086 |
| Panel C: Companies with satisfied shareholders | ||||||||
| SOPit− | 0.417 | 0.316 | ||||||
| SOPit−1− | −0.261 | −0.328 | −0.389 | 0.074 | 0.079 | 0.041 | ||
| SOPit−2− | −0.212 | 0.075 | 0.155 | 0.131 | 0.134 | 0.063 | ||
| OWN_CEOit | −0.204** | −0.123* | −0.131* | −0.151** | −0.211* | −0.239* | −0.218* | −0.156 |
| HERFit | −0.076 | −0.075 | −0.058 | −0.030 | 0.046 | 0.030 | 0.043 | 0.033 |
| COMPLit | 0.203* | 0.212* | 0.217* | 0.235* | 0.094 | 0.123 | 0.077 | 0.075 |
| LEVit | −0.076 | −0.074 | −0.073 | −0.082 | −0.013 | −0.033 | −0.014 | −0.008 |
| DIVit | −0.164* | −0.174* | −0.177* | −0.177* | −0.193 | −0.201 | −0.194 | −0.176 |
The dependent variable is total compensation. Results obtained for cash compensation are similar to these and are available upon request to the authors. The whole sample is 114 companies – 57 are companies with unsatisfied shareholders and 57 are companies with satisfied shareholders.
SOP− is the sum of the percentage of negative votes and abstentions received by each company in the SOP; OWN_CEO is the percentage of ownership in the hands of the CEO; HERF measures the degree of ownership concentration through the Herfindahl index; COMPL refers to the level of business complexity; LEV represents the degree of leverage of the company; DIV measures the degree of diversification of the company.
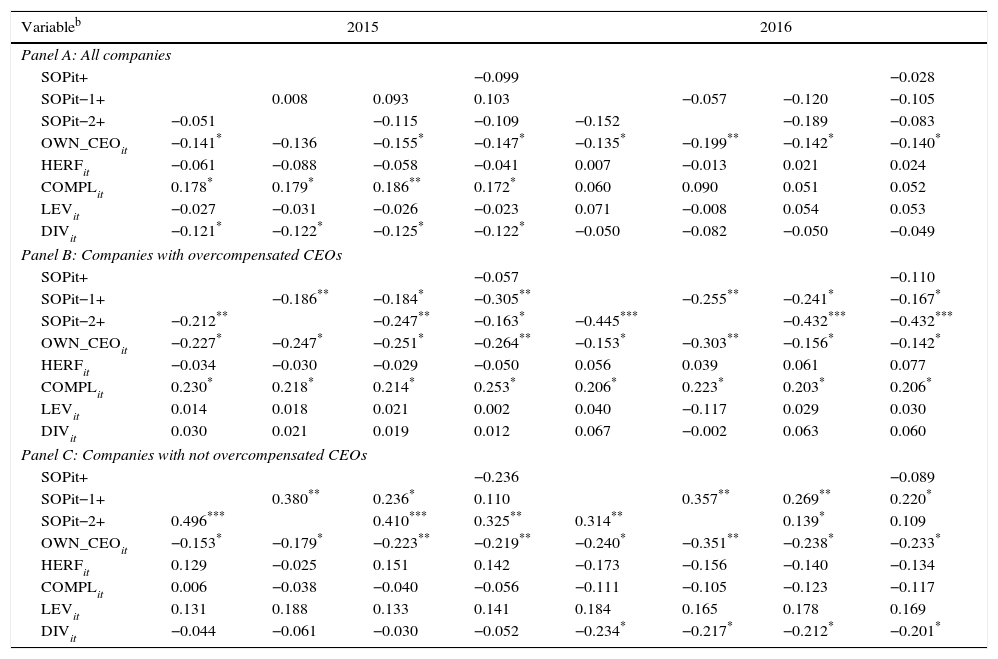
Table 4 shows the regressions of Model 4 to test Hypothesis 2, where we analyze the influence of a high level of SOP support on overcompensated CEOs. When we estimate the model using the whole sample, the effect of a high level of SOP support on aligned CEO compensation is not significant. However, in the subsample of companies with overcompensated CEOs we find that a high level of SOP support from shareholders in previous years has a significant and negative influence on aligned CEO compensation. In these companies, although it makes that there should be a negative vote – because the CEOs are overcompensated – the shareholders legitimize the inefficient compensation, which leads to more misaligned designs of CEO compensation in future. In companies with CEOs who are not overcompensated, the influence of a high level of SOP support is also significant, but positive, which indicates that shareholders agree with the aligned design of CEO compensation. These results confirm Hypothesis 2. SOP does not have a significant influence in the same year, which is consistent with our expectations. In addition, regarding the control variables, CEO ownership is again the variable with the greatest influence (negative) on the design of aligned CEO compensation. On the other hand, in Panel A, complexity has a positive effect and diversity has a negative effect in 2015. In 2016 neither complexity nor diversity are significant. In Panel B, complexity has a positive influence on aligned compensation in both years. Finally, in Panel C, diversity has a negative influence in 2016.
High SOP support and aligned CEO compensation.a
| Variableb | 2015 | 2016 | ||||||
|---|---|---|---|---|---|---|---|---|
| Panel A: All companies | ||||||||
| SOPit+ | −0.099 | −0.028 | ||||||
| SOPit−1+ | 0.008 | 0.093 | 0.103 | −0.057 | −0.120 | −0.105 | ||
| SOPit−2+ | −0.051 | −0.115 | −0.109 | −0.152 | −0.189 | −0.083 | ||
| OWN_CEOit | −0.141* | −0.136 | −0.155* | −0.147* | −0.135* | −0.199** | −0.142* | −0.140* |
| HERFit | −0.061 | −0.088 | −0.058 | −0.041 | 0.007 | −0.013 | 0.021 | 0.024 |
| COMPLit | 0.178* | 0.179* | 0.186** | 0.172* | 0.060 | 0.090 | 0.051 | 0.052 |
| LEVit | −0.027 | −0.031 | −0.026 | −0.023 | 0.071 | −0.008 | 0.054 | 0.053 |
| DIVit | −0.121* | −0.122* | −0.125* | −0.122* | −0.050 | −0.082 | −0.050 | −0.049 |
| Panel B: Companies with overcompensated CEOs | ||||||||
| SOPit+ | −0.057 | −0.110 | ||||||
| SOPit−1+ | −0.186** | −0.184* | −0.305** | −0.255** | −0.241* | −0.167* | ||
| SOPit−2+ | −0.212** | −0.247** | −0.163* | −0.445*** | −0.432*** | −0.432*** | ||
| OWN_CEOit | −0.227* | −0.247* | −0.251* | −0.264** | −0.153* | −0.303** | −0.156* | −0.142* |
| HERFit | −0.034 | −0.030 | −0.029 | −0.050 | 0.056 | 0.039 | 0.061 | 0.077 |
| COMPLit | 0.230* | 0.218* | 0.214* | 0.253* | 0.206* | 0.223* | 0.203* | 0.206* |
| LEVit | 0.014 | 0.018 | 0.021 | 0.002 | 0.040 | −0.117 | 0.029 | 0.030 |
| DIVit | 0.030 | 0.021 | 0.019 | 0.012 | 0.067 | −0.002 | 0.063 | 0.060 |
| Panel C: Companies with not overcompensated CEOs | ||||||||
| SOPit+ | −0.236 | −0.089 | ||||||
| SOPit−1+ | 0.380** | 0.236* | 0.110 | 0.357** | 0.269** | 0.220* | ||
| SOPit−2+ | 0.496*** | 0.410*** | 0.325** | 0.314** | 0.139* | 0.109 | ||
| OWN_CEOit | −0.153* | −0.179* | −0.223** | −0.219** | −0.240* | −0.351** | −0.238* | −0.233* |
| HERFit | 0.129 | −0.025 | 0.151 | 0.142 | −0.173 | −0.156 | −0.140 | −0.134 |
| COMPLit | 0.006 | −0.038 | −0.040 | −0.056 | −0.111 | −0.105 | −0.123 | −0.117 |
| LEVit | 0.131 | 0.188 | 0.133 | 0.141 | 0.184 | 0.165 | 0.178 | 0.169 |
| DIVit | −0.044 | −0.061 | −0.030 | −0.052 | −0.234* | −0.217* | −0.212* | −0.201* |
The dependent variable is total compensation. Results obtained for cash compensation are similar to these and are available upon request to the authors. The whole sample is 114 companies – 57 of them are companies with overcompensated CEOs.
SOP+ is the percentage of positive votes received by each company in the SOP; OWN_CEO is the percentage of ownership in the hands of the CEO; HERF measures the degree of ownership concentration through the Herfindahl index; COMPL refers to the level of business complexity; LEV represents the degree of leverage of the company; DIV measures the degree of diversification of the company.
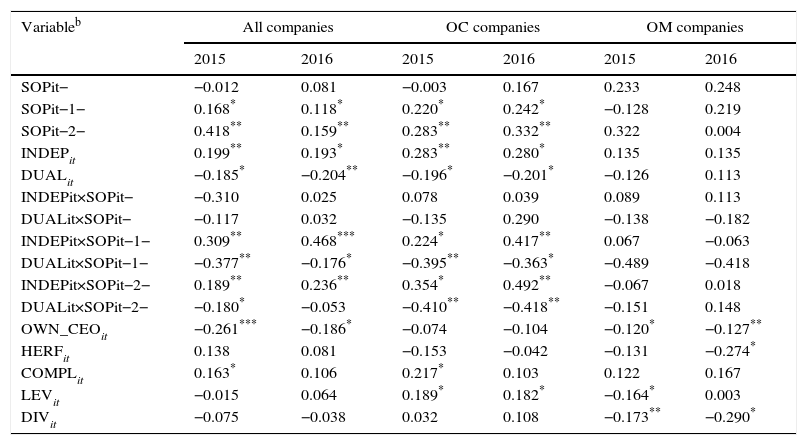
Finally, Table 5 contains the regressions of Model 5 to test Hypothesis 3. For this purpose, we use the sample of 111 concentrated companies, which are respectively controlled by owners (OC firms) or managers (OM firms). Using the whole sample to test Hypothesis 3a, we find a positive and significant effect of a low level of SOP support in previous voting on aligned CEO compensation, as was also found in relation to Hypothesis 1. In addition, we find a moderating effect of the effectiveness of board monitoring. The degree of board independence and non-duality structure positively moderate the relationship between a low level of SOP support and the alignment of CEO compensation, thus confirming Hypothesis 3a.
Moderating effects of board monitoring and ownership structure.a
| Variableb | All companies | OC companies | OM companies | |||
|---|---|---|---|---|---|---|
| 2015 | 2016 | 2015 | 2016 | 2015 | 2016 | |
| SOPit− | −0.012 | 0.081 | −0.003 | 0.167 | 0.233 | 0.248 |
| SOPit−1− | 0.168* | 0.118* | 0.220* | 0.242* | −0.128 | 0.219 |
| SOPit−2− | 0.418** | 0.159** | 0.283** | 0.332** | 0.322 | 0.004 |
| INDEPit | 0.199** | 0.193* | 0.283** | 0.280* | 0.135 | 0.135 |
| DUALit | −0.185* | −0.204** | −0.196* | −0.201* | −0.126 | 0.113 |
| INDEPit×SOPit− | −0.310 | 0.025 | 0.078 | 0.039 | 0.089 | 0.113 |
| DUALit×SOPit− | −0.117 | 0.032 | −0.135 | 0.290 | −0.138 | −0.182 |
| INDEPit×SOPit−1− | 0.309** | 0.468*** | 0.224* | 0.417** | 0.067 | −0.063 |
| DUALit×SOPit−1− | −0.377** | −0.176* | −0.395** | −0.363* | −0.489 | −0.418 |
| INDEPit×SOPit−2− | 0.189** | 0.236** | 0.354* | 0.492** | −0.067 | 0.018 |
| DUALit×SOPit−2− | −0.180* | −0.053 | −0.410** | −0.418** | −0.151 | 0.148 |
| OWN_CEOit | −0.261*** | −0.186* | −0.074 | −0.104 | −0.120* | −0.127** |
| HERFit | 0.138 | 0.081 | −0.153 | −0.042 | −0.131 | −0.274* |
| COMPLit | 0.163* | 0.106 | 0.217* | 0.103 | 0.122 | 0.167 |
| LEVit | −0.015 | 0.064 | 0.189* | 0.182* | −0.164* | 0.003 |
| DIVit | −0.075 | −0.038 | 0.032 | 0.108 | −0.173** | −0.290* |
The dependent variable is total compensation. Results obtained for cash compensation are similar to these and are available upon request to the authors. The sample used is 111 companies – 59 are OC companies and 52 are OM companies. MC firms have been removed from the analyses.
INDEP is measured by the percentage of independent outside directors on the board of directors; DUAL is measured by a dummy – 1 if there is duality and 0 otherwise; OWN_CEO is the percentage of ownership in the hands of the CEO; HERF measures the degree of ownership concentration through the Herfindahl index; COMPL refers to the level of business complexity; LEV represents the degree of leverage of the company; DIV measures the degree of diversification of the company.
The sample of companies was divided into the two subgroups, 59 OC firms and 52 OM firms, to test Hypothesis 3b. As can be seen in Table 5, in OC companies there is a positive and significant effect of a low level of SOP support on aligned CEO compensation. Meanwhile, in OM companies, the results are not significant, indicating that in these firms a low level of SOP support has no influence on subsequent CEO compensation alignment. Regarding the moderating role played by the effectiveness of board monitoring, in OC companies we observe that the proportion of independent directors on the board has a significant and positive effect on aligned CEO compensation, and that the interaction between SOP and board independence is significant. We also note that, as expected, duality has a significant and negative effect on aligned CEO compensation, as well as the interaction term. Moreover, in OM companies, the effectiveness of board monitoring has no impact on the relationship between SOP and aligned compensation. In short, the moderating effect of the supervisory effectiveness of the board is greater in OC companies than OM companies (where SOP results do not have any influence on the alignment of CEO compensation), thus confirming Hypothesis 3b. Finally, regarding the control variables, in OM firms, CEO ownership is the most influential variable, with a negative impact on aligned compensation.
Conclusions and discussionSOP is “a mechanism that allows shareholders to influence CEO pay, by giving them an advisory vote regarding the remuneration report” (Hooghiemstra et al., 2015:775). This study focuses on the role of SOP in promoting the effectiveness of corporate governance by providing an additional channel for the expression of shareholder “voice” (Stathopoulos and Voulgaris, 2016) regarding CEO compensation arrangements. Using a sample of 114 listed companies from 2013 to 2016, this study contributes to the literature in several ways. First, it extends our knowledge about the real effectiveness of SOP as a mechanism for adjusting and aligning CEO compensation (Krause et al., 2014; Mangen and Magnan, 2012). Second, it shows how important the internal governance mechanisms, such as the board of directors and the ownership structure, of companies are, as elements exercising an indirect influence on the effectiveness of SOP in terms of CEO compensation arrangements (Stathopoulos and Voulgaris, 2016). And third, it highlights the peculiarities of SOP in a particular context of Spanish listed companies. The Spanish case is representative of the continental European system of corporate governance and is significantly different from Anglo-Saxon schemes of governance (Correa and Lel, 2016; Sanchez-Marin et al., 2011).
Our results indicate that SOP plays an important role in Spanish listed companies, although we can distinguish two contrasting faces of this mechanism. A positive version indicates that a low level of SOP support, in companies with dissatisfied shareholders, allows the view of shareholders to be taken into consideration in designing more aligned CEO compensation in following years. This is consistent with previous findings (Balsam et al., 2016; Cai and Walking, 2011; Kimbro and Xu, 2016), confirming the shareholder-alignment hypothesis. In addition, the results show the significant impact of low levels of SOP support from all the previous years analyzed. In addition, as expected, in companies with satisfied shareholders a low level of SOP support has no significant influence on the alignment of CEO compensation.
A negative version of the SOP occurs in companies with overcompensated CEOs who receive a high level of SOP support. In these cases, by voting overwhelmingly in favor, shareholders legitimize suboptimal payments, which remain at these undesirable levels over time. Firms in this scenario seems to take largely symbolic, rather than substantive, action on compensation arrangements in response to shareholder activism (Westphal and Zajac, 1994, 1995, 1998). We thus confirm the window-dressing hypothesis (Brunarski et al., 2015) about the legitimizing effect of SOP, which negatively affects the alignment of CEO compensation (David et al., 2007; Mangen and Magnan, 2012). Our results add that this negative effect is not observed in companies whose CEOs are not overcompensated, where a high level of SOP support has a positive influence on the alignment of CEO compensation.
Furthermore, we find a moderating effect of corporate governance mechanisms–board and ownership structure–in the relationship between SOP results and CEO compensation alignment. Our results indicate that the positive effect of a low level of SOP support on CEO compensation alignment is reinforced in companies with more independent boards and no duality (Alissa, 2015; Ertimur et al., 2013). In addition, combining ownership structure with board monitoring, in OC companies we find a positive moderating effect of the effectiveness of board monitoring on the influence of a low level of SOP support on CEO compensation alignment (Conyon and Sadler, 2010). In OM companies, as expected, this moderating effect is not significant, as large shareholders usually take the side of the firm's management (Sanchez-Marin et al., 2011; Young et al., 2008) and this limits the effectiveness of board monitoring when they vote for their own (suboptimal) compensations in SOP. These firms respond to a low level of SOP support by increasing entrenchment and rent extraction, particularly driven through excessive levels of compensation.
In line with the findings of Mangen and Magnan (2012), our results confirm a negative effect of SOP when it is combined with entrenchment problems, usually associated with OM firms. Entrenchment can lead to collusion of large owner-managers with others shareholders – usually minority shareholders – and stakeholders, supporting suboptimal CEO pay arrangements. In the context of high concentration of ownership, this misaligned compensation can encourage conflicts among principals and increase agency costs (Baixauli-Soler and Sanchez-Marin, 2011; Young et al., 2008). The board of directors may try to minimize shareholders’ negative reactions and potential SOP voting dissent both by managing symbolic pay arrangements (Westphal and Zajac, 1998), and by limiting disclosure of compensation plans (Mangen and Magnan, 2012), with the subsequent potential negative long-term impact on the proper alignment of executive compensation in the firm.
In summary, this research contributes academically by finding, in agreement with most of the relevant literature, an effective impact of SOP on cases of suboptimal executive pay, where SOP contributes to the alignment of CEO compensation through both the reduction of pay levels and the increase of compensation linked to company performance (Alissa, 2015; Cai and Walking, 2011; Conyon and Sadler, 2010; Ferri and Maber, 2013; Gregory-Smith et al., 2014; Kimbro and Xu, 2016). Second, the effectiveness of SOP is significantly determined by the firm's governance mechanisms, both the board monitoring and the ownership structure. In companies with low levels of board independence, and where the board is controlled by managers, high levels of SOP support act as a legitimation mechanism that perpetuates rent extraction and agency costs in terms of misaligned CEO compensation (Levit and Malenko, 2011; Morgan et al., 2006). This finding highlights the importance of shareholders’ information before voting, in order to reasonably assess the degree of alignment of CEO compensation. The voting of well-informed shareholders could convert SOP results into a “wake-up call” for firms and managers (Brunarski et al., 2015).
Regarding practical implications, the findings of this research suggest that companies should design properly aligned executive compensation in order to avoid having to restructure payments after receiving a low level of SOP support. Unfavorable SOP outcomes might have undesirable consequences for the company, including negative publicity, the exit of competent executives, and costs of changes in compensation packages (Cai and Walking, 2011; Correa and Lel, 2016). Special attention should be paid to compensation policies in OM companies and in companies with overcompensated managers. Strengthening SOP support in this context should help to balance the power of owners-managers to promote tunneling activities by means of misaligned compensation with the desirable protection of minority shareholders (Baixauli-Soler and Sanchez-Marin, 2015; La Porta et al., 1999). Such companies should seek alternative mechanisms of governance, with the ultimate objective of reducing agency costs and protecting themselves with greater independence, transparency and reputation.
Finally, this research has some limitations that, in turn, offer interesting opportunities for future research. First, the time period is short, because the information on SOP is available for Spanish listed companies only since 2013. Future studies should extend examination of these SOP effects by increasing the time horizon and checking whether changes adopted by companies, especially following negative SOP voting results, attract the approbation of shareholders in subsequent votes. Second, this study only analyzes the indirect effects of the board of directors and ownership structure in the relationship between the SOP and CEO compensation. Future research should consider other internal and external mechanisms of governance that might interact with SOP and influence executive compensation, with particular emphasis on diverse types of shareholders and how they act and vote in SOP. Similarly, future studies should consider, from a stakeholder perspective, how the involvement of different groups of stakeholders in specific voting proposals could affect shareholder voting behavior. Lastly, this research focuses on the Spanish context, representing as it does the continental European model of corporate governance. But the population of listed companies in Spain is relatively small. Future research should extend the scope of this research by comparing the effectiveness of SOP on countries with different systems of corporate governance, as between Anglo-Saxon and continental European systems, or between jurisdictions where SOP is either advisory or binding.
Financial support from the Research Program of Ministry of Economy and Competitiveness of Spain (Project ECO2014-54301-P) and Fundación Cajamurcia is acknowledged.
OC companies are owned by large shareholders that are not linked to the firm's management (Young et al., 2008) and are characterized by strong board monitoring of CEOs that emphasizes the alignment of CEO compensation (Sanchez-Marin et al., 2011; Tosi and Gomez-Mejia, 1994). In OM companies, ownership is concentrated mainly in large shareholders who take part in the firm's management (Young et al., 2008), where board monitoring is limited, resulting in less aligned CEO compensation (Lambert et al., 1993; Sanchez-Marin et al., 2011).