


We examine RPTs in one Continental European country, Spain, where ownership concentration is prevalent and state ownership is practically non-existent. Our results show that more than half of listed Spanish firms commit to RPTs over the analyzed period. Furthermore, from the perspective of the related party to the transaction, connected transactions between listed Spanish firms and their blockholders account for 99.84% of the total RPTs carried out by listed Spanish firms. Finally, our findings reveal that financial, operating and investment dimensions of RPTs negatively affect firm value due to the presence of an expropriation effect whereby RPTs are driven by insiders’ opportunism, regardless of the dimension (financial, operating and investment) affected by the existence of RPTs. Thus, in a context where the main concern of corporate governance is the potential expropriation of minority shareholders by controlling owners, RPTs require special regulator's attention in order to improve investor protection and market confidence to promote a more efficient allocation of resources.
Among the accounting scandals of firms such as Enron, WorldCom, Adelphia and Tyco in the US that shook the financial markets, related-party transactions (RPTs) proved to be a major problem. These transactions were supposedly conducted at arm's length, but in practice, they benefit the principals involved (e.g., managers, large shareholders or their relatives). These scandals, jointly with European frauds such as Vivendi and Parmalat, have led to increased interest in the study of RPTs and their effect on capital markets. Nevertheless, little rigorous academic research has investigated the market effects of RPTs (Gordon et al., 2004). Furthermore, despite the findings of previous literature, it is still difficult for investors to separate legitimate RPTs from inappropriate ones (Duprey, 2006).
In this paper, we shed light on the RPTs in one Continental European country, Spain. In particular, we examine the configuration of RPTs as well as the incidence of these connected transactions on firm value in a sample of listed Spanish firms over the period 2004–2012. The Spanish context provides an interesting setting to explore this question for several reasons. First, Law 26/2003 was passed to increase the transparency of listed firms’ disclosures. In later modifications included in Ministerial Order ECO/3722/2003 and Circular 1/2004 of the Spanish Security Exchange Commission (Comisión Nacional del Mercado de Valores), Law 26/2003 expanded the disclosure requirements of listed Spanish firms, making it mandatory for Spanish companies to disclose related-party transactions in their annual corporate governance reports. Moreover, Spanish firms operate in an environment where the legal system provides weak protection of minority shareholders’ rights (e.g., Djankov et al., 2008; La Porta et al., 1998). Thus, according to the Global Competitiveness index 2015–2016, Spain ranks 94th among 140 economies1 in protection of minority shareholders’ interests. Thus, according to previous report, Spain obtains notably worse scores in terms of corruption (Spain ranks 80th out of 140) and government efficiency (Spain ranks 94th out of 140). Ownership structures of Spanish listed firms are characterized by the widespread presence of dominant shareholders with the ability and incentives to monitor the managers (Bebchuk, 1999; Burkart et al., 2003; Grossman and Hart, 1988; La Porta et al., 2000, 1999, 1998). In this context, the agency conflict between shareholders and managers is lower while the main concern of corporate governance is to safeguard against the self-serving behavior of the dominant shareholder and thereby prevent the expropriation of minority shareholders (Burkart et al., 2003; La Porta et al., 2000; Villalonga and Amit, 2006). Thus, the Spanish context provides an interesting setting to explore the configuration and consequences in the capital markets of dominant shareholders’ commitment to RPTs.
The limited empirical evidence on RPTs usually suggests two alternative explanations for the existence of RPTs. First, according to the transaction costs theory (Coase, 1937; Pennings and Williamson, 1979), RPTs might be efficient because they contribute to reducing such costs and overcome the difficulties in enforcing property rights and contracts that are essential for the company (Chang and Hong, 2000; Jian and Wong, 2010; Khanna and Palepu, 2000; Stein, 1997). From this perspective, RPTs benefit shareholders and may have a positive effect on firm value. The alternative view is based on agency theory (Berle and Means, 1932; Jensen and Meckling, 1976) and considers RPTs as an opportunistic device (Aharony et al., 2010; Cheung et al., 2006; Gordon et al., 2004; Jiang et al., 2010; Morck et al., 2005). Thus, RPTs could be used by insiders as a mechanism to tunnel resources outside the firm. Hence, in line with this perspective RPTs might negatively affect firm value.
However, these studies are primarily based on the analysis of simple transactions (Berkman et al., 2009; Cheung et al., 2009; Friedman et al., 2003; Ge et al., 2010; Jiang et al., 2010) and are mainly focused on East Asia and particularly on the Chinese context (Berkman et al., 2009; Chen et al., 2009; Cheung et al., 2009, 2006; Gao and Kling, 2008; Ge et al., 2010; Jian and Wong, 2010; Jiang et al., 2010; Lou et al., 2014; Peng et al., 2011; Ying and Wang, 2013), where state ownership is prevalent and firms operate in a state-controlled economy. In this setting, insiders’ and auditors’ litigation risk is low and companies face lower public and media scrutiny. Moreover, previous empirical evidence usually includes far-off samples (Berkman et al., 2009; Bertrand et al., 2002; Ge et al., 2010; Jian and Wong, 2010; Jiang et al., 2010; Kohlbeck and Mayhew, 2010; Lei and Song, 2011; Nekhili and Cherif, 2011; Peng et al., 2011). According to previous considerations, the results from these studies are hard to generalize to Continental European firms and are difficult to extrapolate to the current period due to recent regulatory changes that have taken place in the context of RPTs.
Regarding the configuration of RPTs in the Spanish stock market, our results show that more than half of listed Spanish firms commit to RPTs over the analyzed period. Furthermore, from the perspective of the related party to the transaction, connected transactions between listed Spanish firms and their blockholders account for 99.84% of the total RPTs carried out by listed Spanish firms. Finally, our findings reveal that financial, operating and investment dimensions of RPTs negatively affect firm value due to the presence of an expropriation effect whereby RPTs are driven by insiders’ opportunism, regardless of the dimension (financial, operating and investment) affected by the existence of RPTs.
We contribute to the literature on the effect that RPTs have on firm value in three ways. First, we provide novel evidence on the configuration and consequences of RPTs in the capital markets for a context in which protection of minority shareholders’ rights is weak, ownership concentration is prevalent and state ownership is practically non-existent. Thus, by focusing on the Spanish context our results can be more easily extrapolated to other Continental European countries. Second, our study adds to the tunnelling literature and especially to the few papers that examine direct avenues through which expropriation may occur in the Spanish context (de Miguel et al., 2005). Third, compared to prior studies in the area that focus on analysing special types of RPTs, our work is based on an analysis of the total RPTs reported by listed Spanish firms in their annual corporate governance reports. It also examines a longer and more recent period, which allows for a more robust interpretation of the results.
The remainder of the paper is structured as follows. In “Theoretical background and hypothesis development” section, we show the theoretical background and our hypothesis on the relation between RPTs and firm value. In “Empirical analysis” section, we address the empirical analysis. In “Sensitivity analysis” section, we present the sensitivity analysis and finally, in “Conclusion” section, we provide a summary and conclude.
Theoretical background and hypothesis developmentLiterature reviewTwo different perspectives might help to explain why firms commit to RPTs. The first one considers RPTs as an efficient contracting mechanism in incomplete information settings (Ryngaert and Thomas, 2012). According to this view, RPTs play a significant role in a market economy, contributing to meeting firms’ basic needs, reducing transaction costs and facilitating the fulfilment of property rights and essential contracts for the firm (Coase, 1937; Fan and Goyal, 2006; Fisman and Khanna, 2004; Khanna and Palepu, 1997; Khanna and Yafeh, 2005; Kim, 2004; Shin, 1999). Thus, in the presence of poorly developed external markets where transaction costs are high, RPTs might contribute to improving efficiency, promoting long-term business relations and reducing uncertain economic environments and, consequently, firms’ risks (Cook, 1977; Khanna and Yafeh, 2005). According to this view, Friedman et al. (2003) provide evidence of propping during the Asian financial crisis. For their part, Cheung et al. (2006) examine RPTs between listed Hong Kong companies and their controlling shareholders and find some limited examples of propping. Moreover, by using a sample of Chinese listed firms, Wong et al. (2015) find that related-party sales increase firm value. However, this value enhancement disappears with large percentage of parent directors, high government ownership or tax avoidance incentives that often couple with management's rent extraction activities.
The opposite perspective considers RPTs as a vehicle to transfer resources from the company to its related parties (Johnson et al., 2000). In this sense, owner–managers in business groups have strong incentives to siphon resources out of member firms for their private benefit, and as such, they use both investment and financing decisions as a means to achieve this goal (Bae et al., 2002; Baek et al., 2006; Bertrand et al., 2002). According to this view, some previous studies show that particular RPTs such as related lending, related party sales or related asset exchanges facilitate tunnelling (e.g., La Porta et al., 2003; Gordon et al., 2004; Berkman et al., 2009; Jiang et al., 2010; Cheung et al., 2009; Ge et al., 2010). Other studies take a more comprehensive approach by focusing on a larger set of RPTs and evidence that RPTs destroy firm value (e.g., Lei and Song, 2011; Kohlbeck and Mayhew, 2010). However, Cheung et al. (2006) fail to find that firms in which controlling shareholders do expropriate through RPTs trade at discounted valuations relative to other firms. Additionally, other authors show that the use of RPTs to tunnel resources outside the firm is more severe when block shareholders’ voting rights are significantly larger than their cash flow rights (e.g., Bertrand et al., 2002).
Finally, some studies show that all transactions might be used for tunnelling or propping depending on the firm's specific circumstances such as financial healthy/distress or the need to avoid reporting a loss or to raise additional capital (e.g., Cheung et al., 2009; Peng et al., 2011; Lou et al., 2014).
In this sense, previous empirical evidence reveals no conclusive results regarding the effect of RPTs in the capital markets. Some studies find limited evidence from the use of RPTs to allow propping (Cheung et al., 2006; Friedman et al., 2003; Jian and Wong, 2010; Lou et al., 2014), while others conclude that RPTs are a tool used to tunnel resources outside the firm (Berkman et al., 2009; Cheung et al., 2009; Ge et al., 2010; Gordon et al., 2004; Jiang et al., 2010; Lei and Song, 2011). Additionally, some studies find that RPTs might be used by insider agents for either tunnelling or propping depending on certain firms’ circumstances (Cheung et al., 2009; Friedman et al., 2003; Lou et al., 2014; Peng et al., 2011).
Furthermore, while some studies find that the effect of RPTs on firm performance is dependent upon the related party to the transaction (Berkman et al., 2009; Jian and Wong, 2010; Kohlbeck and Mayhew, 2010), most studies focus on transactions between the firm and their blockholders (Cheung et al., 2009, 2006; Jiang et al., 2010; Lei and Song, 2011; Peng et al., 2011). Additionally, previous empirical evidence focuses mainly on the Chinese context and therefore on a setting where state ownership is prevalent and firms operate in a state-controlled economy, or on Hong Kong, where shareholder's protection is relatively good and the corporate governance environment has been influenced by developments in the United Kingdom, particularly the Cadbury committee report on corporate governance (Cheung et al., 2006). Furthermore, other previous studies adopt an international perspective, which makes it difficult to disentangle firm level from country level effects. Finally, because previous studies usually include distant samples, the results are difficult to extrapolate to the current period, where recent regulatory changes have taken place regarding RPTs. In view of the preceding considerations, results from previous studies are difficult to extrapolate to Continental Europe.
RPTs in Continental Europe and SpainTherefore, in Continental Europe firms operate in an environment with weak investor protection, limited development of capital markets and a large presence of shareholders with the ability and incentives to influence corporate decisions. Thus, contrary to the market-based system of the US, in the control-based system of Continental Europe, control is assumed to be exercised by blockholders because the board of directors is controlled by directors linked to core shareholders (Cuervo, 2002). Therefore, ownership of the typical firm in Continental Europe is generally concentrated in the hands of family and banks who are often actively involved in managing the firm (Cuervo, 2002; Faccio and Lang, 2002; La Porta et al., 1999). To the extent that dominant owners have a large part of their wealth directly tied to the firm, they will have strong incentives to monitor the firm closely. Ownership concentration is therefore expected to reduce the agency conflict between shareholders and managers. However, it is also expected to increase the divergence of interests between insiders (managers and dominant shareholders) and minority shareholders because the latter are at risk of expropriation by the former (Johnson et al., 2000; Villalonga and Amit, 2006). Therefore, the Spanish institutional environment is characterized by high levels of ownership concentration, low effectiveness of boards due to a single-tier structure, relatively illiquidity of the capital market, which impedes minority shareholders from selling out when they perceive abuses by controlling owners, and the weakness of the market for corporate control (de Miguel et al., 2005).
Furthermore, the use of pyramids, which result in the separation of the controlling owner's voting and cash flow rights is common in Continental Europe (e.g., Claessens et al., 2000; Faccio and Lang, 2002; La Porta et al., 1999). Pyramids allow controlling owners to maintain tight control of a firm while committing low equity investment, creating a separation of ownership (cash flow) and control (voting rights). This ownership structure and the controlling shareholders’ ability to recruit and nominate directors who will serve their interests might increase the potential for abuse through RPTs in the Spanish context. de Miguel et al. (2005) point out that the theoretical relation between large owners and firm value is ambiguous and they provide evidence of minority shareholders’ rent expropriation for high levels of ownership concentration in the Spanish context. Nevertheless, no previous studies have analyzed blockholders’ commitment to RPTs and the potential effect of these related transactions on firm value in the Spanish context.
Although according to the incentive alignment hypothesis (Jensen and Meckling, 1976) large shareholders have greater power and stronger incentives to ensure shareholder value maximization, the potential private benefits derived from controlling shareholders through expropriation of minority shareholders’ wealth by using RPTs could be greater than the costs stemming from tunnelling through these transactions. When this happens a self-dealing scenario is likely to arise. On the contrary, tunnelling activities are subject to public scrutiny and when detected might convey regulatory actions and a reputation loss for the company (Klapper and Love, 2004; Gomes, 2000). In the Spanish context, controlling shareholders, mainly families and banks (Cuervo, 2002; Faccio and Lang, 2002; La Porta et al., 1999), due to their large stakes and long investment horizons (Cuervo, 2002), will view a company's health as an extension of their own well-being. This long-term horizon increases concerns about firms’ reputation. Reputation may be of particular value when capital markets are less developed and trust-based relationships are key to concluding contracts (Khanna and Palepu, 2000). According to this latter perspective and following the arguments of Anderson and Reeb (2003), compared with other shareholders, controlling shareholders are more likely to use RPTs efficiently in order to maximize firm value.
Therefore, RPTs in the Spanish setting can be used by controlling shareholders to both generate and destroy value. The direction of the relationship between RPTs and firm value is therefore an empirical question. We therefore state our hypothesis as follows:H1 RPTs affect firm value.
The financial data are taken from Osiris database by Bureau van Dijk Electronic Publishing (BvDEP). We hand collect data about RPTs because this information is not publicly available. The sample comprises a non-balanced panel of 99 non-financial Spanish firms listed on the electronic market at the end of 2012. In our regression analysis, we apply the method developed by Hadi (1992) to eliminate outliers, which represent 14.8% of the total sample. As a result, we obtain an unbalanced panel of 94 companies (671 firm-year observations) for the period 2004–2012. Because disclosures of related party transactions are incomplete and irregular in 2003, we exclude this year from our analysis. To alleviate the sample selection bias and to test whether there is some validity for the aforementioned transaction costs theory, all the firms have been included in the sample regardless of whether they have committed to RPTs.
Variables definitionsRelated-party transactionsSome previous studies have focused on specific RPTs such as acquisitions or sales of assets, lending or borrowing contracts, loan guarantees (Berkman et al., 2009; Cheung et al., 2009; Friedman et al., 2003; Ge et al., 2010; Jiang et al., 2010). Other studies provide a broader scope by considering a comprehensive set of RPT variables (Cheung et al., 2009, 2006; Kohlbeck and Mayhew, 2010; Peng et al., 2011). Within this latter category, the authors usually use, together or separately, two classification criteria to group RPTs: (1) the related party of the transaction and (2) the nature of the transaction (Kohlbeck and Mayhew, 2010).
Following the first criterion, some authors (Kohlbeck and Mayhew, 2010) group these transactions in: (a) transactions with directors, officers, shareholders or their affiliates and (b) investment (joint venture or other operations in which the company has a less than 100% that is not consolidated). Nekhili and Cherif (2011) group these operations in: (a) transactions between the main shareholders, directors or managers, and the companies with which they are affiliated (b) transactions with subsidiaries and associated firms.
According to the second criterion, Kohlbeck and Mayhew (2010) classify RPTs as simple and complex operations. Simple transactions are straightforward transactions that involve relatively few financial statement accounts and related parties (loans, guarantees, borrowings, consulting, legal services and leases). Complex transactions typically involve a number of financial statement accounts and related parties (related business, unrelated business, overhead, and stock transactions). In other studies, RPTs are initially sorted into two groups (Cheung et al., 2009): (1) ex ante potentially tunnelling transactions, (2) ex ante potentially propping transactions. A third type of transaction is considered by Cheung et al. (2006) transactions that could have a strategic rationale.
In our study, information about RPTs is collected from annual corporate governance reports (CGR) published by the Spanish Security Exchange Commission over the period 2004–2012. The CGR includes RPTs with (1) significant shareholders, (2) directors and officers, and (3) affiliates (not included in the consolidation process). Because the second and third types of RPTs are practically non-existent, we focused on RPTs with blockholders, which represent 99.84% of total RPTs in Spain. Thus, we initially obtain 17 RPT variables. Following previous studies (Peng et al., 2011; Ryngaert and Thomas, 2012), we apply a screening process in order to ensure the robustness of our results. We thus exclude those RPT variables that present an insignificant amount or erratic behaviour. This screening process results in a final set of eight RPT variables: operating income, operating expenses, financial income, financial expenses, borrowing contracts, lending contracts, loan guarantees and non-financial assets acquisitions. Regarding these variables, we do not we have a priori expectation on the effect of the analyzed connected transactions on firm value because, according to previous literature, tunnelling opportunities are diverse and the same transaction can often be used for tunnelling and/or propping depending on certain firm's circumstances (Peng et al., 2011). Moreover, because the use of the same transaction for tunnelling or propping is dependent upon the transfer prices not always disclosed by the firm, in the Spanish context and in contrast to previous literature, we do not classify RPTs as potentially tunnelling/propping transactions.
Independent variableWe capture firm value using three different variables. First, we use Tobin's Q, which is calculated as the firm's market capitalization plus debt, divided by the book value of assets (Cho, 1998; Claessens et al., 2002; Demsetz and Villalonga, 2001; Ferreira and Matos, 2008; McConnell and Servaes, 1990; Morck et al., 1988; Ruiz-Mallorqui and Santana-Martin, 2011; Seifert et al., 2005). Second, we use the firm's equal-weighted market-adjusted cumulative monthly stock return for the 12-month period ending three months following the end of the fiscal year (CAR) (Cheung et al., 2006; Jiang et al., 2010; Kohlbeck and Mayhew, 2010; Lei and Song, 2011). Finally, due to the relatively illiquidity of the Spanish capital market, we use the market value of shares scaled by total assets (de Miguel et al., 2004).
Control variablesWe include in our analysis a set of control variables commonly used in previous studies as potential determinants of firm value (Ruiz-Mallorqui and Santana-Martin, 2011; Mínguez-Vera and Martín-Ugedo, 2007; Navissi and Naiker, 2006; Villalonga and Amit, 2006; Seifert et al., 2005; Eisenberg et al., 1998; Yermack, 1996; McConnell and Servaes, 1990). Thus, since controlling owners often use pyramidal structures to maintain tight control of a firm while committing low equity investment creating, in this way, a separation of ownership (cash flow) and control (voting rights), we have controlled, in our empirical analysis, for the effect of ownership structure on the investigated relationship by including the controlling owner's voting-cash flow wedge (DIVERG). To further control for the potential effect of ownership structure we include FAM, a dummy variable that takes the value of 1 if the controlling shareholder of the firm is a family and 0 otherwise; and INST, a dummy variable that takes the value of 1 if the controlling shareholder of the firm is a financial institution and 0 otherwise. We use the control chain methodology to identify the dominant owner for each firm and determine if the corresponding owner exercises effective control through a pyramidal structure (Bona-Sánchez et al., 2013, 2014; Faccio and Lang, 2002; Claessens et al., 2000; La Porta et al., 1999). Moreover, since previous literature has considered the size of the board as an important factor affecting the board's ability to function effectively we include BOARD, the natural logarithm of the total members on the board. To build this variable, we collected data from annual corporate governance reports published by the Spanish Security Exchange Commission (Bona-Sánchez et al., 2014, 2013). We also include the size of the firm (SIZE), which is measured as the logarithm of firm's assets, and firm's leverage (LEV), measured as the relationship between firms’ total debt and assets. Finally, dummy variables are included to take into account industry and year effects.
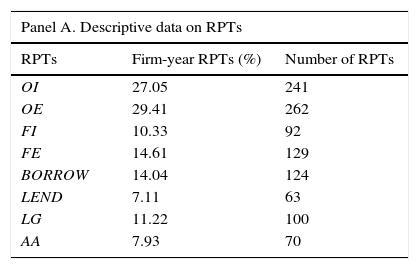
Descriptive analysisTable 1 (Panel A) shows the percentage of firm-year RPTs observations along the period and the number of RPTs, classified by nature. Since individual companies sometimes engage in the same type of RPT in the same year, we have summarized the value of RPTs occurring for the same company in the same year in order to obtain firm-year observations. Thus, Table 1 (Panel A) shows that the most frequent RPTs are Operating Income (OI) and Operating Expenses (OE), followed by Financial Income (FI), Financial Expenses (FE), Borrowing Contracts (BORROW) and Loan Guarantees (LG). Thus, Lending Contracts (LEND) and Non-financial Acquisitions (AA) are less common. However, considering the average amount of RPTs in Table 1 (Panel B), we observe that the most relevant average RPTs, are Lending Contracts (LEND) (50,893.880 thousand euros), Operating Expenses (OE) (44,262.530 thousand euros), Operating Income (OI) (31,847.960 thousand euros), Loan Guarantees (LG) (17,214.970 thousand euros) and Borrowing Contracts (BORROW) (15,287.270 thousand euros) and the rest average RPTs values do not exceed 5000 thousand euros.
Descriptive statistics and correlation matrix.
| Panel A. Descriptive data on RPTs | ||
|---|---|---|
| RPTs | Firm-year RPTs (%) | Number of RPTs |
| OI | 27.05 | 241 |
| OE | 29.41 | 262 |
| FI | 10.33 | 92 |
| FE | 14.61 | 129 |
| BORROW | 14.04 | 124 |
| LEND | 7.11 | 63 |
| LG | 11.22 | 100 |
| AA | 7.93 | 70 |
| Panel B. Descriptive statistics | |||||
|---|---|---|---|---|---|
| Variable | Average | Standard deviation | Median | Minimum | Maximum |
| OI | 31,847.96 | 144,290.90 | 0 | 0 | 1,600,000.00 |
| OE | 44,262.53 | 273,306.60 | 0 | 0 | 4,000,000.00 |
| FI | 1926.46 | 17,172.71 | 0 | 0 | 334,236.00 |
| FE | 1722.92 | 9057.75 | 0 | 0 | 128,978.00 |
| BORROW | 15,287.27 | 131,228.90 | 0 | 0 | 2,200,000.00 |
| LEND | 50,893.88 | 243,242.10 | 0 | 0 | 3,200,000.00 |
| LG | 17,214.97 | 108,613.80 | 0 | 0 | 1,500,000.00 |
| AA | 4178.97 | 52,528.35 | 0 | 0 | 1,300,000.00 |
| QTOBIN | 1.558 | 1.222 | 1.232 | 0.455 | 12.481 |
| MKVALUE | 0.893 | 1.260 | 0.54 | 0.0085 | 11.73 |
| CAR | −0.07 | 0.450 | −0.01 | −3.3 | 2.92 |
| DIVERG | 3.970 | 6.820 | 0 | 0 | 36.29 |
| BOARD | 2.340 | 0.304 | 2.302 | 1.386 | 3.04 |
| SIZE | 13.864 | 1.832 | 13.624 | 9.791 | 18.68 |
| LEV | 0.642 | 0.183 | 0.652 | 0.068 | 0.986 |
| Panel C. Firms controlled by a family and firms controlled by a financial institution | |
|---|---|
| Firms controlled by a family | 61.70% |
| Firms controlled by a financial institution | 15.80% |
| Panel D. Correlation matrix | ||||||||||||||||
|---|---|---|---|---|---|---|---|---|---|---|---|---|---|---|---|---|
| OI | OE | FI | FE | BORROW | LEND | LG | AA | QTOBIN | MKVALUE | CAR | DIVERG | FAM | INST | BOARD | SIZE | |
| OE | 0.52 | |||||||||||||||
| FI | 0.12 | 0.15 | ||||||||||||||
| FE | 0.21 | 0.29 | 0.48 | |||||||||||||
| BORROW | 0.28 | 0.14 | 0.33 | 0.33 | ||||||||||||
| LEND | 0.25 | 0.31 | 0.26 | 0.46 | 0.31 | |||||||||||
| LG | 0.19 | 0.32 | 0.24 | 0.29 | 0.22 | 0.35 | ||||||||||
| AA | 0.04 | 0.11 | 0.10 | 0.06 | −0.01 | 0.17 | 0.02 | |||||||||
| QTOBIN | −0.04 | −0.05 | −0.03 | −0.06 | −0.03 | −0.04 | −0.02 | −0.01 | 1.00 | |||||||
| MKVALUE | −0.02 | −0.02 | −0.03 | −0.06 | −0.02 | −0.03 | −0.00 | −0.02 | 0.93 | |||||||
| CAR | −0.02 | −0.04 | −0.03 | −0.01 | −0.03 | −0.05 | −0.06 | −0.02 | 0.45 | 0.46 | ||||||
| DIVERG | 0.10 | 0.07 | 0.07 | 0.00 | −0.02 | 0.00 | 0.00 | 0.03 | 0.08 | 0.05 | −0.06 | |||||
| FAM | −0.24 | −0.23 | −0.05 | −0.23 | −0.25 | −0.14 | −0.14 | −0.06 | 0.00 | −0.02 | −0.12 | 0.19 | ||||
| INST | 0.25 | 0.27 | 0.05 | 0.28 | 0.29 | 0.14 | 0.19 | 0.08 | −0.02 | 0.00 | 0.04 | −0.10 | −0.70 | |||
| BOARD | 0.18 | 0.21 | 0.14 | 0.20 | 0.27 | 0.14 | 0.19 | 0.11 | −0.03 | −0.11 | 0.06 | 0.16 | −0.09 | 0.21 | ||
| SIZE | 0.31 | 0.30 | 0.24 | 0.32 | 0.25 | 0.37 | 0.28 | 0.14 | −0.11 | −0.26 | 0.06 | 0.15 | −0.11 | 0.07 | 0.63 | |
| LEV | 0.04 | −0.01 | 0.01 | 0.04 | 0.08 | 0.05 | 0.08 | 0.03 | 0.01 | −0.27 | 0.09 | 0.03 | 0.02 | −0.05 | 0.22 | 0.42 |
OI: operating income; OE: operating expenses; FI: financial income; FE: financial expenses; BORROW: borrowing contracts; LEND: lending contracts; LG: loan guarantees; AA: non-financial assets acquisitions; QTOBIN: value of the firm, measured as the relationship between capitalisation and debt value and the total assets of the firm i in year t; MKVALUEit is the market value of shares scaled by total assets; CARit is the firm's equal-weighted market-adjusted cumulative monthly stock return for the 12-month period ending three months following the end of the fiscal year; FAMit is a dummy variable that takes the value of 1 if the controlling shareholder of the firm is a family and 0 otherwise; INSTit is a dummy variable that takes the value of 1 if the controlling shareholder of the firm is a financial institution and 0 otherwise; BOARDit is the natural logarithm of the total members on the board; SIZEit is the natural logarithm of the total assets; LEVit is total debt in year t divided by total assets.
Table 1 (Panel B) shows that the average values for firm value are 1.558 (QTOBIN), 0.893 (MKVALUE) and −0.07 (CAR). Table 1 (Panel C) reveals the percentage of family controlled firms and the percentage of firms controlled by a financial institution. In Table 1 (Panel D) we observe that firm value is negatively correlated with all the RPT variables. The high correlation among the variables used to measure firm value is not a concern in our study because these variables are never included in the same model. However, we see very high levels of correlations among the RPT variables. For example, correlation between operating income and operating expenses is 0.52; correlation between financial income and financial expenses is 0.48; and correlation between lending contracts and financial expenses is 0.46. Moreover, in other five cases, the correlations are higher than 0.30. Thus, we conclude that there is a potential multicollinearity problem that misleadingly inflates the standard errors and so makes some variables statistically insignificant while they should be otherwise significant. To avoid this problem the principal components analysis (PCA) method is applied.
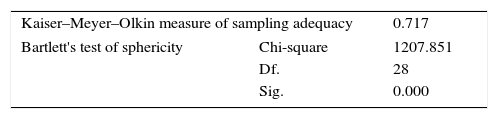
Principal components analysisThe main objective of the PCA is to determine the important dimensions that can explain the changes in RPTs. PCA explores underlying patterns of relationships between the RPTs, which generates new variables (factors) that are uncorrelated with one another and that avoid the multicollinearity problem in our regressions. To apply the PCA methodology initial variables measuring RPTs must be correlated with one another. Although we observed high correlation among the RPTs in Table 1, we further evaluate whether the data are appropriate for factor analysis by using the Kaiser–Meyer–Olkin (KMO) measure of sampling adequacy and Bartlett's test of sphericity. Thus, the KMO value should be higher than 0.50 and the chi-square value of Bartlett's test must be significant at the 0.05 level (Harper et al., 1980). As shown in Table 2, the KMO statistic is 0.717, a value higher than the recommended 0.50, and Bartlett's test is statistically significant at the p<0.01 level. These results show that the sample can be subjected to PCA in order to uncover the underlying patterns of the RPT variables.
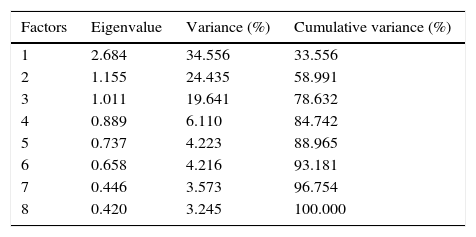
Table 3, presents the estimated factors and their eigenvalues. The criterion used for the number of factors to be extracted is an eigenvalue greater than 1. Thus, the first three factors are included in the model. The first factor is the most important dimension in explaining changes in RPTs. It explains 34.556% of the total variance of RPTs. The second and third factors explain 24.435% and 19.641% of the total variance, respectively. Considered together, the factors explain 78.632% of the total changes of RPTs for the Spanish public firms.
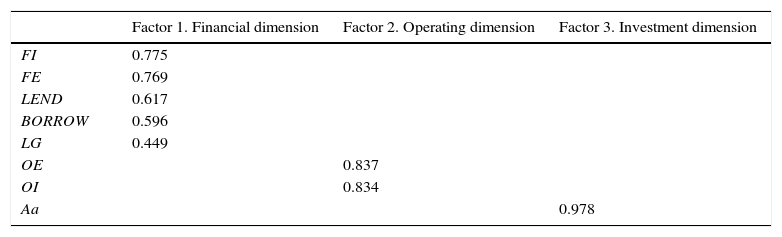
In Table 4, we show the three principal factors rotated using the Varimax normalization (Kaiser, 1960). The first factor consists of five RPT variables: financial income (FI), financial expenses (FE), borrowing contracts (BORROW), lending contracts (LEND), and loan guarantees (LG). Hence, the first factor represents the financial dimension of RPTs. The second factor consists of two RPT variables: operating income (OI) and operating expenses (OE). Thus, this factor represents the operating dimension of RPTs. Finally, the third factor includes non-financial asset acquisitions (AA) among related parties (investment dimension).
Rotated components matrix.
| Factor 1. Financial dimension | Factor 2. Operating dimension | Factor 3. Investment dimension | |
|---|---|---|---|
| FI | 0.775 | ||
| FE | 0.769 | ||
| LEND | 0.617 | ||
| BORROW | 0.596 | ||
| LG | 0.449 | ||
| OE | 0.837 | ||
| OI | 0.834 | ||
| Aa | 0.978 |
FI: financial income; FE: financial expenses; LEND: lending contracts; BORROW: borrowing contracts; LG: loan guarantees; OE: operating expenses; OI: operating income; AA: assets acquisitions.
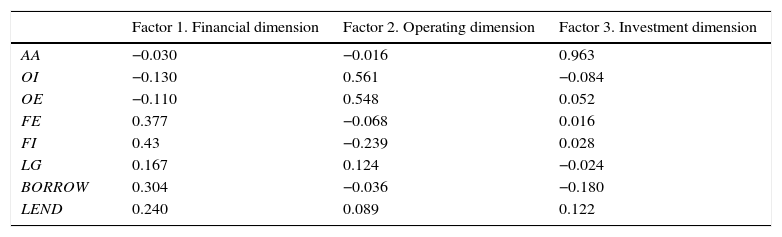
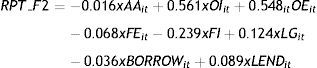
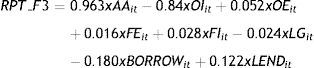
Table 5 presents the factor score coefficient matrix estimated by PCA. Thus, estimated factors can be expressed as a function of the observed original RPT variables. To estimate each factor score for each firm, the following equations must be used:
where RPT_F1 is the financial dimension of RPTs, RPT_F2 is the operating dimension of RPTs and RPT_F3 is the investment dimension of RPTs.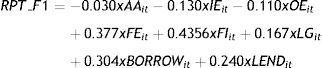
Factor score coefficients matrix.
| Factor 1. Financial dimension | Factor 2. Operating dimension | Factor 3. Investment dimension | |
|---|---|---|---|
| AA | −0.030 | −0.016 | 0.963 |
| OI | −0.130 | 0.561 | −0.084 |
| OE | −0.110 | 0.548 | 0.052 |
| FE | 0.377 | −0.068 | 0.016 |
| FI | 0.43 | −0.239 | 0.028 |
| LG | 0.167 | 0.124 | −0.024 |
| BORROW | 0.304 | −0.036 | −0.180 |
| LEND | 0.240 | 0.089 | 0.122 |
AA: non-financial asset acquisitions; OI: operating income; OE: operating expenses; FE: financial expenses; FI: financial income; LG: lending guarantee; BORROW: borrowing contracts; LEND: lending contracts.
We estimate all of the regressions using a panel data procedure, namely, generalized method of moments (GMM). The GMM procedure allows us to address potential endogeneity problems by using the right-hand-side variables in the model lagged two to six times as instruments; the only exceptions are the year and industry effects variables, which are considered exogenous. The original Arellano and Bond (1991) approach can perform poorly, however, if the autoregressive parameters are too large or the ratio of the variance of the panel-level effect to the variance of the idiosyncratic error is too large. Drawing on Arellano and Bover (1995), Blundell and Bonds (1998) develop a system GMM estimator that addresses these problems by expanding the instrument list to include instruments for the level equation. In this paper, we use the system GMM approach to estimate our models.2
The consistency of GMM estimates depends on both an absence of second-order serial autocorrelation in the residuals and on the validity of the instruments. To check for potential model misspecification, we use the Hansen statistic of over-identifying restrictions. We next examine the m2 statistic developed by Arellano and Bond (1991) to test for the absence of second-order serial correlation in the first-difference residual. Finally, we conduct three Wald tests, specifically, a Wald test of the joint significance of the reported coefficients (z1), a Wald test of the joint significance of the time dummies (z2) and a Wald test of the joint significance of the industry dummies (z3).
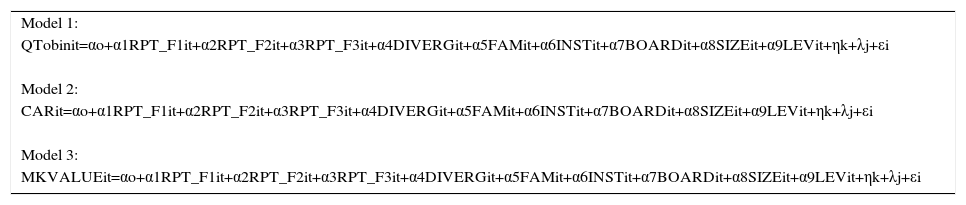
To test our hypothesis we estimate the following model:
where ηk and λj control for industry and year effects, respectively.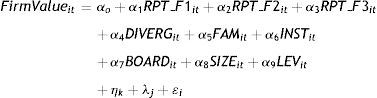
Models 1, 2 and 3 in Table 6 report results on the effect of RPTs on firm value. In particular, the models show a negative and statistically significant effect of the different dimensions of RPTs on firm value. These results are consistent with our hypothesis. Particularly, we provide evidence of a negative relationship between RPTs and firm value. The results are consistent with the use of RPTs as a mechanism to expropriate minority shareholders’ wealth.
Related-party transactions and firm value.
| Model 1: |
| QTobinit=αo+α1RPT_F1it+α2RPT_F2it+α3RPT_F3it+α4DIVERGit+α5FAMit+α6INSTit+α7BOARDit+α8SIZEit+α9LEVit+ηk+λj+εi |
| Model 2: |
| CARit=αo+α1RPT_F1it+α2RPT_F2it+α3RPT_F3it+α4DIVERGit+α5FAMit+α6INSTit+α7BOARDit+α8SIZEit+α9LEVit+ηk+λj+εi |
| Model 3: |
| MKVALUEit=αo+α1RPT_F1it+α2RPT_F2it+α3RPT_F3it+α4DIVERGit+α5FAMit+α6INSTit+α7BOARDit+α8SIZEit+α9LEVit+ηk+λj+εi |
| Model 1 | Model 2 | Model 3 | |
|---|---|---|---|
| RPT_F1it | −0.09*** | −0.029*** | −0.094*** |
| (−9.48) | (−5.69) | (−7.44) | |
| RPT_F2it | −0.09*** | −0.016*** | −0.124*** |
| (−11.72) | (−3.02) | (−9.63) | |
| RPT_F3it | −0.06*** | −0.027*** | −0.03*** |
| (−7.17) | (−2.89) | (−4.17) | |
| DIVERGit | −0.01*** | −0.01*** | −0.02*** |
| (−15.39) | (−7.47) | (−3.03) | |
| FAMit | 0.128*** | 0.25*** | 0.07*** |
| (5.54) | (4.09) | (2.00) | |
| INSTit | −0.06*** | −0.454*** | −0.106*** |
| (−4.06) | (−7.50) | (−5.46) | |
| BOARDit | −0.127*** | −0.612*** | −0.227*** |
| (−4.06) | (−8.44) | (−7.29) | |
| SIZEit | −0.237*** | −0.08*** | −0.31*** |
| (−14.59) | (−5.12) | (−12.21) | |
| LEVit | 0.17*** | 0.12*** | 0.220*** |
| (10.46) | (7.65) | (8.87) | |
| Constant | 3.89*** | −0.04 | 5.24 |
| (17.67) | (−0.17) | (15.53) | |
| Year effect | Yes | Yes | Yes |
| Industry effect | Yes | Yes | Yes |
| Hansen | 71.77 | 21.19 | 60.13 |
| (0.54) | (0.569) | (0.463) | |
| m2 test | −1.02 | −1.31 | −0.75 |
| (0.30) | (0.191) | (0.453) | |
| z1 test | 390.42*** | 543.06*** | 217.18*** |
| z2 test | 7.26*** | 31.68*** | 9.04*** |
| z3 test | 65.20*** | 91.43*** | 58.31*** |
QTOBIN: value of the firm, measured as the relationship between capitalization and debt value and the total assets of the firm i in year t; RPT_F1 is the financial dimension of RPTs. RPT_F2 is the operating dimension of RPTs. RPT_F3 is the investment dimension of RPTs. QTOBIN: value of the firm, measured as the relationship between capitalisation and debt value and the total assets of the firm i in year t; MKVALUEit is the market value of shares scaled by total assets; CARit is the firm's equal-weighted market-adjusted cumulative monthly stock return for the 12-month period ending three months following the end of the fiscal year; FAMit is a dummy variable that takes the value of 1 if the controlling shareholder of the firm is a family and 0 otherwise; INSTit is a dummy variable that takes the value of 1 if the controlling shareholder of the firm is a financial institution and 0 otherwise; BOARDit is the natural logarithm of the total members on the board; SIZEit is the natural logarithm of the total assets; LEVit is total debt in year t divided by total assets.
Hansen is the test of over-identifying restrictions, under the null hypothesis that all instruments are uncorrelated with the disturbance process. m2 is the statistic test for lack of second-order serial correlation in the first-difference residual. z1 is the Wald test of the joint significance of the reported coefficients. z2 is the Wald test of the joint significance of the time dummies. z3 is the Wald test of the joint significance of the industry dummies.
In parentheses, t-statistics based on robust standard errors.
Regarding the corporate governance variables, results in Table 6 reveal that the dominant shareholder's voting-cash flow wedge has a statistically significant negative effect on firm value. These results are consistent with divergence increasing the dominant shareholder's incentives to tunnel resources outside the firm (e.g., Bona-Sánchez et al., 2013; Claessens et al., 2002; Francis et al., 2005; Haw et al., 2004), since the voting-cash flow wedge allows for greater control of corporate wealth with less investment by the controlling owner (Morck et al., 2005). Moreover, the influence of family control on firm value is positive while the effect of effective control by a dominant institutional owner is negative. These results are consistent with previous studies (Ruiz-Mallorqui and Santana-Martin, 2011; Villalonga and Amit, 2006; Navissi and Naiker, 2006; Seifert et al., 2005; McConnell and Servaes, 1990). With respect to board size (BOARD), the effect on firm value is negative. This result is consistent with an increase in board size negatively affecting the board's ability to function effectively (Eisenberg et al., 1998; Yermack, 1996). Regarding the rest of the control variables, size displays a negative effect on firm value, while the effect of leverage is positive.
Sensitivity analysisTo check the robustness of our results we extend our analysis in two ways. First, by considering if our results might be affected by the implementation of International Financial Reporting Standards (IFRS). Thus, we re-run all our regressions considering only the period affected by IFRS, namely 2005–2012. As we can see in Table 7, the findings are not different from those obtained in Table 6. Second, we re-run all the regressions including the RPT variables one by one. Untabulated results show that the effect of RPTs on firm value is still negative (size and leverage are not significant in some regressions).3 Thus, we provide further evidence in support of our hypothesis.
Related-party transactions and firm value (2005–2012).
| Model 4: |
| QTobinit=αo+α1RPT_F1it+α2RPT_F2it+α3RPT_F3it+α4DIVERGit+α5FAMit+α6INSTit+α7BOARDit+α8SIZEit+α9LEVit+ηk+λj+αi |
| Model 5: |
| CARit=αo+α1RPT_F1it+α2RPT_F2it+α3RPT_F3it+α4DIVERGit+α5FAMit+α6INSTit+α7BOARDit+α8SIZEit+α9LEVit+ηk+λj+αi |
| Model 6: |
| MKVALUEit=αo+α1RPT_F1it+α2RPT_F2it+α3RPT_F3it+α4DIVERGit+α5FAMit+α6INSTit+α7BOARDit+α8SIZEit+α9LEVit+ηk+λj+αi |
| Model 4 | Model 5 | Model 6 | |
|---|---|---|---|
| RPT_F1it | −0.08*** | −0.028*** | −0.091*** |
| (−8.48) | (−5.35) | (−9.48) | |
| RPT_F2it | −0.08*** | −0.003*** | −0.097*** |
| (−11.34) | (−4.80) | (−11.72) | |
| RPT_F3it | −0.06*** | −0.041*** | −0.064*** |
| (−8.81) | (−5.50) | (−7.17) | |
| DIVERGit | −0.007*** | −0.01*** | −0.011*** |
| (−9.13) | (−6.69) | (−15.39) | |
| FAMit | 0.17*** | 0.29*** | 0.13*** |
| (6.70) | (5.74) | (5.54) | |
| INSTit | −0.14*** | −0.47*** | −0.060*** |
| (−6.02) | (−8.51) | (−4.06) | |
| BOARDit | −0.048** | −0.70*** | −0.13*** |
| (−2.17) | (−12.25) | (−4.06) | |
| SIZEit | −0.18*** | −0.06*** | −0.23*** |
| (−12.09) | (−4.44) | (−14.59) | |
| LEVit | 0.17*** | 0.09*** | 0.17*** |
| (9.21) | (7.41) | (10.46) | |
| Constant | 3.60*** | −0.39 | 3.86*** |
| (19.21) | (−1.57) | (17.67) | |
| Year effect | Yes | Yes | Yes |
| Industry effect | Yes | Yes | Yes |
| Hansen | 74.98 | 21.19 | 71.77 |
| (0.64) | (0.57) | (0.51) | |
| m2 test | −0.83 | −1.31 | −1.02 |
| (0.408) | (0.191) | (0.309) | |
| z1 test | 892.21*** | 555.62*** | 390.42*** |
| z2 test | 17.31*** | 27.34*** | 7.26*** |
| z3 test | 51.14*** | 92.58*** | 65.20*** |
QTOBIN: value of the firm, measured as the relationship between capitalization and debt value and the total assets of the firm i in year t; RPT_F1 is the financial dimension of RPTs. RPT_F2 is the operating dimension of RPTs. RPT_F3 is the investment dimension of RPTs. MKVALUEit is the market value of shares scaled by total assets; CARit is the firm's equal-weighted market-adjusted cumulative monthly stock return for the 12-month period ending three months following the end of the fiscal year; FAMit is a dummy variable that takes the value of 1 if the controlling shareholder of the firm is a family and 0 otherwise; INSTit is a dummy variable that takes the value of 1 if the controlling shareholder of the firm is a financial institution and 0 otherwise; BOARDit is the natural logarithm of the total members on the board; SIZEit is the natural logarithm of the total assets; LEVit is total debt in year t divided by total assets.
Hansen is the test of over-identifying restrictions, under the null hypothesis that all instruments are uncorrelated with the disturbance process. m2 is the statistic test for lack of second-order serial correlation in the first-difference residual. z1 is the Wald test of the joint significance of the reported coefficients. z2 is the Wald test of the joint significance of the time dummies. z3 is the Wald test of the joint significance of the industry dummies.
In parentheses, t-statistics based on robust standard errors.
The knowledge of RPTs in Continental Europe is limited to accounts of scandals that receive media coverage. Additionally, available empirical evidence on the effect of RPTs on firm value is scarce, inconclusive and focused primarily on East Asia. In the current study, we extend previous line of research by highlighting the prevalence of RPTs in a Continental European country, Spain, subsequently analysing the incidence of these connected transactions on firm value. Therefore, the study is carried out in a context where the main concern of corporate governance is the potential expropriation of minority shareholders by controlling owners (La Porta et al., 2000; Villalonga and Amit, 2006) and where state ownership is not prevalent. In particular, we present a comprehensive descriptive analysis of RPTs for a large representative sample of listed Spanish firms over the period 2004–2012. We then examine the impact of RPTs on firm value.
From the perspective of the related party to the transaction, our results show that connected transactions between listed Spanish firms and their blockholders account for 99.84% of the total RPTs carried out by listed Spanish firms. Thus, we highlight the importance of these connected transactions in comparison with those concluded with directors, officers and/or with an unconsolidated investment of the firm, which show far less relevance in the Spanish market. Additionally, focusing on connected transactions with blockholders, more than half of listed Spanish firms commit to RPTs over the analyzed period. Furthermore, our result provides evidence of a significant and negative relationship between financial, operating and investment dimensions of these connected transactions and firm value. Contrary to previous empirical evidence that supports opposing effects of RPTs on firm value depending on the nature of the RPTs (e.g., Cheung et al., 2006; Kohlbeck and Mayhew, 2010), our results show that in the Spanish setting, independently of the dimension affected by the RPTs (financial, operating or investment), these connected transactions destroy firm value because they promote minority shareholders’ expropriation through tunnelling. Therefore, although RPTs convey a cost for controlling shareholders in terms of a decrease in shareholder value, our results are consistent with private benefits derived from related party transactions being greater than those costs.
Our research offers three main contributions to the extant literature. First, our comprehensive descriptive analysis of connected transactions in the Spanish market shows novel evidence on the topic in Continental Europe, a setting on which previous studies on RPTs have not focused and where, contrary to previous works in the area (Ge et al., 2010; Jian and Wong, 2010; Lei and Song, 2011; Wong et al., 2015), state ownership is not prevalent and economic activity shows lower levels of state intervention. Second, and contrary to previous studies aimed at analysing particular types of RPTs (Berkman et al., 2009; Friedman et al., 2003; Ge et al., 2010; Jiang et al., 2010; Wong et al., 2015), our work is accomplished on the basis of analysing all RPTs revealed by listed Spanish firms in the Annual Corporate Governance Report over a nine-year period, which allows us to provide an exhaustive picture of RPTs in the Spanish setting. Third, we contribute to previous literature on tunnelling and its potential effects in the capital markets by providing direct evidence of minority shareholders’ expropriation through the use of RPTs. Thus, in contrast to previous studies that analyze the relationship between ownership structure and firm value in the Spanish context (de Miguel et al., 2005), we focus on the effect of RPTs on firm value.
Our findings are important for investors, auditors and regulators and have important implications that may generalize to other settings with similar institutional characteristics. In this sense, while some progress has been achieved over the past decades in trying to develop an effective legal and regulatory framework for RPTs, remaining challenges to enforcement and inadequate board oversight have facilitated abusive RPTs. Thus, whether the identification of RPTs and the disclosure of complete information on RPTs presents a specific challenge in this setting, effective monitoring and curbing of abusive RPTs to avoid controlling shareholders entering into a transaction to the detriment of non-controlling owners should remain a priority on the agenda of corporate governance concerns in Spain. Thus, those involved in corporate governance should carefully consider the potential market costs of entering into RPTs. While our findings provide additional information that might be useful in investment decisions, they also emphasize the need to increase audit efforts in the presence of RPTs. Furthermore, in a context where the main concern of corporate governance is the potential expropriation of minority shareholders by controlling owners, we show evidence that RPTs require a special regulator's attention in order to improve investor protection and market confidence to promote a more efficient allocation of resources. Lei and Song (2011) claim an important role for disclosure of RPTs in reducing tunnelling activities, however if the gains derived from opportunism are very large, as it might occur in the Spanish context, disclosure policies regarding RPTs may be insufficient to limit insiders from engaging in opportunistic behaviour (Chhaochharia and Grinstein, 2007; Jiang et al., 2010) because in the considered setting, the economic incentives that gave rise to this behaviour are still intact. According to McCahery and Vermeulen (2005) the most important change lies on the enforcement side, where private and public institutions are notably weak compared to the US. The challenge of fighting abusive related party transactions is as much about implementation and enforcement as the policy framework itself.
This paper suggests several avenues for future research. First, it could be interesting to analyze the interactions among the governance variables and the RPT measures on firm value. It would also be interesting to analyze the interactions between the use of RPTs and the properties of accounting earnings – particularly the use of RPTs as a vehicle for earnings management in the Spanish context.
The authors gratefully acknowledge the financial contribution of the Spanish Ministry of Economy and Competitiveness (research project ECO2013-48208-P).
The Global Competitiveness Report 2015–2016 assesses the competitiveness landscape of 140 economies, including the United States, Germany, The United Kingdom, Hong Kong and Spain, and provides insights into the drivers of their productivity and prosperity.
More precisely, we use the two-step system of GMM estimation included in the xtabond2 stata routine written by Roodman (2008). The two-step estimation estimates the regression with heteroskedasticity-robust standard errors.
articles