


We examine real activities manipulation by firms prior to their debt issuances and how such manipulation activities affect bond yield spreads. We find that bond-issuing firms increase their real activities manipulation in the five quarters leading to a bond issuance. We document an inverse association between yield spread and pre-issue real activities manipulation, i.e., firms engaged in abnormally high levels of real activities manipulation are associated with subsequent lower cost of debt.
We examine the presence of real earnings management (RM) around bond issues and their impact on the cost of issued bonds.1 As per Roychowdhury (2006), firms engage in RM activities either to avoid reporting losses or to respond to prevailing economic conditions. We find that there exists pre-issue real activities manipulation at bond issuing firms, which subsequently reduces their cost of debt.
Earnings management can be divided into two, i.e., accruals-based earnings management (AM) and real activities manipulation (RM). AM involves accounting manipulations with little to no cash flow consequences. Conversely, RM impacts the firm cash flows more significantly. Roychowdhury (2006) examines firms’ RM practices and finds that manipulating firms attempt to avoid losses by (i) offering price discounts to artificially boost sales figures; (ii) overproduction that results in high inventory figures and reduces the cost of sales to boost the firm's reported earnings; and, (iii) reducing discretionary expenditure (for instance, research and development (R&D)) to improve margins. Such actions, which constitute RM, are likely to adversely affect the firm's long run profitability and cash flows (Roychowdhury, 2006; Wang and D'Souza, 2006; Cohen and Zarowin, 2010; Zang, 2012).
AM and RM collectively form earnings management practices; however, this paper examines RM, and not AM, for the following reasons. The effect of AM on the cost of debt is already documented in Francis et al. (2005), Bharath et al. (2008), Prevost et al. (2008), and Liu et al. (2010). They find that firms managing earnings upwards issue debt at a lower cost. Liu et al. (2010) conclude that bondholders fail to see through the inflated earnings numbers in pricing new debt. However, the focus of the studies was solely on AM. Since the cash flow consequences of AM and RM differ as well as their use (see Zang, 2012), the results based on AM cannot be extended to firms that manage earnings using RM. Following the passage of the 2002 Sarbanes-Oxley Act (SOX), more firms are using RM than AM (Cohen et al., 2008) as it is more difficult to charge management for engaging in RM, which is often disguised as normal business decisions. Since investors rely heavily on issuing firm's financial reports to price a new bond issue, we attempt to fill a gap in the literature by examining RM (which is widely acknowledged as a common practice (Graham et al., 2005) that affect the financial reports on which investors rely for bond pricing decisions.
Our sample consists of 1578 bond issuers from 1980 to 2012. We follow the same methods as in Roychowdhury (2006) and Zang (2012) to compute the proxies for real earnings management. We find that firms increase the use of real earnings management prior to a bond issue. Next, there exists an inverse association between the pre-issue level of real earnings management and bonds’ yield spread. We also document an increase in issuing firms’ use of real earnings management post-SOX. Lastly, earnings manipulating firms tend to be large and profitable, yet they exhibit more earnings volatility as well as issue more noninvestment grade bonds.
Our findings contrast with Ge and Kim (2014). To start with, there are significant differences between our samples and data sources that could explain the divergent results and we discuss them later in the paper. Ge and Kim (2014) find a positive association between bonds’ risk premiums and the following two factors: sales manipulation and overproduction. They find no significant association between the risk premium and each of abnormal discretionary expenditure and the composite score of real earnings management. In contrast, we find an inverse association between bonds’ yield spreads and each of abnormal production cost, abnormal discretionary expenditure, total real earnings management as well as unexpected total real earnings management. Thus, our findings are more consistent across a greater number of real earnings management variables.
It is important to note that not all earnings management are construed as managerial opportunism. For instance, a firm may accrue more production costs in anticipation of increased demand (i.e., growth for which it needs to raise more financing). Similarly, a firm may postpone discretionary expenses to prioritize investments in productive capacity and working capital. Cuts in discretionary expenses will also reduce costs and improve liquidity. Likewise, firms may manipulate earnings in the short run to promote a bond issue without necessarily suggesting that they are misrepresenting the accounts. Thus, until we can clearly differentiate between good and bad earnings management (a weakness of our paper that we acknowledge in the conclusion), there is the risk that the findings would be dependent on the samples and methods used.
The rest of the paper is organized as follows. Literature Review and Hypotheses Development Section presents the related literature and hypothesis development. Data Section describes the data. Methodology Section elaborates the research methodology. Empirical Results Section discusses the results. Summary and Conclusions Section concludes the paper.
Literature review and hypotheses developmentThe phenomenon of earnings management has been documented in issuances of equity as well as debt. Teoh et al. (1998a) suggest that initial public offering (IPO) firms manage accruals upwards to inflate earnings (also see Chaney and Lewis (1998), Morsfield and Tan (2006)). The authors find high-accrual IPOs post-issuance stock return performance to be disappointing. Thus, there is little justification for the initial investor enthusiasm toward these IPOs.
Conversely, Ball and Shivakumar (2008) and Chang et al. (2010) IPO findings are opposite to the above. In the main, these authors conclude that investors’ due diligence as well as underwriters’ reputation inhibit high-quality firms from engaging in accruals manipulations (also see Hei Wai et al., 2012).
Rangan (1998), Teoh et al. (1998b), Shivakumar (2000), and Cohen and Zarowin (2010) document earnings management at firms engaged in seasoned equity offerings (SEOs). Rangan (1998) and Teoh et al. (1998b) find that manipulators are associated with poor post-issue performance. While most of the findings are based on AM, Cohen and Zarowin (2010) document that SEO firms also engage in RM. The authors find that post-SEO operating underperformance is not driven solely by accrual reversals, but also due to RM. Kothari et al. (2015) observe that RM is positively associated with overvaluation at the time of SEO. However, these firms underperform in the long run.
Nonetheless, the findings based on equity issues cannot be extended to debt issues in a straightforward manner. While both equity and debt are sources of finance to a company, yet only debt can lead the firm to bankruptcy. The financial burden imposed by debt on the company is far greater than that of equity. Shareholders are the residual claimants and in the normal course of business there is no obligation imposed legally on the firm to pay them.
Liu et al. (2010) document that firms manage earnings upward by manipulating discretionary accruals (AM) prior to bond issues. They also find that such firms can issue debt at a low cost and bondholders fail to see through the inflated earnings numbers in pricing new debts (also see Alissa et al., 2013). This could be due to the self-reverting property of accruals, which implies that the real cash flow consequences of AM over the long run is minor. Conversely, the cash flow consequences of RM (the subject of this paper) are real and far-reaching. Thus, it is essential to reconsider bond issuers’ use of earnings management using real activities manipulations (RM).
As argued earlier, the passage of SOX has made it more difficult to engage in AM and more managers dread the legal consequences of the act (also see Cohen et al., 2008). RM is likely to be perceived more of a business decision and less of an accounting manipulation than AM. Next, Zang (2012) explains that managers’ first choice is to use RM during the year and then to use AM at end of the year to achieve targets. To the extent that RM is sufficient to meet the targets, there is no recourse to AM.
Crabtree et al. (2014) examine a sample of newly issued bonds between 1990 and 2007. They find that RM is associated with lower bond ratings and the authors conclude that bond rating analysts do not view RM in a positive light. However, the actual RM monitoring performed by such analysts is arguable. Alissa et al. (2013) argue that ratings agencies do not see their role as auditors and accept that published financial statements are reasonable and accurate (Securities and Exchange Commission, 2003; Standard and Poor's, 2006). The competition among rating agencies further diminish their incentives to monitor earnings management at client firms.
Ge and Kim (2014) examine the relationship between RM and the cost of debt, and the authors document a positive relationship between the two. In the main, the authors argue that the adverse consequences of RM on the business earnings and cash flows lead bond investors to demand a high rate of return. However, they do not clarify how investors are able to identify and interpret the true consequences of RM, which are difficult to establish. To the extent that RM leads to a higher cost of debt, then it is hard to imagine why would bond issuers engage in RM to pay a higher cost of debt.
Instead, we hypothesize that bond issuers might use RM to signal their superior earnings quality to potential investors. While RM can potentially affect future cash flows, yet it boosts short-term earnings. The improved earnings figures would assist the bond issuer in successfully selling its bond issue at a lower cost of debt. The new funds raised from the issue would, in turn, serve the firm to resolve any potential loss owing to the above-average use of RM prior to the issue. These arguments lead to the testable hypothesis that firms, who successfully raise new funding from bond issues, are not affected by the long-term adverse consequences of RM, since the new funds raised are used to remedy any subsequent problem caused by RM.
Alternatively, these firms use RM prior to the bond issue to signal their superior earnings quality, which would mean that they would be associated with a lower cost of debt. There is ample evidence (e.g., Robbins and Schatzberg, 1986; Hsueh and Kidwell, 1988; Hansen and Crutchley, 1990; Davidson et al., 1995; Covitz and Harrison, 2004) to suggest that bond issuers engage in signaling activities, and we offer a test of the signaling hypothesis through the examination of firms’ pre-issue use of real activities manipulations. Alissa et al. (2013) find evidence to suggest that firms manage earnings to achieve their target ratings. We hypothesize that a firm desiring to signal its quality to bond investors would engage in RM, which would support the firm in signaling its quality to the investors.
To the extent that RM increases the information asymmetry between the bond issuer and the bond investor, it is difficult to imagine the basis upon which bond investors would penalize these issuers (since they know less than the issuer). Besides, it is well documented that RM is difficult to spot in the short run (for instance, see Zang, 2012). Thus, the practice of RM immediately prior to a bond issue has the potential to sway investors’ perception in a favorable light and, in consequence, benefit the firm from a lower cost of debt. There is evidence to suggest that firms using RM are able to achieve their short-term targets. For instance, Bhojraj et al. (2009) find that investors react favorably to the shares of firms that manage to just beat analysts’ forecasts using RM. Similarly, Cohen and Zarowin (2010), and Kothari et al. (2015) document share price increases at the time of equity offering by firms engaged in RM.
DataWe obtain data on bond issues by US firms from the SDC Platinum New Issues database. Our sample period starts in 1980 and ends in 2012. We eliminate observations without data on total proceeds and yield spread. We also eliminate firms that are not listed in Compustat and CRSP. We calculate various proxies of earnings management for the 12 quarters surrounding the quarter of the bond issue. The final sample size consists of 5608 firm-quarter observations, which is equivalent to 1578 firms.
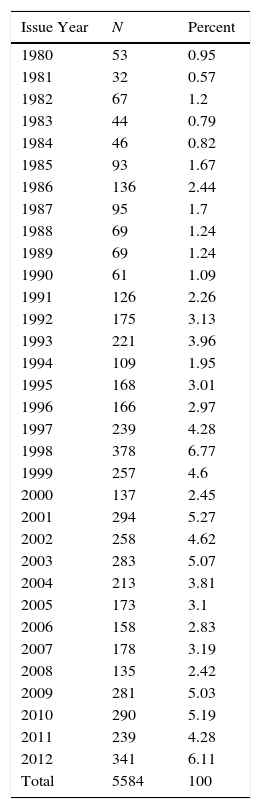
Table 1 shows the distribution of the final sample by year, bond ratings and industry. The number of bond issues has increased since 1990. Most of the bond issues do not have restrictive covenants (96.9%) and are investment grade bonds (60.3%). About 16.5% of the sample is from the manufacturing industry, followed by the wholesale, retail, and services (14.9%) and other industries (17%).
Sample distribution and descriptive statistics.
| Issue Year | N | Percent |
|---|---|---|
| 1980 | 53 | 0.95 |
| 1981 | 32 | 0.57 |
| 1982 | 67 | 1.2 |
| 1983 | 44 | 0.79 |
| 1984 | 46 | 0.82 |
| 1985 | 93 | 1.67 |
| 1986 | 136 | 2.44 |
| 1987 | 95 | 1.7 |
| 1988 | 69 | 1.24 |
| 1989 | 69 | 1.24 |
| 1990 | 61 | 1.09 |
| 1991 | 126 | 2.26 |
| 1992 | 175 | 3.13 |
| 1993 | 221 | 3.96 |
| 1994 | 109 | 1.95 |
| 1995 | 168 | 3.01 |
| 1996 | 166 | 2.97 |
| 1997 | 239 | 4.28 |
| 1998 | 378 | 6.77 |
| 1999 | 257 | 4.6 |
| 2000 | 137 | 2.45 |
| 2001 | 294 | 5.27 |
| 2002 | 258 | 4.62 |
| 2003 | 283 | 5.07 |
| 2004 | 213 | 3.81 |
| 2005 | 173 | 3.1 |
| 2006 | 158 | 2.83 |
| 2007 | 178 | 3.19 |
| 2008 | 135 | 2.42 |
| 2009 | 281 | 5.03 |
| 2010 | 290 | 5.19 |
| 2011 | 239 | 4.28 |
| 2012 | 341 | 6.11 |
| Total | 5584 | 100 |
| N | Percent | |
|---|---|---|
| Covenants | ||
| No | 5397 | 96.65 |
| Yes | 187 | 3.35 |
| Bond Rating | ||
| Noninvestment | 2218 | 39.72 |
| Investment | 3366 | 60.28 |
| Industry | ||
| Business Equipment | 443 | 7.93 |
| Chemicals and Allied Products | 402 | 7.2 |
| Consumer Durables | 167 | 2.99 |
| Energy | 628 | 11.25 |
| Healthcare, Medical Equipment, and Drugs | 300 | 5.37 |
| Manufacturing | 921 | 16.49 |
| Consumer Nondurables | 448 | 8.02 |
| Wholesale, Retail, and Some Services | 831 | 14.88 |
| Telephone and Television Transmission | 465 | 8.33 |
| Others | 979 | 17.53 |
| Firm and Bond Issue Characteristics | ||
|---|---|---|
| Variables | Mean | Median |
| Sales | 3156.78 | 932.67 |
| Assets | 13,993.06 | 4144.60 |
| ROA | 0.76% | 1.06% |
| Leverage | 0.67 | 0.64 |
| LtLev | 0.34 | 0.31 |
| M/B | 2.20 | 2.17 |
| RetVar | 0.00 | 0.00 |
| Collateral | 0.40 | 0.36 |
| Yield spread | 257.19 | 181.00 |
| Rating | 13.47 | 14.00 |
| Maturity | 46.45 | 40.00 |
| Proceeds | 313.05 | 225.00 |
This table provides the distribution and the descriptive statistics of 5608 firm-quarter observations over the period from 1980 to 2012 for the pooled sample. Sales is the net sales; Assets is the book value of total assets; ROA is ratio of income before extraordinary item to total assets; Leverage is the ratio of total debt to total assets; LtLev is the long-term debt over total assets; M/B is the market value of equity divided by the book value of equity; RetVar is the variance of stock returns over one quarter prior to bond issuance; Yield spread, measured in basis points, is the difference between the bond's yield at the time of issue and a maturity-matched U.S. Treasury bond; Rating is the bond's credit rating; Maturity is the number of quarters a bond is outstanding; Proceeds is the amount of the issue expressed in millions of dollars.
We report sample descriptive statistics in Table 1. Bond issuers tend to be large firms, with average sales of $3157 million and assets of $13,993 million. However, the high standard deviation in total assets suggests considerable variations in firm size. On average, bond issuers finance their business with 67% in debt. The sample firms are low on profitability (for instance, the mean ROA is 0.76%) and have a mean market to book ratio of 2.2.
The mean proceed of the bond issues is $313.05 million, and the yield spread is 257.19 basis points, which is similar to Liu et al. (2010) and Klock et al. (2005), who report mean yield spreads of 224 and 245 basis points, respectively. We use yield spread (YS) as the proxy for the firm's cost of debt. YS, measured in basis points, is the difference between the bond's yield and the yield on a maturity-matched U.S. Treasury bond. A company's YS is the weighted average of all its bonds’ YS in each quarter. On average, the maturity of the bonds is 46.45 quarters (i.e., 11.6 years) and carry a credit rating of 13.5, which is equivalent to a BBB S&P rating.2 Thus, the sample under investigation is comprised mostly of investment-grade bonds.
MethodologyReal activities manipulationFollowing Roychowdhury (2006) and Zang (2012), we use abnormal discretionary expenses and abnormal production cost to proxy for real activities manipulation. Managers can increase earnings by overproducing inventory to report lower costs of goods sold. With overproduction, managers can spread fixed overhead cost over a larger number of units, thus reducing unit cost and improving margins (Roychowdhury, 2006; Cohen et al., 2008; Cohen and Zarowin, 2010). Likewise, managers may cut discretionary expenditure to boost earnings in the short run. Discretionary expenditure includes research and development (R&D), advertising, and selling, general, and administrative expenses (SG&A). Consequently, real activities manipulation is reflected in abnormal levels of production costs and discretionary expenses.
An abnormal cost represents the difference between the actual and expected costs. To estimate the expected level of production costs, we use the following model:
where PRODi,t is the sum of the cost of goods sold and the change in inventory from the previous quarter of firm i in quarter t; At−1 is the total assets of firm i in quarter t−1; Salesi,t is the net sales of firm i in quarter t; and ΔSalesi,t is the change in net sales of firm i from quarter t−1 to t. Eq. (1) is estimated cross-sectionally using robust standard errors for each industry-quarter with at least 15 observations. Industry is classified using the Fama and French 48-sector codes. The abnormal level of production cost (RM_PROD) is measured as the residuals from Eq. (1) (μi,t). The higher the residuals, the larger is the amount of abnormal production costs, and the greater is the increase in reported earnings through reduction in the cost of goods sold.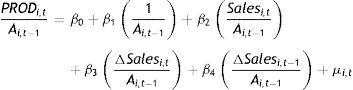
We estimate the expected level of discretionary expenditure using the following model:
where DISXt represents discretionary expenditures (i.e., the sum of R&D, advertising, and SG&A expenditures) of firm i in quarter t; At−1 is the total assets of firm i in quarter t−1; Salesi,t is the net sales of firm i in quarter t. The abnormal level of discretionary expenditures is measured as the estimated residuals from the regression (ei,t).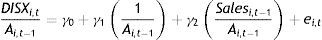
Based on the above equations, firms engaging in RM will report positive residuals from Eq. (1) and negative residuals from Eq. (2). To obtain a composite score representing total RM, we first multiply the residuals from Eq. (2) by −1 before adding them to the corresponding firm-quarter residuals from Eq. (1) (see Eq. (3) below). This transformation allows for a straightforward interpretation of RM from Eq. (3), i.e., higher values are associated with greater real activities manipulations. This transformation is consistent with other studies (for instance, Zang, 2012). To preserve consistency, in the remainder of the paper, (RM_DISX) is presented as the residual from Eq. (2) multiplied by −1.
Unexpected real activities manipulation
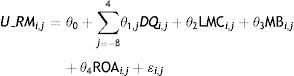
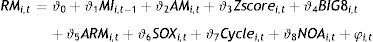
For robustness checks, we also compute proxies of unexpected real activities manipulation U_RM following Zang (2012). Under this method, the costs and benefits of engaging in RM are proxied using a range of variables as in Eq. (4). The residual from the equation represents the unexpected level of real activities manipulation (i.e., U_RM). To preserve space, we refer the avid reader to Zang (2012) for an in-depth explanation of how the various variables from Eq. (4) constitute a cost–benefit analysis of RM.
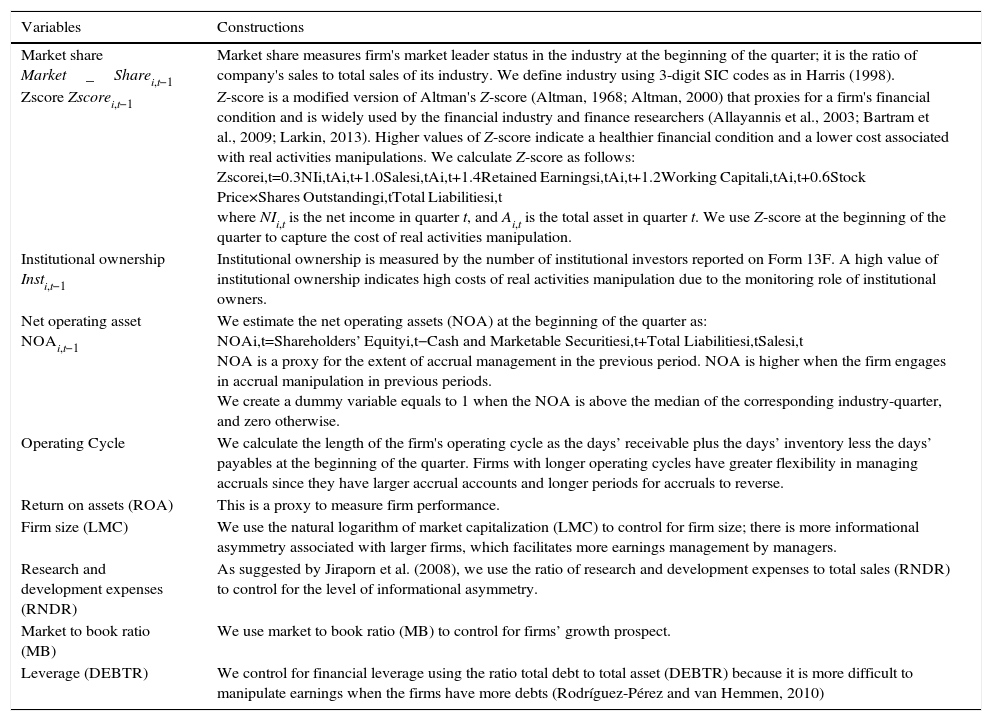
where RMi,t is the total real earnings management of firm i in quarter t obtained from Eq. (3). The proxy for the costs of RM includes the firm's market share, Z-score and institutional ownership Inst. Under Zang's (2012) framework, firms use AM at yearend when RM falls short of expectations. Thus, Eq. (4) also controls for the costs of AM using the firm's net operating assets NOA and its operating cycle Cycle. The remainder are control variables in the form of firm size (LMC), research and development expense ratio (RNDR), debt ratio (DEBTR), market-to-book ratio (MB) and return on asset (ROA). We elaborate on the construct of these variables and their expected relationship with RM in Appendix 1.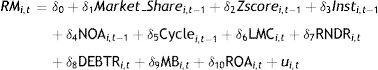
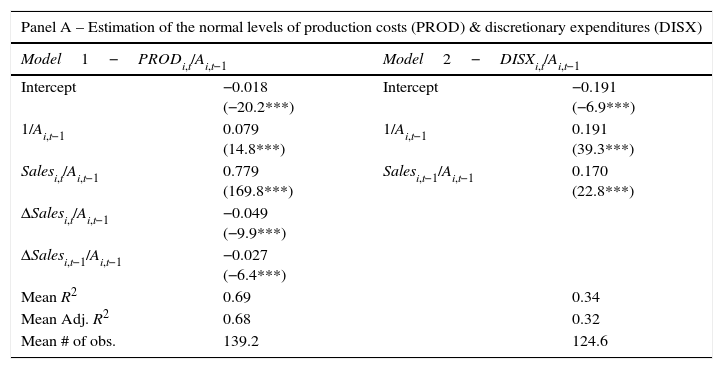
We estimate Eqs. (1), (2) and (3) using the whole population of 897,269 non-financial and non-utility firm-quarter observations included in the Compustat Quarterly Database from 1980 to 2012 then we merge them with our final database. We report the estimation results for the expected levels of RM_PROD, RM_DISX and RM in Table 2. The regressions are estimated cross-sectionally for each industry-quarter combination with at least 15 observations. We winsorize the coefficients at the top and bottom 1% levels to avoid extreme observations.
Measurement of Real Activities Manipulation.
| Panel A – Estimation of the normal levels of production costs (PROD) & discretionary expenditures (DISX) | |||
|---|---|---|---|
| Model1−PRODi,t/Ai,t−1 | Model2−DISXi,t/Ai,t−1 | ||
| Intercept | −0.018 (−20.2***) | Intercept | −0.191 (−6.9***) |
| 1/Ai,t−1 | 0.079 (14.8***) | 1/Ai,t−1 | 0.191 (39.3***) |
| Salesi,t/Ai,t−1 | 0.779 (169.8***) | Salesi,t−1/Ai,t−1 | 0.170 (22.8***) |
| ΔSalesi,t/Ai,t−1 | −0.049 (−9.9***) | ||
| ΔSalesi,t−1/Ai,t−1 | −0.027 (−6.4***) | ||
| Mean R2 | 0.69 | 0.34 | |
| Mean Adj. R2 | 0.68 | 0.32 | |
| Mean # of obs. | 139.2 | 124.6 | |
| Panel B – Estimation of the unexpected total real earnings management (RM) | |
|---|---|
| Variables | U_RM |
| Intercept | 0.052 (3.4***) |
| Market_Sharet−1 | 1.006 (11.2***) |
| Zscoret−1 | −0.018 (−9.1***) |
| Instt−1 | −0.018 (−0.3) |
| NOAt−1 | 0.013 (7.3***) |
| Cyclet−1 | 0.000 (−2.8***) |
| LMCt | 0.002 (1.1) |
| RNDRt | −10.700 (−2.8***) |
| DEBTRt | −0.004 (−0.3) |
| MBt | −0.002 (−0.8) |
| ROAt | −1.707 (−12.5***) |
| Mean R2 | 0.226 |
| Mean Adj. R2 | 0.122 |
| Panel C – Summary statistics for real activities manipulation | ||||||
|---|---|---|---|---|---|---|
| Variable | N | Mean | Median | Std. Dev. | 25% | 75% |
| RM | 878,823 | 0.000 | 0.051 | 1.473 | −0.524 | 0.604 |
| RM_PROD | 878,823 | −0.003 | −0.044 | 0.916 | −0.370 | 0.302 |
| RM_DISX | 878,823 | 0.003 | 0.114 | 0.905 | −0.202 | 0.389 |
| U_RM | 835,916 | −0.001 | 0.022 | 1.030 | −0.402 | 0.429 |
Panel A represents the regressions to obtain the abnormal level of production costs and discretionary expenditure (i.e., RM_PROD and RM_DISX, respectively). Panel B represents the regressions of the real earnings management variables whereby the error terms represent the corresponding unexpected levels of real earnings management (i.e., U_RM). Panel C represents summary statistics of the various real earnings management variables. *, **, and *** significance at 10%, 5%, and 1% level, respectively.
On average, each industry-quarter regression has more than 120 observations. All the mean coefficients are significant at the 1% level and qualitatively similar to those reported in Roychowdhury (2006) and Zang (2012). The mean adjusted R2 is 68% for the production cost model and 32% for the discretionary expenditure model. These models have as much explanatory power as those in Roychowdhury (2006) and Zang (2012).
We present the results from the regressions to derive the earnings management measures from Eqs. (1) and (2) in Panel A of Table 2. The result from the estimation of the unexpected real activities manipulation (Eq. (4)) is reported in Panel B in Table 4. Related descriptive statistics are presented in Panel C of Table 2. Consistent with the results reported by Zang (2012), the mean value of RM_PROD is negative, RM is zero, and RM_DISX is positive.
Univariate testsWe evaluate the level of real activities manipulation in the 8 quarters leading to and the 4 quarters following the bond issues. We use four measures to proxy real activities manipulation (i.e., RM, RM_PROD, RM_DISX, and U_RM). The traditional t- and non-parametric Wilcoxon tests are used to test for significant changes in the proxy variables.
Multiple regressionsWe run multiple regressions to test the effects of RM and U_RM while controlling for a range of factors as in Eqs. (5) and (6), respectively. To account for firms with multiple bond issues, we correct the standard errors for firm-clustering effect following Rogers (1993). The firm-clustering corrected standard errors allow for intra-group correlation by relaxing the usual requirement that the observations be independent. Thus, the observations are independent across firms but not necessarily within firms.
where RMi,jandU_RMi,j are as explained earlier. DQ is a dummy variable representing the number of a quarter relative to quarter 0, which is the quarter of the bond issue. For example, eight quarters prior to the quarter of issue will take a value of −8.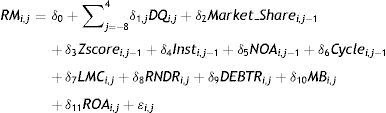
To establish the effects of RM on the bonds’ yield spreads, we run the following model, which is similar to Liu et al. (2010):
where YSi,t is the proceeds-weighted bond yield spread of firm i in quarter j; EMi,j−1 is one of the four measures of real activities manipulations of firm i in quarter j−1; LTAi,j is the natural logarithm of total asset for firm i in quarter j (note that larger firms tend to be less risky and may benefit from lower cost of debt); ROAi,j is the return on asset computed as the ratio of net income to total assets; DEBTi,j is the ratio of total debt to total assets; MBi,j is the market value of asset divided by the book value of assets; Colli,j is a proxy for a firm's value of collaterals, which is measured as the ratio of property, plan, and equipment (PPE)-to-total assets (firms with higher collaterals represent lower risk to investors and may benefit from a lower cost of debt); RVi,j is the variance of daily stock returns in the quarter preceding the bond issue; LPi,j is the natural logarithm of the total proceeds from the bond issue; LMi,j is the natural logarithm of the number of quarters to maturity for a bond (if a firm has more than one bond issue in a quarter LPi,j and LMi,j are the proceeds-weighted average of all bonds for firm i in quarter j); Ratingi,j is the proceeds-weighted numerical credit ratings of a bond and it is proceeds-weighted for a firm.Empirical resultsUnivariate results – real activities manipulation around bond issues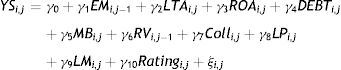
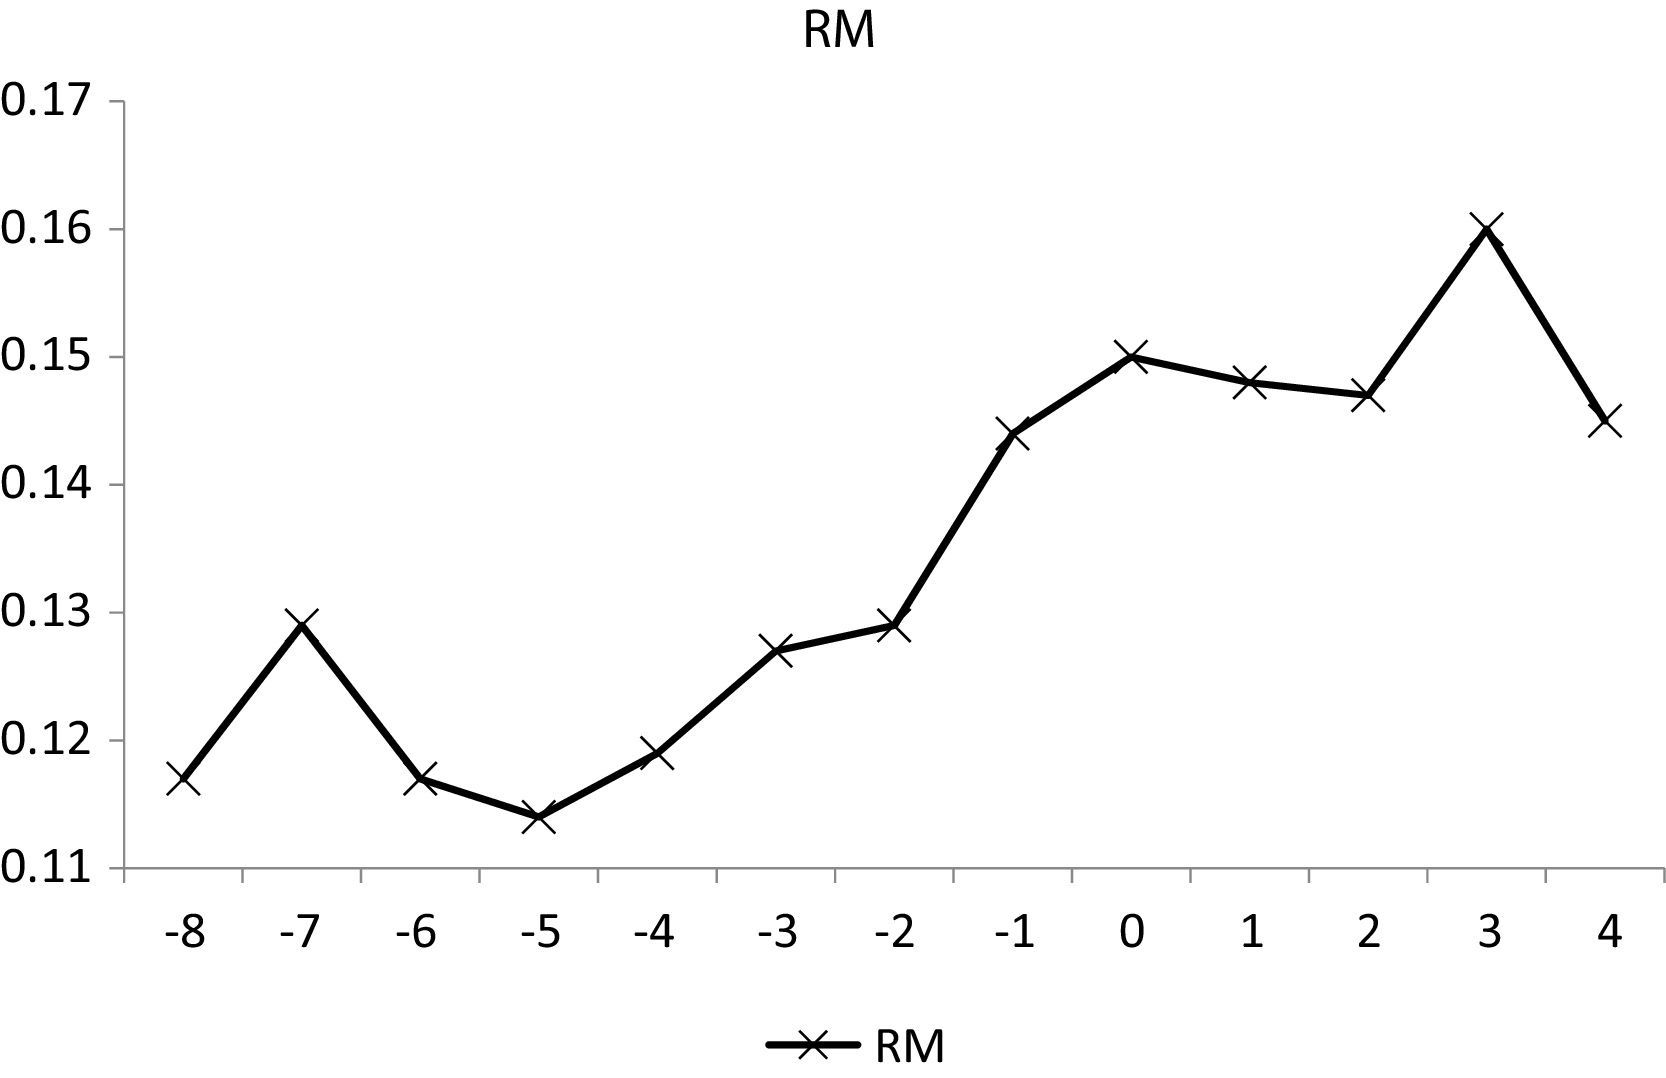
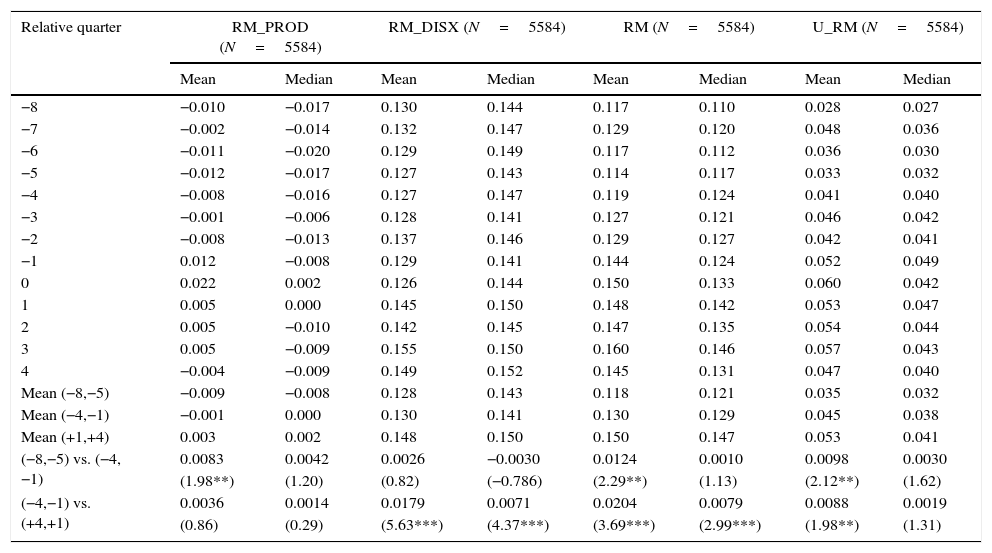
Table 3 reports the mean real activities manipulation variables by quarters surrounding quarter 0, i.e., the quarter of the issue. The differences in the mean values of RM_PROD, RM and U_RM between quarters −8 to −5 and quarters −4 to −1 are positive and statistically significant. Starting with quarter −5, the quarterly mean values of the different proxies of real earnings management increase monotonically. This trend is better illustrated in Fig. 1. The univariate tests show high levels of real earnings management in the four quarters leading up to the bond issue.
Real activities manipulation around bond issuances.
| Relative quarter | RM_PROD (N=5584) | RM_DISX (N=5584) | RM (N=5584) | U_RM (N=5584) | ||||
|---|---|---|---|---|---|---|---|---|
| Mean | Median | Mean | Median | Mean | Median | Mean | Median | |
| −8 | −0.010 | −0.017 | 0.130 | 0.144 | 0.117 | 0.110 | 0.028 | 0.027 |
| −7 | −0.002 | −0.014 | 0.132 | 0.147 | 0.129 | 0.120 | 0.048 | 0.036 |
| −6 | −0.011 | −0.020 | 0.129 | 0.149 | 0.117 | 0.112 | 0.036 | 0.030 |
| −5 | −0.012 | −0.017 | 0.127 | 0.143 | 0.114 | 0.117 | 0.033 | 0.032 |
| −4 | −0.008 | −0.016 | 0.127 | 0.147 | 0.119 | 0.124 | 0.041 | 0.040 |
| −3 | −0.001 | −0.006 | 0.128 | 0.141 | 0.127 | 0.121 | 0.046 | 0.042 |
| −2 | −0.008 | −0.013 | 0.137 | 0.146 | 0.129 | 0.127 | 0.042 | 0.041 |
| −1 | 0.012 | −0.008 | 0.129 | 0.141 | 0.144 | 0.124 | 0.052 | 0.049 |
| 0 | 0.022 | 0.002 | 0.126 | 0.144 | 0.150 | 0.133 | 0.060 | 0.042 |
| 1 | 0.005 | 0.000 | 0.145 | 0.150 | 0.148 | 0.142 | 0.053 | 0.047 |
| 2 | 0.005 | −0.010 | 0.142 | 0.145 | 0.147 | 0.135 | 0.054 | 0.044 |
| 3 | 0.005 | −0.009 | 0.155 | 0.150 | 0.160 | 0.146 | 0.057 | 0.043 |
| 4 | −0.004 | −0.009 | 0.149 | 0.152 | 0.145 | 0.131 | 0.047 | 0.040 |
| Mean (−8,−5) | −0.009 | −0.008 | 0.128 | 0.143 | 0.118 | 0.121 | 0.035 | 0.032 |
| Mean (−4,−1) | −0.001 | 0.000 | 0.130 | 0.141 | 0.130 | 0.129 | 0.045 | 0.038 |
| Mean (+1,+4) | 0.003 | 0.002 | 0.148 | 0.150 | 0.150 | 0.147 | 0.053 | 0.041 |
| (−8,−5) vs. (−4,−1) | 0.0083 | 0.0042 | 0.0026 | −0.0030 | 0.0124 | 0.0010 | 0.0098 | 0.0030 |
| (1.98**) | (1.20) | (0.82) | (−0.786) | (2.29**) | (1.13) | (2.12**) | (1.62) | |
| (−4,−1) vs. (+4,+1) | 0.0036 | 0.0014 | 0.0179 | 0.0071 | 0.0204 | 0.0079 | 0.0088 | 0.0019 |
| (0.86) | (0.29) | (5.63***) | (4.37***) | (3.69***) | (2.99***) | (1.98**) | (1.31) | |
This table presents each individual real earnings management measure (i.e., RM_PROD, RM_DISX, RM, and U_RM) around the bond offerings in quarter 0. *, **, and *** indicate significance at 10%, 5%, and 1% level, respectively.
 around bond issuances.")
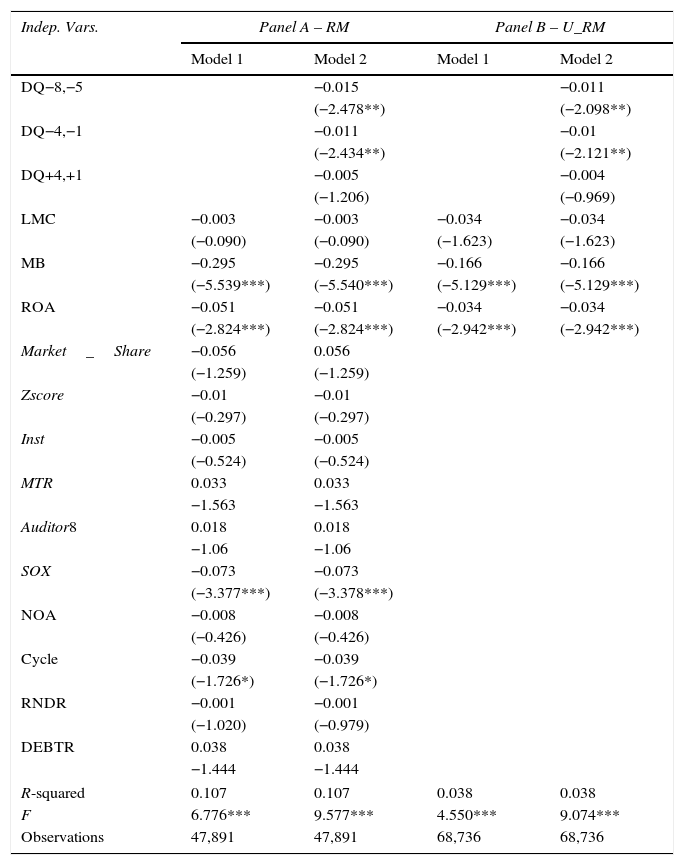
In this section, we test for the pre-issue high levels of RM using multiple regression analysis and present our findings in Table 4. Panel A presents the results of total real earnings management (RM) and panel B analyses the unexpected real earnings management (U_RM). The coefficient of the dummy variable representing the quarters (−4, −1) is higher in magnitude than the coefficient of the dummy variable representing quarters (−8, −5) in both regressions. Thus, real earnings management are higher in the quarters closer to the bond issue.
Cross-sectional analysis of real activities manipulation around bond issues.
| Indep. Vars. | Panel A – RM | Panel B – U_RM | ||
|---|---|---|---|---|
| Model 1 | Model 2 | Model 1 | Model 2 | |
| DQ−8,−5 | −0.015 | −0.011 | ||
| (−2.478**) | (−2.098**) | |||
| DQ−4,−1 | −0.011 | −0.01 | ||
| (−2.434**) | (−2.121**) | |||
| DQ+4,+1 | −0.005 | −0.004 | ||
| (−1.206) | (−0.969) | |||
| LMC | −0.003 | −0.003 | −0.034 | −0.034 |
| (−0.090) | (−0.090) | (−1.623) | (−1.623) | |
| MB | −0.295 | −0.295 | −0.166 | −0.166 |
| (−5.539***) | (−5.540***) | (−5.129***) | (−5.129***) | |
| ROA | −0.051 | −0.051 | −0.034 | −0.034 |
| (−2.824***) | (−2.824***) | (−2.942***) | (−2.942***) | |
| Market_Share | −0.056 | 0.056 | ||
| (−1.259) | (−1.259) | |||
| Zscore | −0.01 | −0.01 | ||
| (−0.297) | (−0.297) | |||
| Inst | −0.005 | −0.005 | ||
| (−0.524) | (−0.524) | |||
| MTR | 0.033 | 0.033 | ||
| −1.563 | −1.563 | |||
| Auditor8 | 0.018 | 0.018 | ||
| −1.06 | −1.06 | |||
| SOX | −0.073 | −0.073 | ||
| (−3.377***) | (−3.378***) | |||
| NOA | −0.008 | −0.008 | ||
| (−0.426) | (−0.426) | |||
| Cycle | −0.039 | −0.039 | ||
| (−1.726*) | (−1.726*) | |||
| RNDR | −0.001 | −0.001 | ||
| (−1.020) | (−0.979) | |||
| DEBTR | 0.038 | 0.038 | ||
| −1.444 | −1.444 | |||
| R-squared | 0.107 | 0.107 | 0.038 | 0.038 |
| F | 6.776*** | 9.577*** | 4.550*** | 9.074*** |
| Observations | 47,891 | 47,891 | 68,736 | 68,736 |
This table presents the multiple regressions of the total real earnings management (RM) and unexpected real earnings management variables (U_RM). *, ** and *** indicate significance at 10%, 5%, and 1% levels, respectively. T-values are in parenthesis and are adjusted for firm-level clustering effects.
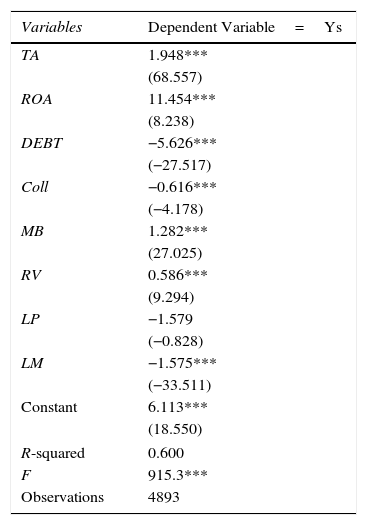
In this section, we examine the relationship between firms’ use of RM prior to issuing bonds and the cost of their debt, which is proxied by the bond's yield spread. As per Eq. (7), we regress the yield spread on the real earnings management variables as well as several control variables, which include, among other things, the bond's credit ratings. The ratings, though, are highly influenced by several variables that are already included in the regression and pause an issue of multicollinearity. To account for the multicollinearity, we first orthogonalize the credit ratings variable using Eq. (8) (similar to Ashbaugh-Skaife et al., 2006; Liu et al., 2010). Specifically, we regress the ratings variable on the other control variables and use the error terms from the regression in place of the raw ratings scores.
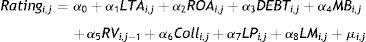
The variables are as defined earlier. The regression results from Eq. (8) are presented in Table 5. As expected, most of the independent variables are significantly related to the ratings variable and are of the correct sign. For instance, higher values of Total Assets, Return on Assets and Market-to-Book ratios are associated with higher ratings scores, since large and profitable organizations are less likely to default.
Orthogonalized credit ratings regression.
| Variables | Dependent Variable=Ys |
|---|---|
| TA | 1.948*** |
| (68.557) | |
| ROA | 11.454*** |
| (8.238) | |
| DEBT | −5.626*** |
| (−27.517) | |
| Coll | −0.616*** |
| (−4.178) | |
| MB | 1.282*** |
| (27.025) | |
| RV | 0.586*** |
| (9.294) | |
| LP | −1.579 |
| (−0.828) | |
| LM | −1.575*** |
| (−33.511) | |
| Constant | 6.113*** |
| (18.550) | |
| R-squared | 0.600 |
| F | 915.3*** |
| Observations | 4893 |
This table presents the result of cross-sectional regression of the bond credit ratings using Eq. (9). *, ** and *** indicate significance at 10%, 5%, and 1% levels, respectively. T-values are in parenthesis and are adjusted for firm-level clustering effects.
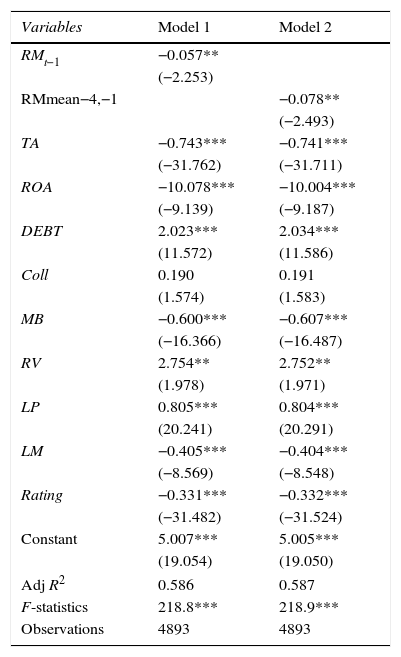
Table 6 presents the estimation results of Eq. (7) (i.e., the yield spread regressions) with the standard errors corrected for firm-clustering effects. We test the effect of two variables, i.e., the extent of RM in the quarter prior to the bond issue (i.e., RMt−1) and over the four quarters immediately preceding the issue (RMmean−4,−1). Both coefficients are negative and statistically significant suggesting the existence of an inverse association between pre-bond issue real earnings management and the bond yield spread. Therefore, firms that are associated with higher pre-issue earnings management benefit from a lower cost of debt.
Cross-sectional regressions of yield spreads on real activities manipulation.
| Variables | Model 1 | Model 2 |
|---|---|---|
| RMt−1 | −0.057** | |
| (−2.253) | ||
| RMmean−4,−1 | −0.078** | |
| (−2.493) | ||
| TA | −0.743*** | −0.741*** |
| (−31.762) | (−31.711) | |
| ROA | −10.078*** | −10.004*** |
| (−9.139) | (−9.187) | |
| DEBT | 2.023*** | 2.034*** |
| (11.572) | (11.586) | |
| Coll | 0.190 | 0.191 |
| (1.574) | (1.583) | |
| MB | −0.600*** | −0.607*** |
| (−16.366) | (−16.487) | |
| RV | 2.754** | 2.752** |
| (1.978) | (1.971) | |
| LP | 0.805*** | 0.804*** |
| (20.241) | (20.291) | |
| LM | −0.405*** | −0.404*** |
| (−8.569) | (−8.548) | |
| Rating | −0.331*** | −0.332*** |
| (−31.482) | (−31.524) | |
| Constant | 5.007*** | 5.005*** |
| (19.054) | (19.050) | |
| Adj R2 | 0.586 | 0.587 |
| F-statistics | 218.8*** | 218.9*** |
| Observations | 4893 | 4893 |
This table reports the cross-sectional regressions of the yield spread following Eq. (7). *, ** and *** indicate significance at 10%, 5%, and 1% levels, respectively. T-values are in parenthesis and are adjusted for firm-level clustering effects.
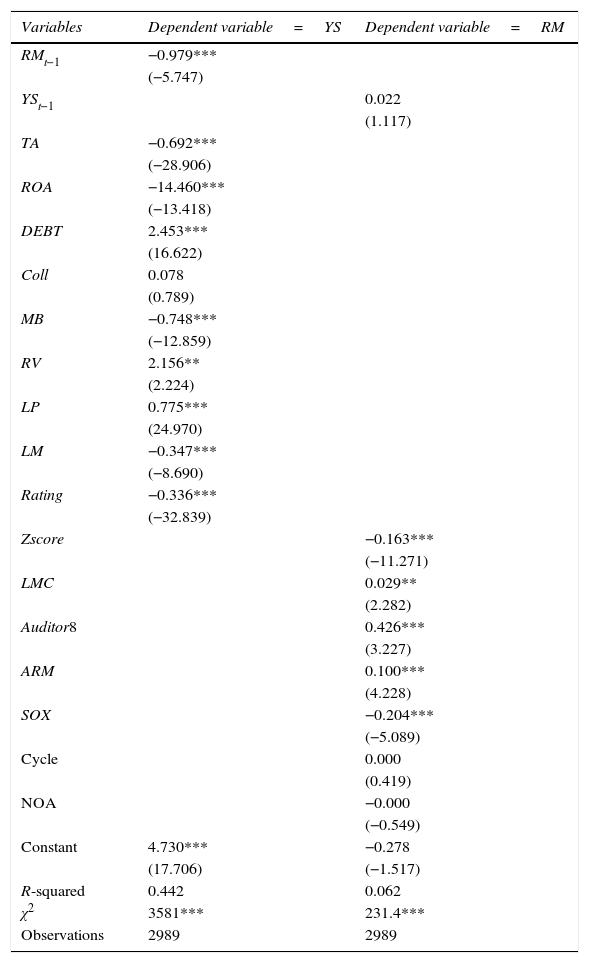
The relationship between bond yield spread and real activities manipulation may not be unidirectional; these two elements could be jointly determined, which would bias our findings. To address the potential endogeneity concern, we estimate a system of structural equations using the three-stage least square (3SLS) model. In the first equation, Yield Spread (YS) is the dependent variable and in the second equation RM (i.e., total real earnings management) is the dependent variable. In both equations, the first lagged values of YS and RM act as endogenous instrument variables (following Kim and Park, 2005; Liu et al., 2010). More specifically, we estimate the following two models as in Eqs. (9) and (10):
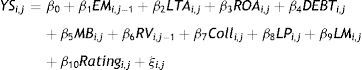
The variables are as defined earlier, except for the following: AM is a proxy variable for accruals management using Jones (1991) model; BIG8 is a dummy variable representing firms audited by one of the Big 8 US auditing firms, else it takes a value of zero; and, SOX is an indicator variable representing the years post 2002 Sarbanes Oxley Act. The latter two variables are associated with more accounting scrutiny and less earnings management.
We present our findings in Table 7. Consistent with the prior findings, the RM variable from the prior quarter is negatively and significantly related to the firm's bond yield spread. Thus, firms that engage in higher levels of real earnings management in the quarter preceding their bond issue benefit from a lower yield spread.
Robustness Regressions 1 – three-stage least squares regressions.
| Variables | Dependent variable=YS | Dependent variable=RM |
|---|---|---|
| RMt−1 | −0.979*** | |
| (−5.747) | ||
| YSt−1 | 0.022 | |
| (1.117) | ||
| TA | −0.692*** | |
| (−28.906) | ||
| ROA | −14.460*** | |
| (−13.418) | ||
| DEBT | 2.453*** | |
| (16.622) | ||
| Coll | 0.078 | |
| (0.789) | ||
| MB | −0.748*** | |
| (−12.859) | ||
| RV | 2.156** | |
| (2.224) | ||
| LP | 0.775*** | |
| (24.970) | ||
| LM | −0.347*** | |
| (−8.690) | ||
| Rating | −0.336*** | |
| (−32.839) | ||
| Zscore | −0.163*** | |
| (−11.271) | ||
| LMC | 0.029** | |
| (2.282) | ||
| Auditor8 | 0.426*** | |
| (3.227) | ||
| ARM | 0.100*** | |
| (4.228) | ||
| SOX | −0.204*** | |
| (−5.089) | ||
| Cycle | 0.000 | |
| (0.419) | ||
| NOA | −0.000 | |
| (−0.549) | ||
| Constant | 4.730*** | −0.278 |
| (17.706) | (−1.517) | |
| R-squared | 0.442 | 0.062 |
| χ2 | 3581*** | 231.4*** |
| Observations | 2989 | 2989 |
This table presents a system of structural equations using the three-stage least square (3SLS) model. In the first equation, Yield Spread (YS) is the dependent variable and in the second equation Total Real Earnings Management (i.e., RM) is the dependent variable. In both equations, the first lagged values of YS and RM are endogenous explanatory variables. *, ** and *** indicate significance at 10%, 5%, and 1% levels, respectively. T-values are in parenthesis and are adjusted for firm-level clustering effects.
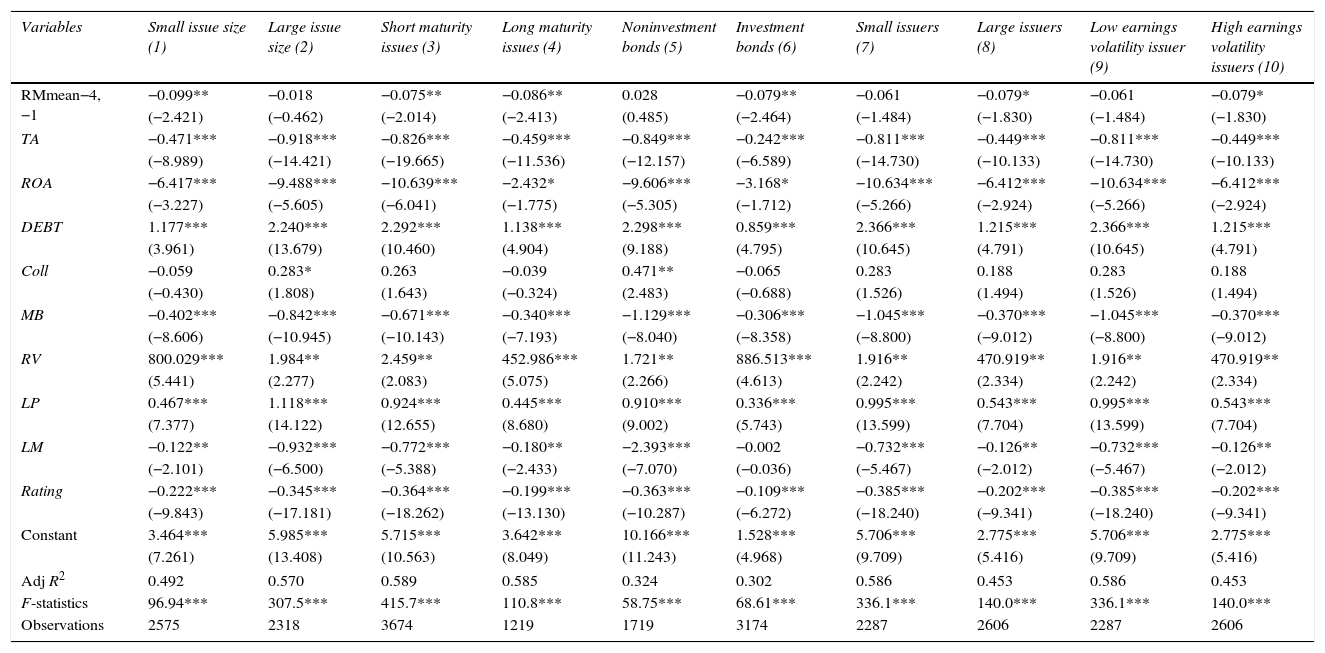
We examine whether the inverse relationship between corporate bond yield spread and real activities manipulation varies by bond issues and issuer characteristics, respectively. First, we divide the sample by issue size, which we measure using the ratio of issue size-to-total assets. To the extent that RM benefits bond issues by reducing the cost of debt, then larger bond issues should benefit greatly. The results in models 1 and 2 of Table 8 show that the coefficients on RMmean−4,−1 are negative and significant at the 5% level for smaller issues and statistically insignificant for larger issues. Thus, the inverse effect of RM on bond spread is significant amongst smaller issues.
Robustness Regressions 2 – regressions by subsamples.
| Variables | Small issue size (1) | Large issue size (2) | Short maturity issues (3) | Long maturity issues (4) | Noninvestment bonds (5) | Investment bonds (6) | Small issuers (7) | Large issuers (8) | Low earnings volatility issuer (9) | High earnings volatility issuers (10) |
|---|---|---|---|---|---|---|---|---|---|---|
| RMmean−4,−1 | −0.099** | −0.018 | −0.075** | −0.086** | 0.028 | −0.079** | −0.061 | −0.079* | −0.061 | −0.079* |
| (−2.421) | (−0.462) | (−2.014) | (−2.413) | (0.485) | (−2.464) | (−1.484) | (−1.830) | (−1.484) | (−1.830) | |
| TA | −0.471*** | −0.918*** | −0.826*** | −0.459*** | −0.849*** | −0.242*** | −0.811*** | −0.449*** | −0.811*** | −0.449*** |
| (−8.989) | (−14.421) | (−19.665) | (−11.536) | (−12.157) | (−6.589) | (−14.730) | (−10.133) | (−14.730) | (−10.133) | |
| ROA | −6.417*** | −9.488*** | −10.639*** | −2.432* | −9.606*** | −3.168* | −10.634*** | −6.412*** | −10.634*** | −6.412*** |
| (−3.227) | (−5.605) | (−6.041) | (−1.775) | (−5.305) | (−1.712) | (−5.266) | (−2.924) | (−5.266) | (−2.924) | |
| DEBT | 1.177*** | 2.240*** | 2.292*** | 1.138*** | 2.298*** | 0.859*** | 2.366*** | 1.215*** | 2.366*** | 1.215*** |
| (3.961) | (13.679) | (10.460) | (4.904) | (9.188) | (4.795) | (10.645) | (4.791) | (10.645) | (4.791) | |
| Coll | −0.059 | 0.283* | 0.263 | −0.039 | 0.471** | −0.065 | 0.283 | 0.188 | 0.283 | 0.188 |
| (−0.430) | (1.808) | (1.643) | (−0.324) | (2.483) | (−0.688) | (1.526) | (1.494) | (1.526) | (1.494) | |
| MB | −0.402*** | −0.842*** | −0.671*** | −0.340*** | −1.129*** | −0.306*** | −1.045*** | −0.370*** | −1.045*** | −0.370*** |
| (−8.606) | (−10.945) | (−10.143) | (−7.193) | (−8.040) | (−8.358) | (−8.800) | (−9.012) | (−8.800) | (−9.012) | |
| RV | 800.029*** | 1.984** | 2.459** | 452.986*** | 1.721** | 886.513*** | 1.916** | 470.919** | 1.916** | 470.919** |
| (5.441) | (2.277) | (2.083) | (5.075) | (2.266) | (4.613) | (2.242) | (2.334) | (2.242) | (2.334) | |
| LP | 0.467*** | 1.118*** | 0.924*** | 0.445*** | 0.910*** | 0.336*** | 0.995*** | 0.543*** | 0.995*** | 0.543*** |
| (7.377) | (14.122) | (12.655) | (8.680) | (9.002) | (5.743) | (13.599) | (7.704) | (13.599) | (7.704) | |
| LM | −0.122** | −0.932*** | −0.772*** | −0.180** | −2.393*** | −0.002 | −0.732*** | −0.126** | −0.732*** | −0.126** |
| (−2.101) | (−6.500) | (−5.388) | (−2.433) | (−7.070) | (−0.036) | (−5.467) | (−2.012) | (−5.467) | (−2.012) | |
| Rating | −0.222*** | −0.345*** | −0.364*** | −0.199*** | −0.363*** | −0.109*** | −0.385*** | −0.202*** | −0.385*** | −0.202*** |
| (−9.843) | (−17.181) | (−18.262) | (−13.130) | (−10.287) | (−6.272) | (−18.240) | (−9.341) | (−18.240) | (−9.341) | |
| Constant | 3.464*** | 5.985*** | 5.715*** | 3.642*** | 10.166*** | 1.528*** | 5.706*** | 2.775*** | 5.706*** | 2.775*** |
| (7.261) | (13.408) | (10.563) | (8.049) | (11.243) | (4.968) | (9.709) | (5.416) | (9.709) | (5.416) | |
| Adj R2 | 0.492 | 0.570 | 0.589 | 0.585 | 0.324 | 0.302 | 0.586 | 0.453 | 0.586 | 0.453 |
| F-statistics | 96.94*** | 307.5*** | 415.7*** | 110.8*** | 58.75*** | 68.61*** | 336.1*** | 140.0*** | 336.1*** | 140.0*** |
| Observations | 2575 | 2318 | 3674 | 1219 | 1719 | 3174 | 2287 | 2606 | 2287 | 2606 |
This table presents the cross-sectional regressions of the yield spread by various subsamples. *, ** and *** indicate significance at 10%, 5%, and 1% levels, respectively.
Second, we divide the sample by the bond's maturity. Models 3 and 4 of Table 8 shows that the coefficients of RMmean−4,−1 are negative and significant at the 5% level for both short and long maturities.
Next, we examine if the RM effect on yield spread is dependent on bond's ratings. Models 5 and 6 of Table 8 show that firms that issue investment grade bonds (ratings greater than 12) engage in more real activities manipulations than noninvestment grade bonds.
In Models 7 and 8 of Table 8, we examine the effect of the firm market capitalization, and find that the inverse relationship between RM and YS exists only for large issuers. Furthermore, we compute earnings volatility as the standard deviation of the issuing firm's Income Before Extraordinary Items over the eight quarters preceding the bond issue. We hypothesize that issuers with higher earnings volatility would engage in above average RM to smoothen the volatility. Models 9 and 10 of Table 8 show that the coefficient of RMmean−4,−1 is negative and significant at the 10% level for issuers associated with higher earnings; the coefficient is not statistically significant amongst issuers associated lower earnings volatility. Thus, real activities manipulation is more likely to result in lower yield spread when the earnings of the issuer is more volatile.
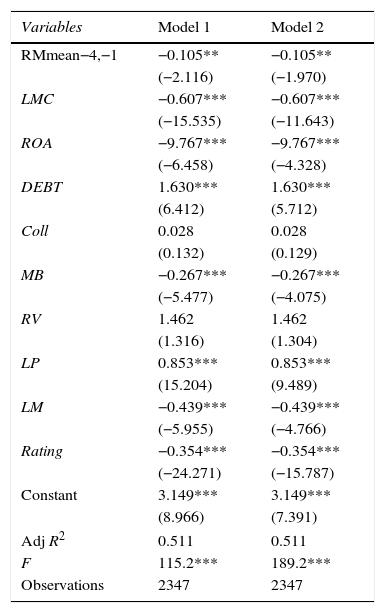
Since Cohen and Zarowin (2010) document that SEO firms engage in real activities manipulation and the underperformance post-SEO is explained by real activities manipulation; we exclude firms that conduct both SEOs and debt issues in the same quarter, and re-estimate equation (7) using the revised sample, and present our findings in Table 9. The results from Models 1 and 2 are not driven by SEO firms. The estimated coefficient of RMmean−4,−1 is negative and significant at the 5% level. Thus, the results are not driven by SEO firms only.
Regression of yield spreads on RM excluding SEO firms.
| Variables | Model 1 | Model 2 |
|---|---|---|
| RMmean−4,−1 | −0.105** | −0.105** |
| (−2.116) | (−1.970) | |
| LMC | −0.607*** | −0.607*** |
| (−15.535) | (−11.643) | |
| ROA | −9.767*** | −9.767*** |
| (−6.458) | (−4.328) | |
| DEBT | 1.630*** | 1.630*** |
| (6.412) | (5.712) | |
| Coll | 0.028 | 0.028 |
| (0.132) | (0.129) | |
| MB | −0.267*** | −0.267*** |
| (−5.477) | (−4.075) | |
| RV | 1.462 | 1.462 |
| (1.316) | (1.304) | |
| LP | 0.853*** | 0.853*** |
| (15.204) | (9.489) | |
| LM | −0.439*** | −0.439*** |
| (−5.955) | (−4.766) | |
| Rating | −0.354*** | −0.354*** |
| (−24.271) | (−15.787) | |
| Constant | 3.149*** | 3.149*** |
| (8.966) | (7.391) | |
| Adj R2 | 0.511 | 0.511 |
| F | 115.2*** | 189.2*** |
| Observations | 2347 | 2347 |
This table reports the cross-sectional regressions of the yield spread following Eq. (7) and control for a subsample that excludes firms that conduct SEOs during the same quarter as the debt issue. *, ** and *** indicate significance at 10%, 5%, and 1% levels, respectively. T-values are in parenthesis and are adjusted for firm-level clustering effects.
This paper examines how real activities manipulations by bond issuers affect their yield spread. Extending the findings of Cohen and Zarowin (2010), we find that similar to equity issuers, bond issuers also engage in real activities manipulations in the quarters immediately preceding the bond issues. The level of real earnings manipulations is statistically different in the five quarters immediately preceding the bond issue than the remainder quarters. We find that the propensity to engage in earnings manipulations increases with earnings volatility, size and profitability, and it is also high among noninvestment-grade bonds. The abnormally high-level of pre-issue real earnings management is associated with lower yield spread. This relationship affects small issues, investment-grade bonds, large firms, firms with volatile earnings and low profitability. Thus, issuers that engage in real activities manipulations prior to bond issues are associated with lower cost of bonds.
Managers have incentives to engage in real earnings management (RM) that reduces the risk premium (Bhojraj et al., 2009; Cohen and Zarowin, 2010; Graham et al., 2005). Bhojraj et al. (2009) find that investors overvalue the shares of firms that manage to just beat analysts’ forecasts using RM. Cohen and Zarowin (2010) find that investors’ overvaluations of SEOs are a direct function of the firm's real activities manipulations. Thus, there is ample evidence that investors misprice RM and our study documents similar findings in the market for new bond issues. To the degree that bond issuers use real earnings management to signal their quality to investors, then future research should differentiate between good and bad real earnings management signals and relate them to the cost of debt capital.
| Variables | Constructions |
|---|---|
| Market share Market_Sharei,t−1 | Market share measures firm's market leader status in the industry at the beginning of the quarter; it is the ratio of company's sales to total sales of its industry. We define industry using 3-digit SIC codes as in Harris (1998). |
| Zscore Zscorei,t−1 | Z-score is a modified version of Altman's Z-score (Altman, 1968; Altman, 2000) that proxies for a firm's financial condition and is widely used by the financial industry and finance researchers (Allayannis et al., 2003; Bartram et al., 2009; Larkin, 2013). Higher values of Z-score indicate a healthier financial condition and a lower cost associated with real activities manipulations. We calculate Z-score as follows: Zscorei,t=0.3NIi,tAi,t+1.0Salesi,tAi,t+1.4Retained Earningsi,tAi,t+1.2Working Capitali,tAi,t+0.6Stock Price×Shares Outstandingi,tTotal Liabilitiesi,t where NIi,t is the net income in quarter t, and Ai,t is the total asset in quarter t. We use Z-score at the beginning of the quarter to capture the cost of real activities manipulation. |
| Institutional ownership Insti,t−1 | Institutional ownership is measured by the number of institutional investors reported on Form 13F. A high value of institutional ownership indicates high costs of real activities manipulation due to the monitoring role of institutional owners. |
| Net operating asset NOAi,t−1 | We estimate the net operating assets (NOA) at the beginning of the quarter as: NOAi,t=Shareholders’ Equityi,t−Cash and Marketable Securitiesi,t+Total Liabilitiesi,tSalesi,t NOA is a proxy for the extent of accrual management in the previous period. NOA is higher when the firm engages in accrual manipulation in previous periods. We create a dummy variable equals to 1 when the NOA is above the median of the corresponding industry-quarter, and zero otherwise. |
| Operating Cycle | We calculate the length of the firm's operating cycle as the days’ receivable plus the days’ inventory less the days’ payables at the beginning of the quarter. Firms with longer operating cycles have greater flexibility in managing accruals since they have larger accrual accounts and longer periods for accruals to reverse. |
| Return on assets (ROA) | This is a proxy to measure firm performance. |
| Firm size (LMC) | We use the natural logarithm of market capitalization (LMC) to control for firm size; there is more informational asymmetry associated with larger firms, which facilitates more earnings management by managers. |
| Research and development expenses (RNDR) | As suggested by Jiraporn et al. (2008), we use the ratio of research and development expenses to total sales (RNDR) to control for the level of informational asymmetry. |
| Market to book ratio (MB) | We use market to book ratio (MB) to control for firms’ growth prospect. |
| Leverage (DEBTR) | We control for financial leverage using the ratio total debt to total asset (DEBTR) because it is more difficult to manipulate earnings when the firms have more debts (Rodríguez-Pérez and van Hemmen, 2010) |
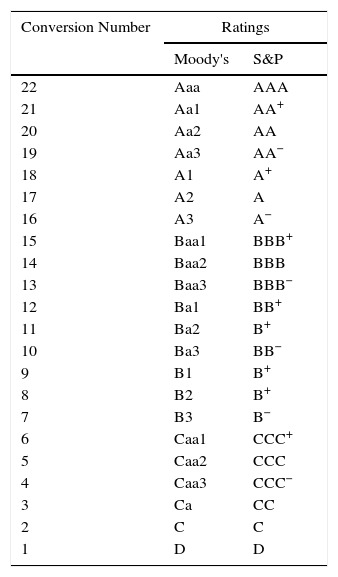
This table is borrowed from Table 1 of Klock et al. (2005) page 704 and provides the bond rating conversion codes for the Moody's and S&P ratings.
| Conversion Number | Ratings | |
|---|---|---|
| Moody's | S&P | |
| 22 | Aaa | AAA |
| 21 | Aa1 | AA+ |
| 20 | Aa2 | AA |
| 19 | Aa3 | AA− |
| 18 | A1 | A+ |
| 17 | A2 | A |
| 16 | A3 | A− |
| 15 | Baa1 | BBB+ |
| 14 | Baa2 | BBB |
| 13 | Baa3 | BBB− |
| 12 | Ba1 | BB+ |
| 11 | Ba2 | B+ |
| 10 | Ba3 | BB− |
| 9 | B1 | B+ |
| 8 | B2 | B+ |
| 7 | B3 | B− |
| 6 | Caa1 | CCC+ |
| 5 | Caa2 | CCC |
| 4 | Caa3 | CCC− |
| 3 | Ca | CC |
| 2 | C | C |
| 1 | D | D |
In this paper, RM, REM, real earnings management and real activities manipulations are used interchangeably and carry the same meaning.
See Appendix 2 on assigning numerical values to bond ratings. To proxy for ratings, we use the Standard and Poor's (S&P) credit ratings. Following Klock et al. (2005), we start with a value of 22 for AAA bond ratings and decreases the value by 1 for each succeeding rating until we reach 1 for D-rated bonds. If the S&P ratings are missing, we use Moody's ratings in its place. Note that AAA represents the highest rated bond and D represents the lowest rated bond.