


This paper estimates profit efficiency and its determinants in small and medium-sized manufacturing enterprises in Spain. The stochastic frontier methodology and the model proposed by Battese and Coelli (1995) were used to determine the impact of the technological and environmental differences between these companies on their efficiency. The results indicate that the average profit efficiency of food SMEs is 49.37%. The results also reveal that company size, export orientation, government assistance and labour productivity are all positively related to the efficiency of food SMEs; age, however, is negatively related. Finally, the strategic implications of these findings are discussed.
The role of small and medium-sized enterprises1 (SMEs) in global economic and social development has been increasingly recognized in the literature (Doern, 2009; Harvie, 2007; Hussain et al., 2009). The importance of this type of enterprise is not that it is unique to a given country or region but rather that at the international level, this represents the most common business structure and contributes the most to economic growth. In fact, SMEs play a key role in the socio-economic development of both developed and developing countries, in terms of not only contribution to GDP but also employment generation and growth (Assefa, 1997; Hallberg, 1999). Thus, SMEs currently dominate the business landscape, representing 95% of companies worldwide and 60% of private sector employment. Compared to large companies, SMEs adapt better to changes in the market and new customer needs, and their organizational structure allows for faster decision making. Additionally, these companies are highly flexible, allowing them to better adapt to technological changes and promote better income distribution than large companies.
In the case of Spain, SMEs represent 99% of all companies and generate approximately 66% of jobs (DGI and PYME, 2015). These data show the importance of SMEs to accelerating growth and creating the employment necessary to relaunch the economy in Spain. Given this crucial importance of SMEs, along with the increased competition caused by the fall of trade barriers and the strong development of information technologies, it is necessary to analyse both the performance of SMEs and the factors that affect their performance. Measuring the efficiency of these firms is essential for this analysis. An efficiency estimate allows companies to know their effectiveness in achieving their objectives and managing their resources. For these reasons, analysing the efficiency of SMEs in Spain is especially important.
The literature addressing the efficiency of SMEs is extensive (Balios et al., 2015; Barchue and Aikaeli, 2016; Battese et al., 2001; Charoenrat and Harvie, 2013, 2014; Coll-Serrano and Blasco-Blasco, 2011; Hill and Kalirajan, 1993; Kotey and O’Donnell, 2002; Lundvall and Battese, 2000; Mini and Rodriguez, 2000; Mohamad et al., 2010; Yang, 2006). However, all of these studies focus on estimating cost efficiency (cost minimization), which measures how close the costs of a company are to the costs of a best-practices company that produces the same output under the same conditions.
Although the concept of cost efficiency as a potential source of cost reduction is important, it has two significant limitations (Berger and Mester, 1997):
- 1
Cost efficiency evaluates the efficiency for a given output level, which usually does not correspond to the optimal scale of production. Therefore, it is possible for a company to be efficient in terms of costs for its current production scale but not for its optimal output level.
- 2
Cost efficiency does not capture possible differences in the output quality of companies. If there are differences in output quality between companies, and these differences are not taken into account, the costs of higher quality are erroneously regarded as inefficiency when, in reality, they are previously unmeasured differences driven by the quality of the output.
These limitations, combined with the interest of managers in both cost minimization and revenue maximization goals, make profit efficiency the concept that best combines these two important economic objectives; this concept measures the distance between the current profit of a company and its optimal profit frontier. The concept of profit efficiency is better than that of cost efficiency for evaluating overall company performance because it collects errors from both outputs and inputs (Berger and Mester, 1997). More specifically, profit efficiency can be considered to be overall efficiency, such that if a company is efficient in terms of its profits, it will also be efficient in terms of its costs and its scale of production (Fitzpatrick and McQuinn, 2008).
Therefore, estimating profit efficiency is far more important for SME managers than the partial view provided by an analysis of cost efficiency (Maudos et al., 2002). In fact, there is empirical evidence in some industries demonstrating that the levels of profit inefficiency are much higher than the levels of cost inefficiency (Arbelo-Pérez et al., 2017; Berger et al., 1993; Maudos and Pastor, 2003). These results emphasize the importance of inefficiencies on the revenues side from producing below the optimal output value. However, and despite the numerous studies regarding cost efficiency, the overall performance result of SMEs has yet to be investigated.
This paper provides an overview of the performance of food manufacturing industry SMEs in Spain during the period 2008–2015 and an analysis of the determinants of their inefficiency. The food industry2 is the main manufacturing industry in the European Union, where 95.4% of companies are SMEs with fewer than 50 employees (Food Drink Europe, 2017). In Spain, the food industry has been consolidated as the main economic driver, representing 21.7% of the entire industrial sector, 18.3% of employed persons and 15.5% of added value (INE, 2017). To analyse the performance of this industry, we estimate profit efficiency using a stochastic profit frontier. The advantage of the stochastic frontier methodology is that it enables us to separate the distance between the efficiency of a company and its optimal frontier into random errors and inefficiency.
SMEs are considered in different studies as a homogeneous group (Álvarez and Crespi, 2003; Coll-Serrano and Blasco-Blasco, 2011; Kotey and O’Donnell, 2002; Lundvall and Battese, 2000). However, SMEs are strongly influenced by the region in which they operate (Balios et al., 2015; Charoenrat and Harvie, 2013, 2014), and therefore, their efficiency level will be conditioned by the economic, social and demographic situation of the region in which their activity is developed. Following the model proposed by Battese and Coelli (1995), variables such as government assistance, export activity, size, labour productivity and age will be introduced as determinants of profit inefficiency to properly capture the different conditions existing in the environments of different regions. This approach isolates the heterogeneity of the sample by introducing individual and environmental factors that explain and affect the inefficiency of companies (Battaglia et al., 2010). The advantage of this model is that it simultaneously estimates the profits function and the inefficiency effects function.
This paper extends the existing literature with two major contributions: (1) it is the first study that evaluates the overall performance results of food manufacturing industry SMEs using the concept of profit efficiency, and (2) it is also the first study that analyses the determinants of profit inefficiency. The remainder of the study is structured as follows. In the next section, a literature review is performed; subsequently, the determinants of the efficiency of SMEs are discussed. The next section details the methodology and presents the empirical analysis. Finally, the implications and conclusions are reported.
Literature reviewFor decades, the analysis and measurement of efficiency has been a topic of great interest in the economic literature. Despite this, studies on profit efficiency in SMEs are scarce and mainly focused on the banking and agricultural sectors. The classical approach to measuring the performance of SMEs has usually used cost efficiency, ignoring the important role that income inefficiencies can have in performance. The literature studying cost efficiency in SMEs in this way is extensive (Álvarez and Crespi, 2003; Balios et al., 2015; Barchue and Aikaeli, 2016; Charoenrat and Harvie, 2014; Coll-Serrano and Blasco-Blasco, 2011; Kotey and O’Donnell, 2002; Le and Harvie, 2010; Lundvall and Battese, 2000; Radam et al., 2008; Yang, 2006). However, studies on profit efficiency in SMEs are scarce and limited to the scope of small banks (Akhigbe and McNulty, 2003, 2005; Berger et al., 2007; Cyree and Spurlin, 2005) and the agricultural and livestock sector (Bahta and Baker, 2015; Galawat and Yabe, 2012; Hyuha et al., 2007; Kolawole, 2006; Purwanto et al., 2014; Nganga et al., 2010; Ogunniyi, 2011). We do not know any study focused on profit efficiency for SMEs in the food industry.
Akhigbe and McNulty (2003) study the profit efficiency of small US banks for 1990, 1992, 1994 and 1996, differentiating between large banks, small banks within one MSA,3 and small banks not limited to one MSA. Assuming banks use the same technology, the results obtained in the period analysed show that small banks are more profit efficient than large banks. However, in a later work, these same authors compare the profit efficiency of small, medium and large banks for the period 1995–2001 and conclude that small banks (75%) are less profit efficient than medium banks (82%) and large banks (86%) (Akhigbe and McNulty, 2005). Cyree and Spurlin (2005) analyse the effects of competing with large banks on the profit efficiency of small banks that operate in rural markets. The results show that a small bank has low levels of profit efficiency when it competes with a single large bank. However, the profit efficiency of the small bank increases when it competes with several large banks in a rural market.
The results of the studies developed in the agricultural sector show diverse results. Kolawole (2006) examined the determinants of profit efficiency among small scale paddy rice farmers in Nigeria using a stochastic Cobb–Douglas profit frontier model. The results show that profit efficiency is 61% and is positively related to age, educational level, farming experiences and household size. Hyuha et al. (2007) carried out similar work in Uganda, highlighting that rice farmers do not operate on the profit frontier and that the main causes of this situation are low levels of education and limited access to extension services. The empirical results of the Galawat and Yabe (2012) study on rice production in Brunei Darussalam using a stochastic frontier approach shows that the average efficiency is 80.7%, so that 19.3% of profit is lost due to a combination of technical, allocative and scale inefficiencies.
Ogunniyi (2011), measures profit efficiency among 240 maize producers in Nigeria, showing that this efficiency varies between 1% and 99.9%, with an average of 41.4%. Additionally, the inefficiency model shows that education, experience, extension and non-farm employment were significant factors influencing profit efficiency. A study by Purwanto et al. (2014) on the efficiency of 31 small- and medium-sized tofu enterprises in Salatiga using data envelopment analysis shows that only two SMEs were overall efficient, four SMEs were efficient in scale and eight SMEs were technically efficient. The remaining 23 SMEs were inefficient. They also found that the determinants of inefficiency were soybean availability, production expenses, the width of the production area, and the number of employees.
Bahta and Baker (2015) find an average profit efficiency of 58% for a sample of 556 small livestock producers in Botswana. The research showed that the factors that influenced the high degree of inefficiency (42%) were education level, distance to the commonly used market, herd size, access to information and income from crop production. Finally, the results of a study by Nganga et al. (2010) using a stochastic profit frontier showed that the efficiency of profits of small milk producers in Kenya varied between 26% and 73%, with a mean of 60%. This study further observed that the level of education, experience, and size of the farm influenced profit efficiency positively, while profit efficiency decreased with age of the farm.
This paper seeks to extend the empirical evidence regarding study of the profit efficiency of SMEs in the food manufacturing industry and, more specifically, to draw the attention of other researchers to the importance of profit efficiency when assessing the overall performance results of SMEs.
Determinants of efficiency in SMEsTo formulate and implement business strategies that enable SMEs to improve their competitiveness, it is important to identify which factors affect the results of SMEs and how they do so (Lovell, 1993). Studies investigating the factors that affect the inefficiency of SMEs are numerous. Pitt and Lee (1981) pioneered the research on this topic with an empirical study in which they analysed how size, age and facilities affect cost efficiency in manufacturing SMEs. Subsequently, other authors also studied how the cost efficiency of SMEs is affected by other factors, such as employee qualifications, owner experience, location, type of company, female participation in the workforce, capital-labour ratio, foreign investment, export activity and government support, among others (Álvarez and Crespi, 2003; Balios et al., 2015; Barchue and Aikaeli, 2016; Charoenrat and Harvie, 2013, 2014; Charoenrat et al., 2013; Kotey and O’Donnell, 2002). However, there is no unanimous agreement in the literature about the impact of these factors on cost efficiency in SMEs, and we are not aware of any study regarding the determinants of profit efficiency. The following is a more detailed explanation of the variables considered to be determinants of profit efficiency.
Firm sizeThe impact of company size on efficiency has been widely discussed in the literature, and for the most part, the idea that larger firms are more efficient than smaller businesses is endorsed (Lundvall and Battese, 2000; Mini and Rodriguez, 2000; Pitt and Lee, 1981). The main argument behind this idea is that in a competitive market, the most efficient companies survive and grow, whereas inefficient companies stagnate or exit the industry (Jovanovic, 1982). However, smaller firms are more flexible, have non-hierarchical structures and do not suffer from agency problems owing precisely to their smaller size (Yang and Chen, 2009); although some authors do point out that there may be SMEs that employ non-family managers, and therefore, agency issues may also occur in these firms (e.g., Hiebl, 2017; Klein and Bell, 2007; Tabor et al., 2018). These differences could more than offset their size disadvantage and make them more technically efficient than larger companies (Álvarez and Crespi, 2003; Charoenrat and Harvie, 2014; Le and Harvie, 2010).
Firm ageThe age and efficiency of a company are expected to be positively correlated. First, in competitive markets, the oldest organizations will be the most efficient because market inertia will expel inefficient companies (Lundvall and Battese, 2000). Second, older companies will also be the most experienced in terms of their production and commercial processes and therefore more efficient (Hill and Kalirajan, 1993; Jovanovic, 1982). Finally, age can also be a significant factor because younger companies have more problems accessing credit. The rationale underlying this idea is that the risk of any loan varies with the duration of the relationship between the company and the financial institution (Diamond, 1991).
Alternatively, a negative relationship between age and efficiency is also possible because young companies have more modern infrastructure and the most advanced technologies (Pitt and Lee, 1981). The benefit of the accumulated knowledge in a company due to its greater age cannot be compensated by the higher costs of outdated physical and technological infrastructure (Batra and Tan, 2003). Likewise, it is also possible that older SMEs exhibit lower efficiency, since they may suffer greater risk aversion and, therefore, show a lower capacity for innovation, which in turn reduces profitability (Hiebl, 2014, 2015).
Labour productivityIt is important to consider the relationship between labour productivity and efficiency because it is a relatively direct relationship (Datta et al., 2005) and because many companies’ competitive advantages derive directly or indirectly from human resources (Pfeffer, 1994, 1998). There seems to be widespread agreement in the economic literature regarding the positive effect from worker training and skills on the efficiency of companies (Charoenrat and Harvie, 2013, 2014). Greater employee skills and knowledge facilitate the introduction and use of new technologies, stimulate innovation, and increase the efficient use of resources (Malerba, 1992).
The qualifications and skills of employees also have a positive effect on the provision of a company’s goods and services and therefore on the image perceived by its customers. This situation typically both increases the loyalty of existing customers and attracts new customers, with the consequent effect on revenue. However, SMEs have significant limitations on investing in training mainly due to a lack of economic resources (Cohen, 1998).
Government assistanceThe development of efficient and competitive SMEs is hindered by SMEs’ difficulty accessing financial resources (Beck et al., 2005). The literature indicates that the structure and costs of financing affect the competitiveness of companies, and difficulties in accessing finance restrict the potential of SMEs to execute projects related to technological innovation and internationalization to improve their efficiency. For this reason, SMEs have greater debt than larger companies (Hamilton and Fox, 1998), in addition to higher financing costs and more restricted access to funding (Peel and Wilson, 1996; Segura and Toledo, 2003). As a result, gaining greater access to credit could have a positive impact on efficiency among SMEs (Barchue and Aikaeli, 2016; Hussain et al., 2009).
Governments of various countries are developing actions to facilitate financing for SMEs as a strategy to enhance their competitiveness, innovation and socio-economic development. These strategies are justified by the difficulties SMEs experience in accessing funding and their importance to economic growth and job creation. Government assistance can be provided as financial support (for example, credit assistance, income tax exemptions or reductions or exemptions from import duties on essential raw materials) or non-financial support (for example, managerial and technical assistance) (Charoenrat et al., 2013).
Export firmsThe literature has thoroughly addressed the influence of export activity on the performance of SMEs (Arnold and Hussinger, 2005; Wagner, 2007). However, there is no unanimous agreement about whether the most efficient companies are more likely to become exporters or whether exports make companies more efficient. These two scenarios are not mutually exclusive, but from a public policy perspective, it is important to know whether one or both of these situations can actually occur.
Clerides et al. (1998) claim that exports do not cause companies to be more efficient, but rather, the most efficient companies choose to operate in international markets because yields are higher. However, Love and Roper (2015) note that the management skills necessary to penetrate export markets could be different from those required to succeed in local markets. By contrast, Álvarez and Robertson (2004), Salomon and Shaver (2005) and Golovko and Valentini (2011) claim that exports have a positive impact on efficiency because companies that export benefit from access to new information sources and knowledge that are sometimes not available in the local market, and they can utilize this acquired knowledge to be more efficient.
MethodologyThis paper uses stochastic frontier analysis to estimate the efficiency of SMEs and its determinants. The main feature of stochastic frontier analysis is that it assumes that the error term is compound, formed by the inefficiency and a random error. Thus, a company can deviate from its optimal profit frontier owing to both inefficiency itself and possible completely random fluctuations. These fluctuations include the effect of those variables that are not under corporate control.
To measure the profit efficiency of food manufacturing SMEs in Spain, the frontier alternative profit function specified by Berger and Mester (1997) and Humphrey and Pulley (1997) is used. This function takes profits as the dependent variable and the amount of outputs and price of inputs as independent variables, considering that outputs remain constant, whereas input price varies freely and affects profit. The alternative profit function can be expressed as
where πit is the profit of SME i in period t, f represents the functional form chosen, yit represents the outputs vector, wit is the price vector of the inputs ,vit is the random error, and uit is an inefficiency term. To facilitate the inefficiency estimate, it is assumed that the random error and inefficiency, v and u, are separable from the rest of the profit function.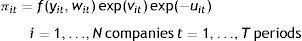
The model proposed by Battese and Coelli (1992) introduces the idea that efficiency varies between companies and over time; if this is true, then it is logical to ask about the factors that determine the variation in efficiency. Battese and Coelli (1995) extend the stochastic frontier model and suggest that the determinants of inefficiency can be expressed as a linear function of a set of explanatory variables that reflect the characteristics inherent to a company. The advantage of the Battese and Coelli model (1995) is that it allows estimating the efficiency of each company and the factors that explain the differences in efficiency between companies in a single-stage procedure. This single-stage procedure represents a significant improvement over the widely used two-stage approach (Battese and Coelli, 1995; Kumbhakar et al., 1991; Wang and Schmidt, 2002).
According to Battese and Coelli (1995), the model assumes that random errors vit are random variables that are i.i.d. N(0, σv2 ) and independent from uit. Likewise, uit are considered as non-negative random variables, i.i.d. N(μ,σu2) and zero-truncated, where uit=δZit+εit, whereas Zit is a vector of variables that can affect the inefficiency of companies and may even contain the time effect, δ is a vector of parameters to be estimated, and εit is a random variable defined as a truncated N(0,σ2) such that uit is defined as positive.4 In addition, we will use the parameterization proposed by Battese and Corra (1977), in which σv2 and σu2 are replaced by σ2=σv2+σu2 and γ=σu2/(σv2+σu2), respectively.
The translog function is the functional form that is normally used in studies of efficiency, and in the case of the alternative profit frontier function, it can be expressed as
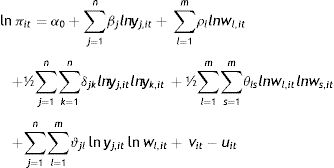
However, there is an issue with the profit function when the translog functional form is used because the dependent variable (profits) can take negative values, and the result might be indefinite when the logarithm is applied. Bos and Koetter (2011) propose a solution that consists of creating an additional independent variable, called the negative profit indicator (NPI), that takes a value of 1 for those companies with positive profits (π > 0) and is equal to the absolute value of the profit when companies incur losses (π < 0). Simultaneously, the dependent variable (π) takes a value of 1 when profits are negative and the corresponding value when profits are positive. Consequently, companies with both profits and losses are included in the analysis, which causes an increase in the stability of the ranking of the efficiency measure and improves the discriminatory power of the translog profit function (Bos and Koetter, 2011).5 This study uses the procedure proposed by these authors.
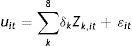
Finally, for the case of two and four inputs and by imposing the conditions of linear homogeneity in prices, ∑sβs=1and∑srβs,r=∑jsρj,s=0,and symmetry, αj,k=αk,j∀k,jandβs,r=βs,r∀s,r, the translog profit function can be expressed as
and the inefficiency effects function with eight variables iswhere Zk,it represents the ith explanatory variable for the inefficiency of SMEs, δ is the vector of parameters to be estimated, and εit is the random error of the model. Finally, the model can be estimated using maximum likelihood techniques.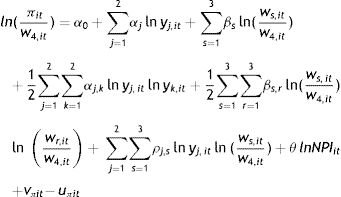
The profit efficiency (PE) is estimated as the ratio of the actual profit of the ith SME (πit) and the highest profit it could achieve (πmax), specifically,
Empirical analysisData and selection of variables
The data sample of this study was taken from the Iberian Balance Sheet Analysis System (SABI) database.6 The companies selected are from group 10, food manufacturing industry, of the National Classification of Economic Activities (CNAE-2009). In accordance with the requirements specified in the introduction for the definition of a company as an SME, we excluded those companies that (1) had 250 or more employees, (2) had turnover greater than 50 million euros, or (3) had total assets of more than 43 million euros. Additionally, companies that did not have data available for any one of the selected years were discarded. The final sample consists of balanced data from 599 SMEs in the food industry for the period of 2008–2015 (a total of 4792 observations).
The variables were selected based on the information available and the current literature. First, the output variables should reflect the results achieved by each company (Purwanto et al., 2014). Therefore, two output variables were selected: (1) net sales (y1), which includes the net revenue from the sale of the company’s core products, and (2) other operating revenue (y2), which represents the net revenue from other activities related to company operations. Several previous studies have used these variables as good indicators of the output obtained to estimate the efficiency of manufacturing SMEs (e.g., Álvarez and Crespi, 2003; Coll-Serrano and Blasco-Blasco, 2011; Le and Harvie, 2010).
Second, the input variables are the resources necessary to execute the production activity of the company. Because the prices of the inputs are not directly observable, these are estimated using the following proxy variables (Kotey and O’Donnell, 2002):
- (1)
Price of labour (w1): calculated as the ratio between total labour costs and the number of full-time annual equivalent employees;
- (2)
Price of materials (w2): the ratio between materials cost and operating revenue (Arbelo et al., 2018a; Assaf and Cvelbar, 2011; Chen, 2007);
- (3)
Price of other operating costs (w3): the ratio between other operating costs and operating revenue (Arbelo et al., 2018b; Hu et al., 2010);
- (4)
Price of capital (w4): the ratio between the depreciation of both tangible and intangible assets and total fixed assets (Assaf and Cvelbar, 2011; Pérez-Rodríguez and Acosta-González, 2007).
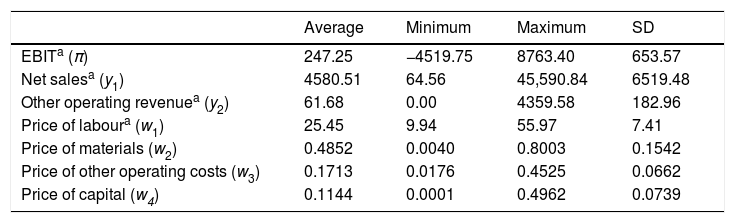
The dependent variable of the stochastic profit frontier (π) is defined as earnings before interest and taxes (EBIT). All monetary variables are deflated using the food industry price index, calculated as 2011 = 100. Table 1 presents descriptive statistics for the output and the price of the input variables for the whole period.
Descriptive statistics for the period 2008–2015.
| Average | Minimum | Maximum | SD | |
|---|---|---|---|---|
| EBITa (π) | 247.25 | −4519.75 | 8763.40 | 653.57 |
| Net salesa (y1) | 4580.51 | 64.56 | 45,590.84 | 6519.48 |
| Other operating revenuea (y2) | 61.68 | 0.00 | 4359.58 | 182.96 |
| Price of laboura (w1) | 25.45 | 9.94 | 55.97 | 7.41 |
| Price of materials (w2) | 0.4852 | 0.0040 | 0.8003 | 0.1542 |
| Price of other operating costs (w3) | 0.1713 | 0.0176 | 0.4525 | 0.0662 |
| Price of capital (w4) | 0.1144 | 0.0001 | 0.4962 | 0.0739 |
The following explanatory variables were specified to analyse the determinants of profit efficiency:
- (1)
Firm age (Z1): firm age represents the number of years that the company has been operating in the market. It is measured as the difference between the opening year of the company and the year 2011.
- (2)
Labour productivity (Z2): the labour productivity variable is calculated as the ratio between total revenue and labour costs.
- (3)
Export firm (Z3): the exportfirm variable captures whether the company engages in export activities. The value of this dummy variable is 1 if the company exports and 0 otherwise.
- (4)
Government assistance (Z4): the value of the government assistance variable is 1 if the company receives any type of government assistance and 0 otherwise.
- (5)
Small (Z5): the small variable captures those companies considered to be small within the SME sector. This dummy variable takes the value 1 if the company has between 10 and 49 workers, net sales between 2 and 10 million euros and total assets between 2 and 10 million euros; it takes the value 0 otherwise.
- (6)
Medium (Z6): the medium variable captures those companies considered to be medium sized within the SME sector. This dummy variable takes the value 1 if the company has between 50 and 249 workers, net sales between 10 and 50 million euros and total assets between 10 and 43 million euros; it takes the value 0 otherwise.
- (7)
Trend (Z7): the trend variable measures whether inefficiency remains constant or varies throughout the period analysed. The variable is equal to 1 in the year 2008, 2 in 2009, …, up to 8 in 2015.
- (8)
Trend2 (Z8): the squared trend variable is the square value of the trend, adopted to evaluate if the rate of increasing inefficiency is positive or negative.
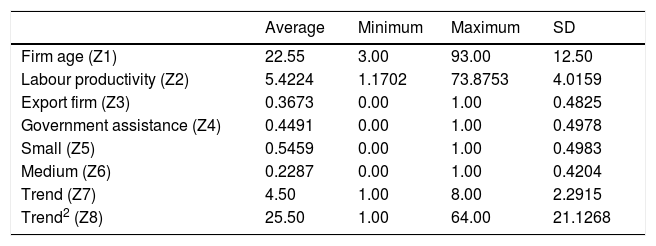
Table 2 presents descriptive statistics regarding the explanatory variables of the profit inefficiency of SMEs.
Descriptive statistics regarding the determinant factors of inefficiency.
| Average | Minimum | Maximum | SD | |
|---|---|---|---|---|
| Firm age (Z1) | 22.55 | 3.00 | 93.00 | 12.50 |
| Labour productivity (Z2) | 5.4224 | 1.1702 | 73.8753 | 4.0159 |
| Export firm (Z3) | 0.3673 | 0.00 | 1.00 | 0.4825 |
| Government assistance (Z4) | 0.4491 | 0.00 | 1.00 | 0.4978 |
| Small (Z5) | 0.5459 | 0.00 | 1.00 | 0.4983 |
| Medium (Z6) | 0.2287 | 0.00 | 1.00 | 0.4204 |
| Trend (Z7) | 4.50 | 1.00 | 8.00 | 2.2915 |
| Trend2 (Z8) | 25.50 | 1.00 | 64.00 | 21.1268 |
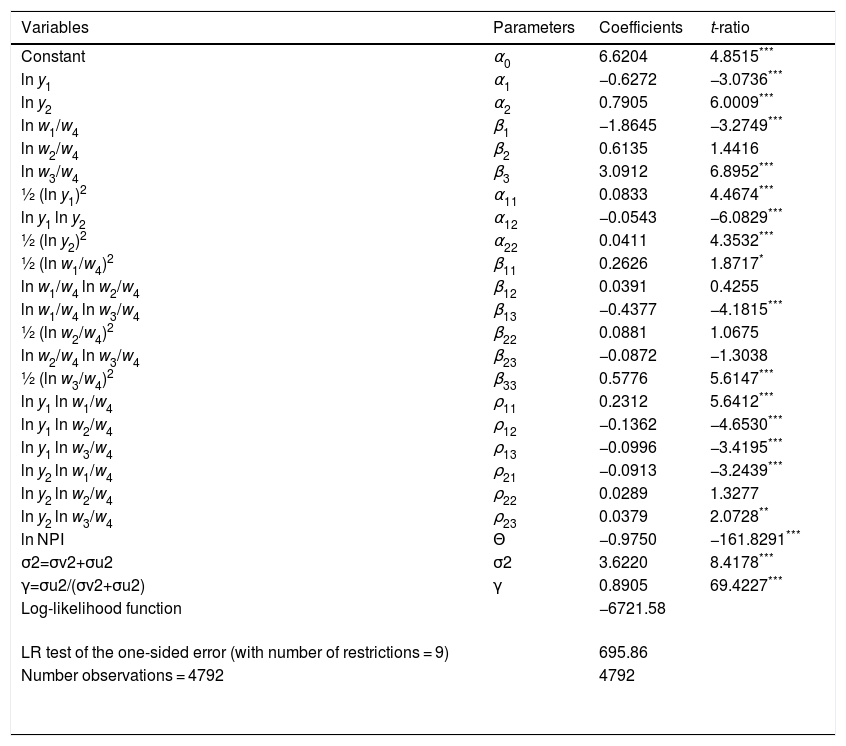
This section presents the results of the estimation of the stochastic profit frontier using the FRONTIER 4.1 software package (Coelli, 1996). For ease of presentation, the estimates of the frontier parameters and the determinants of inefficiency are reported separately. The results of the estimate of the translog profit frontier7 demonstrate that the selection of variables is correct and that the fit between the model and the data is good (Table 3). Of the 21 parameters that comprise the stochastic profit frontier, 16 are statistically significant. In addition, the value of sigma-squared (σ2) is significant at the 1% level, which indicates that the estimate of the parameters is highly significant. The estimated value of parameter γ, which represents the ratio of the variance in the inefficiency and the variance in the composite error, is 0.8905 and statistically significant; this demonstrates that most of the distance between companies and their optimal profit frontier is due to inefficiency and only a small part is due to random errors. This result is confirmed by the likelihood ratio (LR) test statistic.8 This test is based on the null hypothesis that all parameters of the inefficiency function are equal to 0; therefore, inefficiency is absent in the model (i.e., H0: γ = δ = δ1 = … = δ7 = 0). The LR test of the one-sided error is equal to 695.86, and therefore the null hypothesis is rejected at the 1% level of significance. Thus, it is confirmed that the existence of inefficiencies explains a significant part of the variability in profits among SMEs.
Maximum-likelihood estimates of profit frontier function.
| Variables | Parameters | Coefficients | t-ratio |
|---|---|---|---|
| Constant | α0 | 6.6204 | 4.8515*** |
| ln y1 | α1 | −0.6272 | −3.0736*** |
| ln y2 | α2 | 0.7905 | 6.0009*** |
| ln w1/w4 | β1 | −1.8645 | −3.2749*** |
| ln w2/w4 | β2 | 0.6135 | 1.4416 |
| ln w3/w4 | β3 | 3.0912 | 6.8952*** |
| ½ (ln y1)2 | α11 | 0.0833 | 4.4674*** |
| ln y1 ln y2 | α12 | −0.0543 | −6.0829*** |
| ½ (ln y2)2 | α22 | 0.0411 | 4.3532*** |
| ½ (ln w1/w4)2 | β11 | 0.2626 | 1.8717* |
| ln w1/w4 ln w2/w4 | β12 | 0.0391 | 0.4255 |
| ln w1/w4 ln w3/w4 | β13 | −0.4377 | −4.1815*** |
| ½ (ln w2/w4)2 | β22 | 0.0881 | 1.0675 |
| ln w2/w4 ln w3/w4 | β23 | −0.0872 | −1.3038 |
| ½ (ln w3/w4)2 | β33 | 0.5776 | 5.6147*** |
| ln y1 ln w1/w4 | ρ11 | 0.2312 | 5.6412*** |
| ln y1 ln w2/w4 | ρ12 | −0.1362 | −4.6530*** |
| ln y1 ln w3/w4 | ρ13 | −0.0996 | −3.4195*** |
| ln y2 ln w1/w4 | ρ21 | −0.0913 | −3.2439*** |
| ln y2 ln w2/w4 | ρ22 | 0.0289 | 1.3277 |
| ln y2 ln w3/w4 | ρ23 | 0.0379 | 2.0728** |
| ln NPI | Θ | −0.9750 | −161.8291*** |
| σ2=σv2+σu2 | σ2 | 3.6220 | 8.4178*** |
| γ=σu2/(σv2+σu2) | γ | 0.8905 | 69.4227*** |
| Log-likelihood function | −6721.58 | ||
| LR test of the one-sided error (with number of restrictions = 9) | 695.86 | ||
| Number observations = 4792 | 4792 |
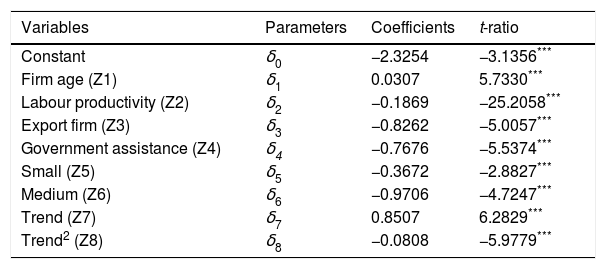
Table 4 presents estimates of the determinant factors of the inefficiency function. Note that all variables are statistically significant at the 1% level. Therefore, all of the selected inefficiency determinants have a significant impact on the SMEs’ level of profit efficiency.
Maximum likelihood estimates of profit inefficiency function.
| Variables | Parameters | Coefficients | t-ratio |
|---|---|---|---|
| Constant | δ0 | −2.3254 | −3.1356*** |
| Firm age (Z1) | δ1 | 0.0307 | 5.7330*** |
| Labour productivity (Z2) | δ2 | −0.1869 | −25.2058*** |
| Export firm (Z3) | δ3 | −0.8262 | −5.0057*** |
| Government assistance (Z4) | δ4 | −0.7676 | −5.5374*** |
| Small (Z5) | δ5 | −0.3672 | −2.8827*** |
| Medium (Z6) | δ6 | −0.9706 | −4.7247*** |
| Trend (Z7) | δ7 | 0.8507 | 6.2829*** |
| Trend2 (Z8) | δ8 | −0.0808 | −5.9779*** |
Regarding the first factor (Z1), we found a positive relationship between the age and the inefficiency of the SMEs, namely, the older the company is, the greater its profit inefficiency. Although the results of some previous empirical studies show that age has a positive effect on cost efficiency due to accumulated experience and knowledge (Álvarez and Crespi, 2003; Amornkitvikai and Harvie, 2011; Charoenrat and Harvie, 2014; Yang and Chen, 2009), the result when we estimate the profit efficiency is completely to the contrary. A possible explanation for this finding is that whereas the lower levels of experience and knowledge of younger companies can increase their inefficiency costs, these companies have more modern infrastructure and technology, which can more than offset the lower cost efficiency by increasing the revenue derived from both the product manufacturing process and its marketing.
The estimate of the coefficient of the labour productivity variable (Z2) is negative, as expected, suggesting that the profit inefficiency of SMEs decreases as labour productivity improves. The sign of the coefficient of variable Z3 is also negative. This result shows that exporting SMEs tend to be more profit efficient than non-exporting companies. The estimated coefficient of variable Z4 is also negative, revealing that government support of SMEs has a positive effect on their profit efficiency. The negative sign of the variables Z5 and Z6 reveals that the size of SMEs also has a positive impact on their profit efficiency: small and medium-sized firms are more efficient than micro-enterprises. Additionally, the difference in the estimated coefficients of variables Z5 and Z6 is negative, which demonstrates that medium-sized companies are more profit efficient than small companies.
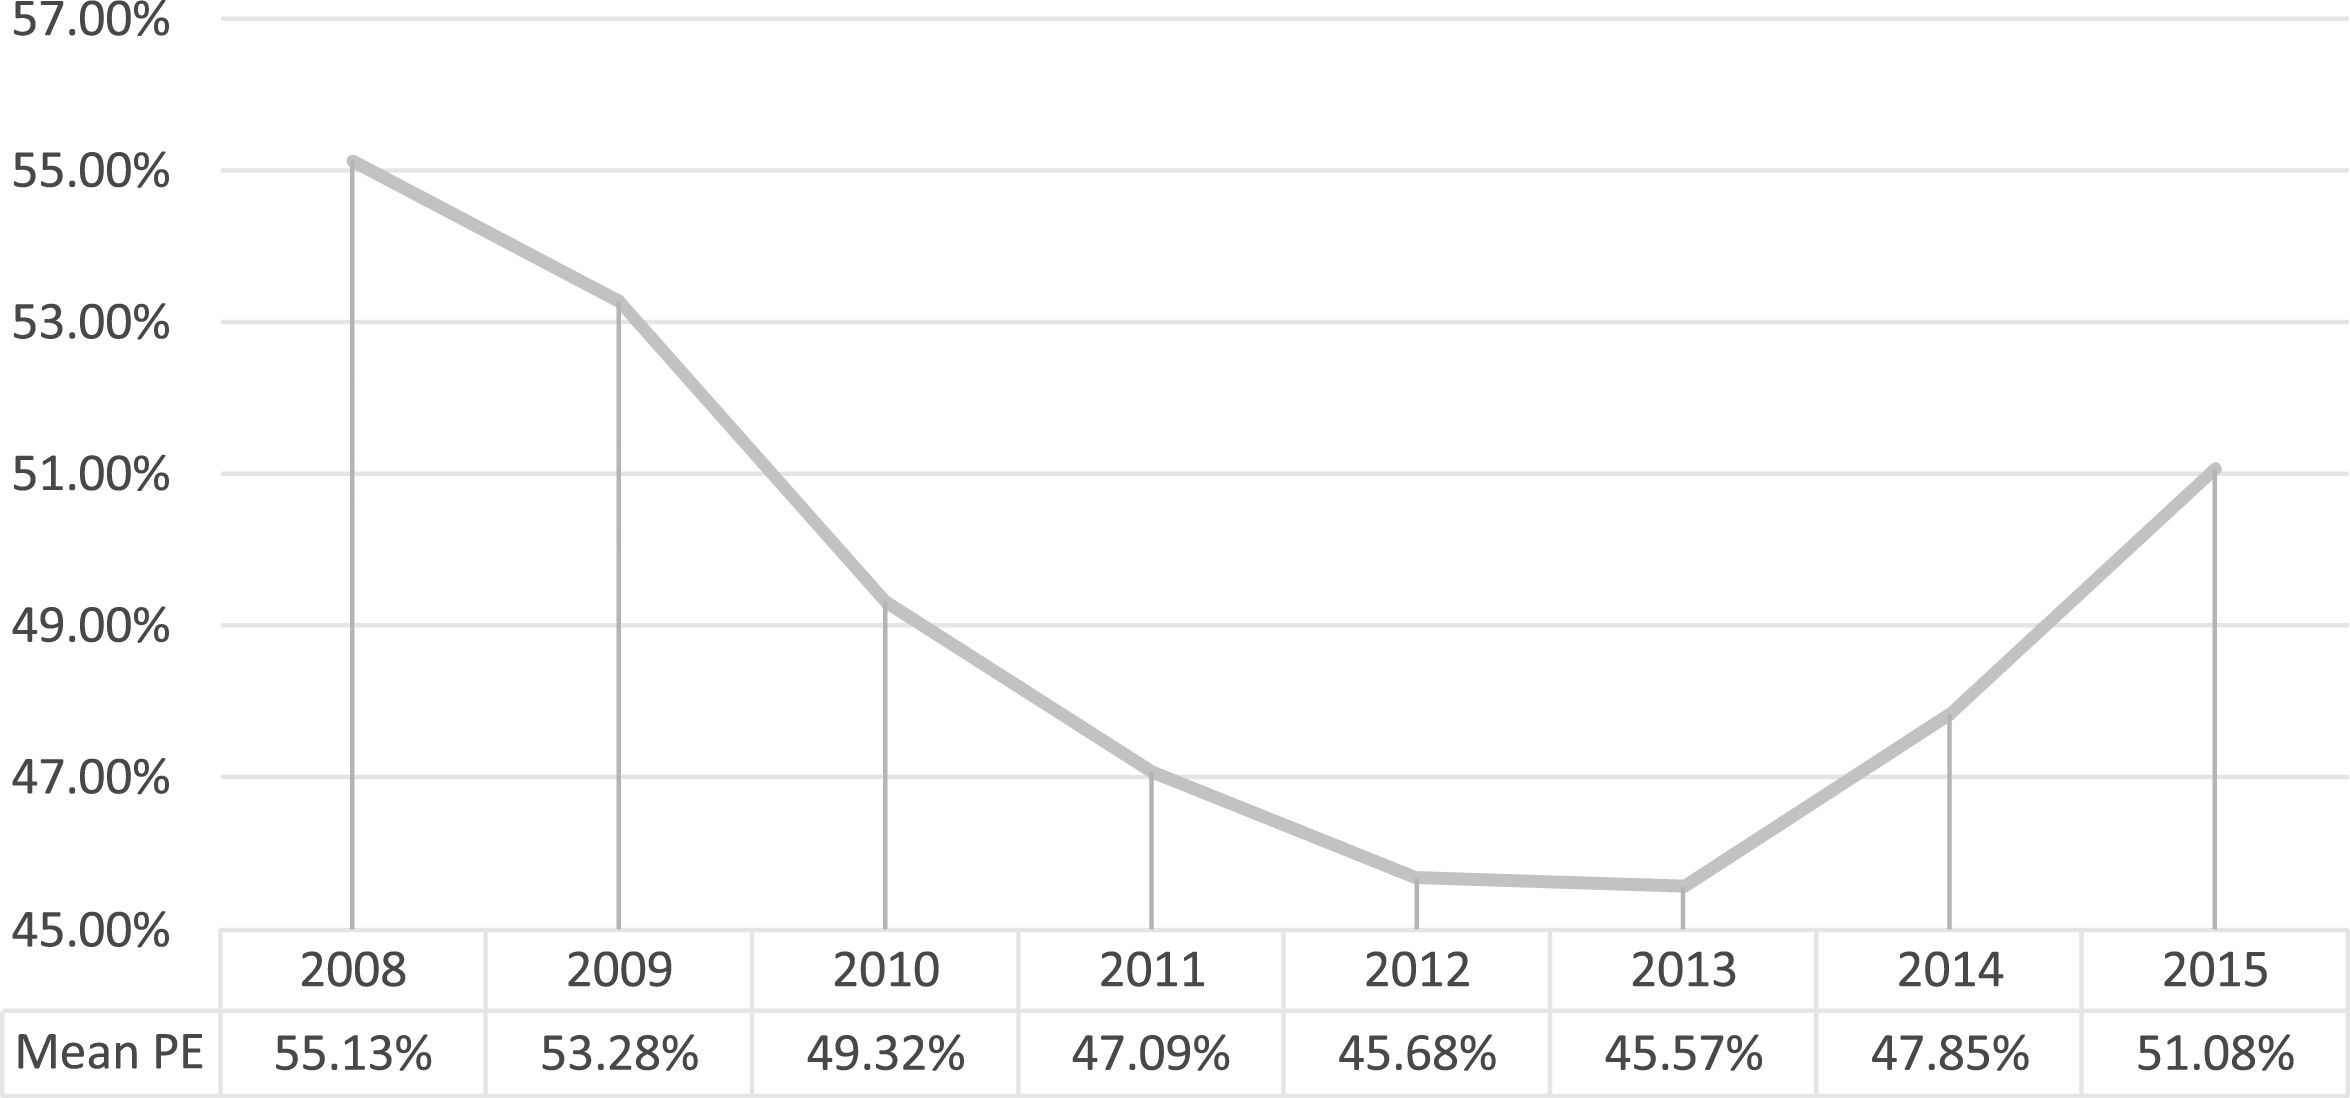
Finally, the coefficient of the trend variable (Z7) is significant and positive, which indicates that the profit efficiency of SMEs worsened during the study period. This result reveals the negative impact of the economic and financial crisis on the performance of these companies. However, the coefficient of the variable squared trend (Z8) is negative and significant, and thus, the inefficiency increases during the years analysed, but at decreasing rates. By way of illustration, Fig. 1 shows the evolution of the average profit efficiencies from 2008 to 2015. It can be observed that in the first years, efficiency has a clear downward trend, from 53.99% in 2008 to 46.56% in 2013, which coincides with the worst years of the economic crisis. Starting in 2013, the first signs of improvement in the level of efficiency can be observed, and it reaches 50.23% in 2015.
.")
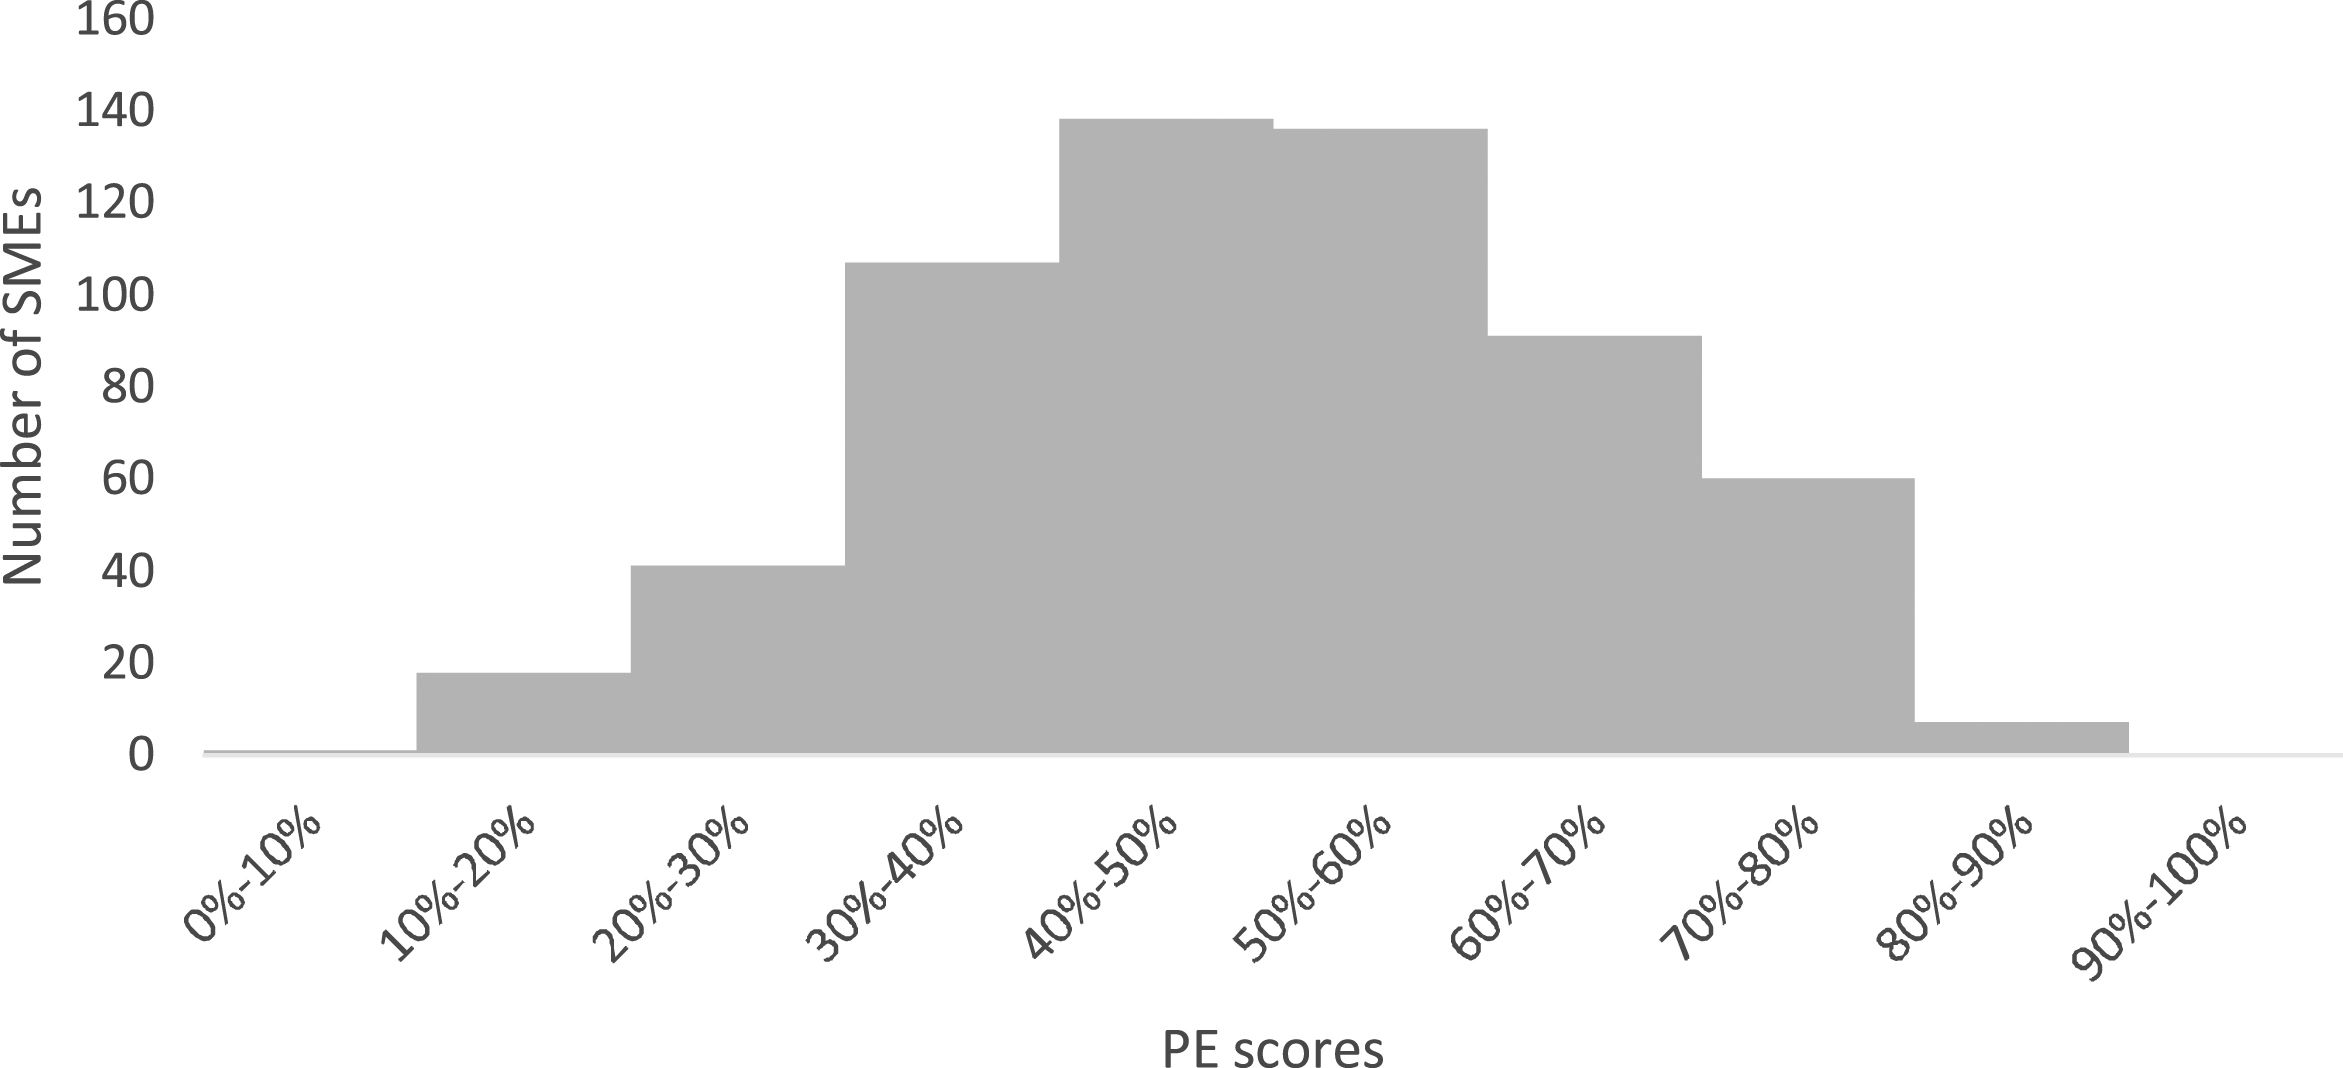
The average profit efficiency during the period of 2008–2015 was 49.37%. This means that, on average, SMEs are wasting 50.63% of their potential profit and that for an average EBIT of 247.25 thousand euros (see Table 2), the sample companies are losing approximately 250 thousand euros.9 The efficiencies of profits also exhibit high dispersion (Fig. 2), with a standard deviation of 0.2081. The efficiencies obtained for each company in the sample range from 4.40% to 87.17%. Considerable variability among profit efficiency levels has also been found in other sectors by Berger and Mester (1997), Rahman (2003), Fitzpatrick and McQuinn (2008), Aiello and Bonanno (2013), and Arbelo-Pérez et al. (2017).

Although it is not a subject of this study, the average efficiency of costs for the companies in the sample was estimated following the same methodology used to calculate the profit efficiency. The average efficiency of costs obtained for the years of 2008–2015 is 80.59%, which reveals that profit inefficiency is considerably greater than cost inefficiency. This result reveals the importance of inefficiencies on the revenue side.
Discussion and concluding remarksSMEs play a crucial role in global economic and social development. The recent economic crisis, coupled with the collapse of trade barriers and the strong development of information technologies, means that these companies operate in increasingly competitive markets. This shift is negatively affecting not only SMEs’ performance but also their survival. Under these circumstances, the study of SMEs’ resources can play a decisive role in helping them achieve the economic objective of profit maximization. Measurement of the efficiency of these companies is essential for this analysis.
Profit maximization requires not only producing goods and services at the lowest cost but also maximizing revenue. The concept that best includes these two important economic goals of a company is profit efficiency. This paper used a stochastic profit frontier function and the inefficiency effects function to estimate the profit efficiency and its determinants for 599 SMEs in Spain during the period of 2008–2015, using a single-stage procedure following Battese and Coelli (1995).
Assuming that all companies use the same production technology, we found that during the period analysed, SMEs’ average profit efficiency ranges between 45.57% and 55.13%, with an average of 49.37%. This means that on average, SMEs are wasting 50.63% of their potential profit. Profit efficiency is characterized as time-varying; it progressively dropped from 2008 until 2013 because of the decrease in the marginal revenue due to the economic crisis, but it recovered in the following two years, consistent with the improvement in the economy.
The results also identify five variables that affect the profit inefficiency of SMEs. First, there is a positive relationship between labour productivity and profit efficiency. This result reveals the importance of training for employees. In this regard, Porter (1987) notes that the acquisition of skills and the training of human resources can represent a source of competitive advantage for the company by enabling employees to be more efficient in the performance of the tasks required in the manufacturing process and the marketing of products. The education and training of workers increases the innovativeness of processes and aids with the incorporation of new technologies, which not only achieves a more effective and efficient use of company resources (Charoenrat and Harvie, 2014) but also enables an increase in revenue as the result of marketing goods and/or services that are more consistent with the expectations of customers.
Second, profit efficiency improves with increasing SME size. This result is similar to those obtained in other studies, which find a positive relationship between the size and efficiency of SMEs (Balios et al., 2015; Charoenrat et al., 2013; Haddad and Harrison, 1993; Le and Harvie, 2010; Lundvall and Battese, 2000; Margono and Sharma, 2006; Mengistae, 1996; Mini and Rodriguez, 2000; Pitt and Lee, 1981; Yang, 2006). This demonstrates that larger SMEs are able to take advantage of economies of scale to a greater extent and have better opportunities to access information and technological resources.
Third, the export activity of SMEs is positively related to profit efficiency. A possible explanation for this result is that international markets are more competitive than local markets, and due to this greater competitive pressure, exporting companies are forced to control their costs and to offer more innovative products with higher quality and added value. This process is most likely a result of the knowledge acquired in these international markets, which allows firms to manufacture and market a greater quantity and range of products that incorporate more and higher-quality innovation (Álvarez and Robertson, 2004; Golovko and Valentini, 2011; Salomon and Shaver, 2005), leading to higher revenues that more than offset the implicit costs of operating in international markets and therefore have a positive effect on the profit efficiency of these companies.
Fourth, public aid to SMEs improves their profit efficiency. This result is consistent with those obtained in other empirical studies (Charoenrat et al., 2013). These authors find that facilitating access to financing sources allows SMEs to access more advanced technological resources and more qualified human resources, which, combined with managerial and technical assistance, has a positive effect on their efficiency (Barchue and Aikaeli, 2016; Hussain et al., 2009).
Fifth, the years of activity of SMEs are negatively related to the profit efficiency. Hill and Kalirajan (1993) and Batra and Tan (2003) state that despite older companies’ experience, the presence of older equipment and technology becomes a clear disadvantage relative to younger companies that have better and more modern facilities. These authors note that this result does not mean that the ``learning by doing’’ process is not important but rather that young companies benefit more from their more advanced technologies than from "learning by doing" (Amornkitvikai et al., 2014). The above, combined with the fact that younger companies enter the market with more innovative projects, makes these companies better suited to the demands of an increasingly trained and informed customer, thus enabling higher levels of profit efficiency through lower costs and/or higher revenue (Le and Harvie, 2010).
These conclusions have important implications for both policymakers and the managers of SMEs. A positive relationship between labour productivity and the efficiency of SMEs should be an incentive to implement policies aimed at improving employee training and qualification, optimizing internal organization in a way that stimulates and motivates workers, and raising the stock of capital per employee. Public authorities should also encourage concentration among smaller companies to help them gain size and thus improve their levels of efficiency. The positive relationship between export capacity and efficiency reveals the importance of the internationalization process of SMEs. This is a process that is closely linked to the incorporation of knowledge and improvement of management, and it increases the competitive levels of these companies. In addition, the inherent challenges faced by SMEs mean that these companies need public aid to access funding sources, technological advances and internationalization, especially in the early stages of their activity. Finally, the management of SMEs should design strategies aimed at improving revenue management, increasing the value of their products and making the rigidities and routines acquired over the years more flexible, thus reducing their level of profit inefficiency. All this will have a positive impact on the performance and competitiveness of SMEs.
The limitations of this study are mostly related to the database used. Having more disaggregated data would allow estimating the outputs as stock variables and not as flow variables. The cost information used in this study is also an important limitation, since many SMEs have less developed management accounting and control systems compared to larger firms (Lavia López and Hiebl, 2015). In addition, it would be of great interest to validate the results of this study in other countries. Despite these limitations, we believe that they have not significantly diminished the importance of the conclusions of the study.
SMEs are defined as those companies that meet the following requirements: average total assets of less than 43 million euros, turnover of less than 50 million euros and fewer than 250 employees.
The food industry is responsible for preparing, transforming, preserving and packaging products from the agricultural and livestock sector.
MSA: metropolitan statistical area.
The log-likelihood function of this model is given in Battese and Coelli (1993).
This methodology has been used by authors such as Hasan et al. (2009), Tabak et al. (2013) and Bian et al. (2015).
The SABI database is generated by the private firm Informa and has financial information for more than 3.2 million Spanish and Portuguese companies that present their accounts in commercial registers.
The Cobb–Douglas specification is an alternative to the translog functional form. To verify the suitability of the translog functional form compared to that of Cobb–Douglas, we computed the likelihood ratio (LR) test statistic, considering the null hypothesis that the model follows the Cobb–Douglas functional form. This hypothesis is rejected at the 1% level of significance in favor of the translog functional form.
The LR test statistic is equal to λ = −2{(log(Likelihood(H0)) − (log(Likelihood(H1))} and approximately follows a χn2 distribution, with n equal to the degrees of freedom. The critical values to perform the necessary hypotheses tests were selected from Table 1 of the work of Kodde and Palm (1986).
articles