


Our study reveals how two separate dimensions of board composition—the proportion of independent directors and of non-independent directors—influence CEO compensation in Western European firms. Controlling for the simultaneous determination of CEO pay structure and board design, we find that firms with a higher proportion of non-independent outsiders on their boards pay less direct compensation (salary+bonus) and less equity-linked compensation to their CEOs. By contrast, CEOs working for firms with more independent boards receive more equity based-pay. When we control for the fact that equity linked is not granted systematically in Europe we find that firms with more independent directors on the board tend to grant equity-linked compensation more often than firms with more non independent outside directors. Our results challenge the commonly accepted view of independent directors as safeguards of shareholder value, uncovering the relevance of non-independent outsiders for pay moderation and incentives.
Independent boards are considered optimal safeguards of shareholder value by closely monitoring the management team and by providing strategic advice and business contacts. Recommendations to increase the number of independent directors have been put in place both in the US and in Europe. Nevertheless, non-independent outside directors are numerous in public corporations, suggesting that although they might have a vested interest in extracting private rents from the firms of which they are board members, they can also add value to those firms. Despite a growing number of theoretical papers indicating the benefits of non-independent outside directors (Raheja, 2005; Harris and Raviv, 2008; Adams and Ferreira, 2007; Baranchuk and Dybvig, 2009), there is little empirical evidence of their importance to corporate boards (Masulis and Mobbs, 2011). We try to help fill this gap in the literature by studying the impact of both non-independent and independent outside directors on CEO pay.
We analyze the relation between board composition and CEO compensation using a data set that contains information on 2308 Western European firms covering 15 countries over the period 1999–2007. We analyze the impact of independent directors and non-independent outsiders separately. If independent directors can effectively restrain insider self-dealing, as Bhagat and Black (2002) suggest, we should observe that firms with more independent directors on their boards pay more moderate pay packages than insider-dominated boards. Yet independent directors might lack the mandate, the incentives and the ability to closely monitor management (Gutierrez and Sáez, 2012), in which case they can substitute direct monitoring with an adequate pay system that aligns the interests of shareholders and management (Holmstrom and Milgrom, 1994).
Non-independent outside directors, on the other hand, have the proper incentives to closely monitor the managers (Hartzell and Starks, 2003). They are usually appointed by large shareholders and are, on average, less busy than independent directors. The close monitoring by non-independent outsiders can prevent rent expropriation from managers and moderate the average CEO pay package (Hermalin and Weisbach, 2003; Bebchuk et al., 2002; Bebchuck and Fried, 2005; Almazan et al., 2005).
In our analysis of European companies, we find that CEOs working for firms with a larger proportion of non-independent outsiders (grey directors) on their boards receive, on average, lower direct and total compensation than CEOs working for firms with fewer non-independent outsiders on their boards. A one standard deviation change in the proportion of non-independent outsiders on the board is related to a 4.2 percent (0.25×0.171×100) reduction in direct compensation and a 21 percent (0.25×0.86×100) reduction in CEO total compensation.
By contrast, we find that the proportion of independent directors is positively related to CEO compensation, specially to the grant of equity-linked compensation. An increase of one standard deviation in the proportion of independent directors is associated with a 0.6 percent (0.22×0.274×100) increase in direct compensation and a 51 percent increase (0.22×2.32×100) in equity-linked compensation. While the presence of independent directors does not have a significant relation to the amount of cash compensation paid to the CEO, it has a strong positive relation to the presence of stock and stock option grants in the compensation packages. As a result, the equity mix (the proportion of equity to total compensation) is significantly larger for companies with more-independent boards.
Our results provide support for the hypothesis that non-independent outsiders serve as effective monitors to moderate pay packages, while independent directors, lacking the means or incentives to monitor, rely on costly incentive packages to align interests (such as stock and stock options) that might prevent pay moderation.
This different effect of non-independent and independent directors on CEO pay reflects the role of non-independent outsiders (mainly block-holders) when deciding the managerial compensation package. This question is very relevant in the current political debate, as the efforts to harmonize corporate governance standards in Europe put special emphasis on increasing board independence.1 In fact, regulators from most countries include in their Codes of Corporate Governance recommendations to set up boards with a vast majority of independent directors and remuneration committees consisting of independent directors. However, this prevalence of independent directors might come at the expense of limiting the role of major shareholders, represented by non-independent outsiders, whose influence in the governance of the firm might be curtailed.
Our analysis aims to contribute to the literature in several ways. First it expands our understanding of how different governance mechanisms (board composition and CEO incentive pay) interact in listed companies. We take advantage of the international nature of our panel to highlight the different role played by outside directors (independent and non-independent) adding evidence for Europe of a phenomenon that has been studied mainly using US data (Guthrie et al., 2012; Chhaochharia and Grinstein, 2009; Fahlenbach, 2009; Chung, 2008 or Hartzell and Starks, 2003; Holmstrom and Kaplan, 2003; Core et al., 1999). For example, Core et al. (1999) find that CEO compensation is higher in the US when a greater percentage of the board is composed of outside directors that are appointed by the CEO or are considered “grey” directors. In Europe, large shareholders usually influence the nomination of non-independent outsiders to board positions. This cross-national diversity of corporate governance yields different board-CEO relations (Aguilera and Jackson, 2003) that might be reflected in the level and structure of compensation packages. When we control for different ownership structures, dimensions of board of directors, company characteristics and performance and institutional backgrounds, the results indicate that the presence of non-independent outsiders moderates CEO compensation and makes it less linked to performance. By contrast, boards with more independent directors rely more on equity-linked compensation which is a costly instrument (Bebchuck and Fried, 2003) that might provide inadequate incentives (Fahlenbrach and Stulz, 2011) and induce excessive risk taking (Coles et al., 2008b).
Second, this paper adds to the published empirical literature about board composition (Boone et al., 2007; Coles et al., 2008a; Linck et al., 2008, 2009; Guest, 2008; Wagner, 2011; Core et al., 1999) and, more specifically, to those papers that link board composition with different aspects of the performance of governance instruments. Using different aspects of performance, these studies avoid the murky relation between board composition and value, where concerns about endogeneity are well known (Hermalin and Weisbach, 2003). Our link between non-independent outsiders and CEO compensation adds to other specific relations studied recently for European companies, such as board composition and managerial ownership (Lasfer, 2006), board composition and short-termism (Gonzalez and Andre, 2014) and board independence and large shareholders (Schleifer and Vishny, 1986; Kim et al., 2007).
Third, this paper contributes to the executive compensation literature by describing the channels through which board composition impacts the level and structure of CEO pay in Europe. We contribute to previous studies that analyze international differences in the level of CEO pay (such as Fernandes et al., 2013) and that highlight the concept of board independence and how it influences CEO compensation packages. Our analysis controls for factors such as firm size (Gabaix et al., 2014), the asymmetry of information between the CEO and the board regarding CEO's managerial skills (Murphy and Zabojnik, 2004), board independence (Cheng and Firth, 2005; Ryan and Wiggings, 2004; Davila and Peñalva, 2006; Coles et al., 2008b) and company performance (Fahlenbrach and Stulz, 2011) that have been identified as determinants of managerial compensation. However, we incorporate features of the second generation of principal-agent models (Kumar and Sivaramakrishnan, 2008; Ozerturk, 2005) to analyze the separate role of non-independent and independent outsiders.
The remainder of the paper is organized as follows: Section ‘Data’ provides a description of the data and econometrics techniques. Section ‘Empirical analysis’ explains the empirical analysis, and Section ‘Conclusion’ provides results and concludes.
DataOur dataset comprises information on listed companies for the main Western Europe Economies during the years 1999–2007. The total number of observations is 10.148, which corresponds to 2308 companies in 15 countries. The panel is unbalanced, containing a lower number of observations in the first half of the sampled years (only 25.98% of the observations correspond to the period 1999–2003, while 74.02% of the observations correspond to the years 2004–2007). For 214 firms, we have information for all of the years in the sample, and for 54.67% of the companies in the sample, we have four or more years of data, which means that over 70% of the observations correspond to firms where we have more than four years of data.
For each firm in the sample, we have data on governance measures and firm book and market values. Information on governance has been obtained from the data supplier BoardEx, while data reflecting firm characteristics and value have been obtained from the Thomson database. BoardEx contains information on executive and supervisory directors in every firm in the sample. For every director in a firm, BoardEx provides information on age, number of board positions, compensation, wealth, director role and years of experience. Aggregating this information at the firm level, it yields a panel on governance measures that includes the name and age of the CEO, time in role, compensation, wealth, experience, number of additional board positions, and number of executives with a co-management position. The dataset also includes board size, the proportion of independent and non-independent directors and the proportion of outsiders on the board. BoardEx contains an industry classification, which is used to create the industry dummies and information on the country where the company is headquartered that is used to create dummies on the legal origin of the country of incorporation. Linking the information on the country of incorporation provided by BoardEx with an index on investor protection provided by the World Bank, we add an additional governance dimension to our panel.
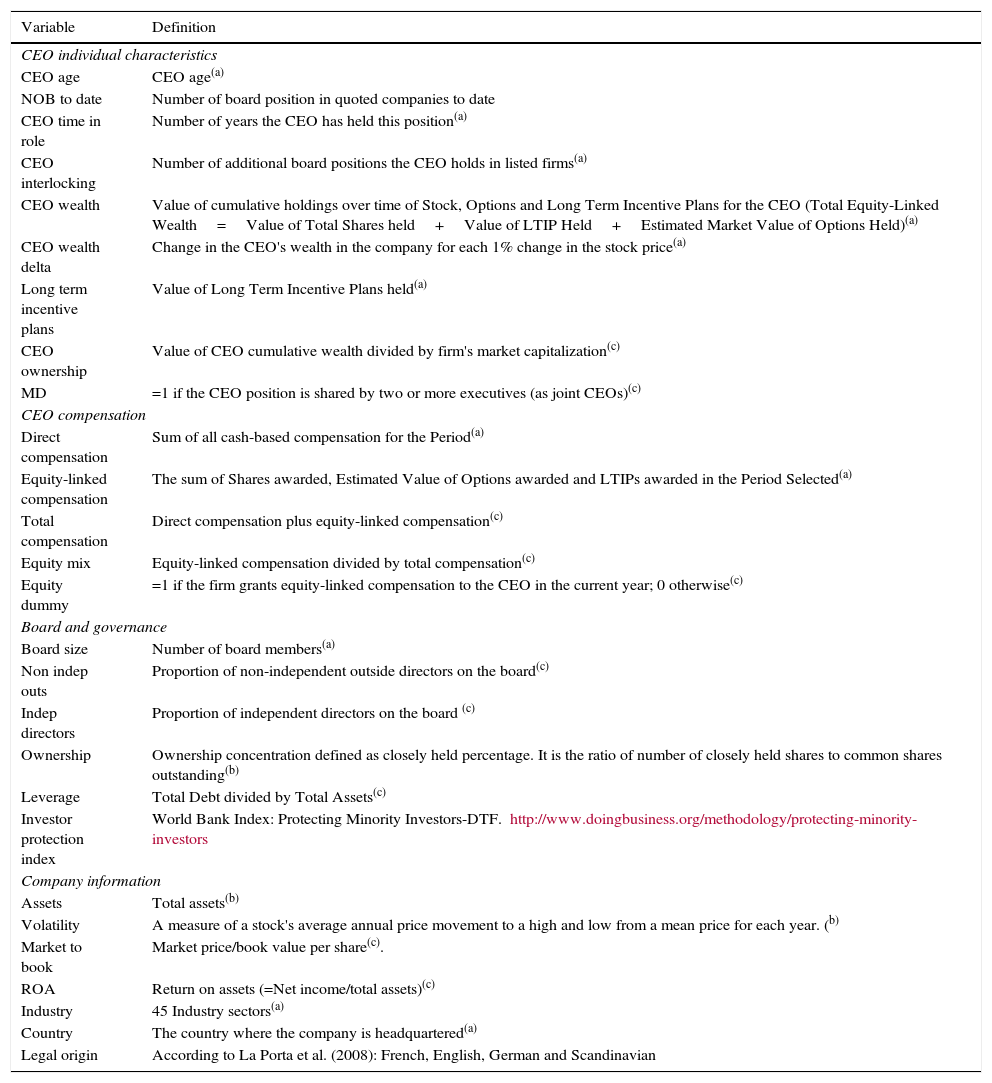
The Thomson database contains information on firm characteristics, such as firm size (market capitalization, assets), leverage, ownership concentration, industry, risk (price volatility), return on assets and market to book ratio. The description of the variables used in the analysis is presented in Table 1.
Variable descriptions. The table presents the definitions of the variables included in the analysis. The first column shows variable name. The second column presents the variable definition and a label indicating the source of the data. The label (a) refers to governance measures obtained from the BoardEx database; label (b) refers to information on firm characteristics and book and market values, provided by Thomson; variables labelled (c) have been calculated transforming the original Thomson and BoardEx data.
| Variable | Definition |
|---|---|
| CEO individual characteristics | |
| CEO age | CEO age(a) |
| NOB to date | Number of board position in quoted companies to date |
| CEO time in role | Number of years the CEO has held this position(a) |
| CEO interlocking | Number of additional board positions the CEO holds in listed firms(a) |
| CEO wealth | Value of cumulative holdings over time of Stock, Options and Long Term Incentive Plans for the CEO (Total Equity-Linked Wealth=Value of Total Shares held+Value of LTIP Held+Estimated Market Value of Options Held)(a) |
| CEO wealth delta | Change in the CEO's wealth in the company for each 1% change in the stock price(a) |
| Long term incentive plans | Value of Long Term Incentive Plans held(a) |
| CEO ownership | Value of CEO cumulative wealth divided by firm's market capitalization(c) |
| MD | =1 if the CEO position is shared by two or more executives (as joint CEOs)(c) |
| CEO compensation | |
| Direct compensation | Sum of all cash-based compensation for the Period(a) |
| Equity-linked compensation | The sum of Shares awarded, Estimated Value of Options awarded and LTIPs awarded in the Period Selected(a) |
| Total compensation | Direct compensation plus equity-linked compensation(c) |
| Equity mix | Equity-linked compensation divided by total compensation(c) |
| Equity dummy | =1 if the firm grants equity-linked compensation to the CEO in the current year; 0 otherwise(c) |
| Board and governance | |
| Board size | Number of board members(a) |
| Non indep outs | Proportion of non-independent outside directors on the board(c) |
| Indep directors | Proportion of independent directors on the board (c) |
| Ownership | Ownership concentration defined as closely held percentage. It is the ratio of number of closely held shares to common shares outstanding(b) |
| Leverage | Total Debt divided by Total Assets(c) |
| Investor protection index | World Bank Index: Protecting Minority Investors-DTF. http://www.doingbusiness.org/methodology/protecting-minority-investors |
| Company information | |
| Assets | Total assets(b) |
| Volatility | A measure of a stock's average annual price movement to a high and low from a mean price for each year. (b) |
| Market to book | Market price/book value per share(c). |
| ROA | Return on assets (=Net income/total assets)(c) |
| Industry | 45 Industry sectors(a) |
| Country | The country where the company is headquartered(a) |
| Legal origin | According to La Porta et al. (2008): French, English, German and Scandinavian |
For every CEO in our sample, we have information on his yearly compensation. This information contains the CEO's yearly direct compensation, which is the sum of salary and bonus (DIRECT COMPENSATION), the market value of shares plus stock options (EQUITY LINKED COMPENSATION), and the sum of direct compensation plus equity-linked compensation (TOTAL COMPENSATION). With this information, we have constructed a dummy variable that takes the value of one if the amount of equity-linked compensation is above zero (EQUITY DUMMY). We have also constructed a variable named EQUITY MIX by dividing equity-linked compensation over total compensation.
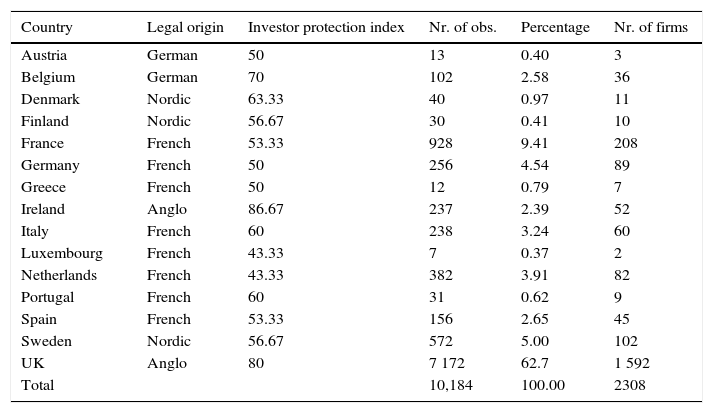
The countries included in the analysis (and the number of observations for each country) are presented in Table 2. All Western European countries are represented in this sample. In our analysis, we follow La Porta et al. (2008) and classify the countries by their legal origin (English, French, German and Scandinavian). We use this classification by legal origin to include geographic dummies in our analysis. We also include the investor protection index provided by the World Bank as a quantitative measure of investor protection. The investor protection index measures the strength of minority shareholder protections against misuse of corporate assets by directors for their personal gain as well as shareholder rights, governance safeguards and corporate transparency requirements that reduce the risk of abuse.2
Distribution of the data by country. The table presents the distribution of the data by country. The first column lists the countries included in the dataset, while the second column presents the country's legal origin, according to La-Porta et al.’s (2008) classification. The third column presents the total number of observations through all of the years in the sample, by country. Percentage refers to the weight of each country on the total sample. Finally, in the last column, we show the total number of firms by country in the sample.
| Country | Legal origin | Investor protection index | Nr. of obs. | Percentage | Nr. of firms |
|---|---|---|---|---|---|
| Austria | German | 50 | 13 | 0.40 | 3 |
| Belgium | German | 70 | 102 | 2.58 | 36 |
| Denmark | Nordic | 63.33 | 40 | 0.97 | 11 |
| Finland | Nordic | 56.67 | 30 | 0.41 | 10 |
| France | French | 53.33 | 928 | 9.41 | 208 |
| Germany | French | 50 | 256 | 4.54 | 89 |
| Greece | French | 50 | 12 | 0.79 | 7 |
| Ireland | Anglo | 86.67 | 237 | 2.39 | 52 |
| Italy | French | 60 | 238 | 3.24 | 60 |
| Luxembourg | French | 43.33 | 7 | 0.37 | 2 |
| Netherlands | French | 43.33 | 382 | 3.91 | 82 |
| Portugal | French | 60 | 31 | 0.62 | 9 |
| Spain | French | 53.33 | 156 | 2.65 | 45 |
| Sweden | Nordic | 56.67 | 572 | 5.00 | 102 |
| UK | Anglo | 80 | 7 172 | 62.7 | 1 592 |
| Total | 10,184 | 100.00 | 2308 |
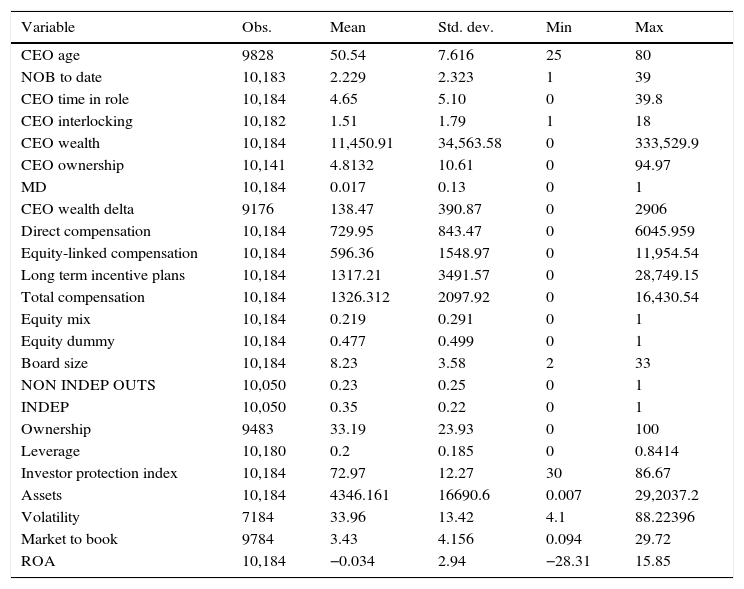
Descriptive statistics are presented in Table 3. All monetary variables have been deflated using 2005 prices as a baseline. We have also winsorized the key variables at 1% and 99% in order to minimize errors and avoid outliers biasing our results.
Summary statistics. Descriptive statistics of the variables included in the analysis. For each variable, the number of observations is presented in the first column. Mean and standard deviations are presented in columns 2 and 3; minimum and maximum values in columns 4 and 5.
| Variable | Obs. | Mean | Std. dev. | Min | Max |
|---|---|---|---|---|---|
| CEO age | 9828 | 50.54 | 7.616 | 25 | 80 |
| NOB to date | 10,183 | 2.229 | 2.323 | 1 | 39 |
| CEO time in role | 10,184 | 4.65 | 5.10 | 0 | 39.8 |
| CEO interlocking | 10,182 | 1.51 | 1.79 | 1 | 18 |
| CEO wealth | 10,184 | 11,450.91 | 34,563.58 | 0 | 333,529.9 |
| CEO ownership | 10,141 | 4.8132 | 10.61 | 0 | 94.97 |
| MD | 10,184 | 0.017 | 0.13 | 0 | 1 |
| CEO wealth delta | 9176 | 138.47 | 390.87 | 0 | 2906 |
| Direct compensation | 10,184 | 729.95 | 843.47 | 0 | 6045.959 |
| Equity-linked compensation | 10,184 | 596.36 | 1548.97 | 0 | 11,954.54 |
| Long term incentive plans | 10,184 | 1317.21 | 3491.57 | 0 | 28,749.15 |
| Total compensation | 10,184 | 1326.312 | 2097.92 | 0 | 16,430.54 |
| Equity mix | 10,184 | 0.219 | 0.291 | 0 | 1 |
| Equity dummy | 10,184 | 0.477 | 0.499 | 0 | 1 |
| Board size | 10,184 | 8.23 | 3.58 | 2 | 33 |
| NON INDEP OUTS | 10,050 | 0.23 | 0.25 | 0 | 1 |
| INDEP | 10,050 | 0.35 | 0.22 | 0 | 1 |
| Ownership | 9483 | 33.19 | 23.93 | 0 | 100 |
| Leverage | 10,180 | 0.2 | 0.185 | 0 | 0.8414 |
| Investor protection index | 10,184 | 72.97 | 12.27 | 30 | 86.67 |
| Assets | 10,184 | 4346.161 | 16690.6 | 0.007 | 29,2037.2 |
| Volatility | 7184 | 33.96 | 13.42 | 4.1 | 88.22396 |
| Market to book | 9784 | 3.43 | 4.156 | 0.094 | 29.72 |
| ROA | 10,184 | −0.034 | 2.94 | −28.31 | 15.85 |
An average CEO in our sample received 1,326,312 US dollars. CEOs received equity-linked compensation in 47.78% of the observations while, in the rest, the CEO pay contained no equity-linked compensation. As many as 1759 firms in our sample did not grant options or any other type of stock grants to their CEOs during the years 1999–2007. On average, equity-linked compensation amounted to 21.9% of CEO compensation. For the years when the CEOs received equity-linked compensation, this type of pay comprised up to 45.9% of their total pay. Equity linked compensation includes the sum of the shares awarded, estimated value of options, and Long Term Incentive Plans linked to equity and awarded in the period selected (one year).
In addition to CEO compensation, we include CEO personal and job-related characteristics, such as age (CEO AGE), the number of years as CEO (CEO TIME IN ROLE), and the additional board positions the CEO holds in listed firms (CEO INTERLOCKING). We also include information on his ownership stake on the firm. We include the value of cumulative holdings over time of stock, options and long-term incentive plans for the CEO (CEO WEALTH) to proxy for his wealth and the value of his holdings divided by the firm's market capitalization (CEO OWNERSHIP) to account for the alignment of interests between the CEO and the firms’ owners. In our robustness test, we use as dependent variable the sum of TOTAL COMPENSATION plus the value of Long Term Incentive Plans held for these CEOs for whom we have such information (in less than 25% of the observations, Long Term Incentive Plans held are recorded).
The average board in our sample had 8.23 members in the period 1999-2007. Of them, 35% (on average) were independent directors, while the proportion of non-independent outsiders (23% on average) was lower. Regarding company information, we include in the analysis information on total assets (ASSETS) to proxy for firm size; the ratio of closely held shares to common shares outstanding (OWNERSHIP); the stock's average annual price movement to a high and low from a mean yearly price (VOLATILITY); industry dummies; and a dummy for the legal origin of the country where the firm is incorporated (LEGAL ORIGIN). Following (Core et al., 1999) we include ROA and MARKET TO BOOK ratios to proxy for economic determinants of CEO pay. We also include an investor protection index to control for the market level of corporate governance (INVESTOR PROTECTION INDEX).
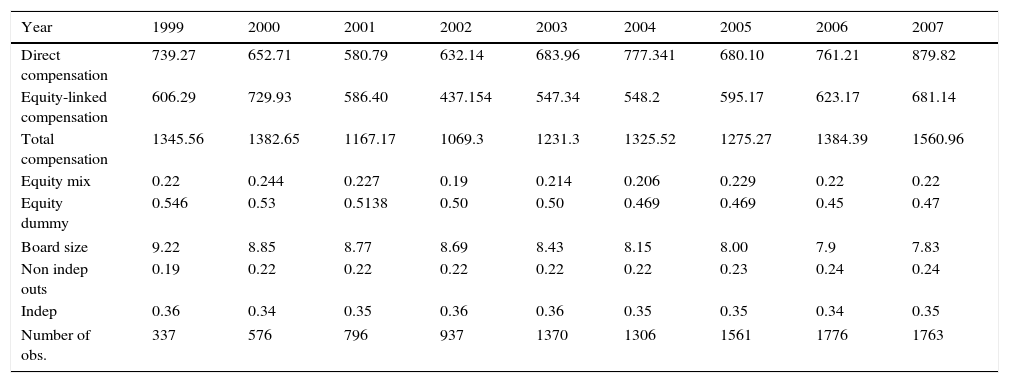
Table 4 shows the evolution of key variables throughout the years of our sample. We observe that CEO pay increased continuously after the year 2002 (it had dropped slightly during the 2001 crisis) until 2007. The evolution of equity-linked compensation followed the evolution of direct and total compensation, with 2007 being the year when CEO pay reached its highest levels (an average CEO received 1,561,000 US dollars in 2007), and 2002 being the year when it was at its lowest. The evolution of equity-linked compensation ran parallel to the state of the public debate on executive compensation during the years 1999–2008. The amount of equity-linked compensation dropped sharply in the year 2000, after the technological bubble of the late 1990s exploded. The enormous increase in stock option compensation of the late 1990s was seen as a key determinant of the speculative era that led to this bubble-burst. We also observe a sharp decline in equity-linked compensation after the Enron scandal was disclosed in October 2001. Due to the Enron scandal, option plans were associated with the distortion of management incentives and earning manipulation. Several policy makers and academics started questioning the effectiveness of this type of remuneration. Still, equity-linked compensation increased during the expansion period 2002–2007, despite the lively public debate on executive compensation, questioning the levels and the structure of executive compensation.
Compensation and governance by year. Yearly descriptive statistics of key variables in our analysis. Each row shows the yearly average. The number of observations per year is included in the last row.
| Year | 1999 | 2000 | 2001 | 2002 | 2003 | 2004 | 2005 | 2006 | 2007 |
|---|---|---|---|---|---|---|---|---|---|
| Direct compensation | 739.27 | 652.71 | 580.79 | 632.14 | 683.96 | 777.341 | 680.10 | 761.21 | 879.82 |
| Equity-linked compensation | 606.29 | 729.93 | 586.40 | 437.154 | 547.34 | 548.2 | 595.17 | 623.17 | 681.14 |
| Total compensation | 1345.56 | 1382.65 | 1167.17 | 1069.3 | 1231.3 | 1325.52 | 1275.27 | 1384.39 | 1560.96 |
| Equity mix | 0.22 | 0.244 | 0.227 | 0.19 | 0.214 | 0.206 | 0.229 | 0.22 | 0.22 |
| Equity dummy | 0.546 | 0.53 | 0.5138 | 0.50 | 0.50 | 0.469 | 0.469 | 0.45 | 0.47 |
| Board size | 9.22 | 8.85 | 8.77 | 8.69 | 8.43 | 8.15 | 8.00 | 7.9 | 7.83 |
| Non indep outs | 0.19 | 0.22 | 0.22 | 0.22 | 0.22 | 0.22 | 0.23 | 0.24 | 0.24 |
| Indep | 0.36 | 0.34 | 0.35 | 0.36 | 0.36 | 0.35 | 0.35 | 0.34 | 0.35 |
| Number of obs. | 337 | 576 | 796 | 937 | 1370 | 1306 | 1561 | 1776 | 1763 |
From Table 4, we also observe that the proportion of observations where equity-linked compensation is strictly positive has declined throughout the years of our sample. However, those firms that do grant equity-linked compensation pay a higher stake of CEO compensation in this form, and the proportion of equity on annual CEO compensation (EQUITY MIX) has been rather stable since the year 2002. We also observe that the average board size declined from 9.22 members in 1999 to 7.83 in 2007, even when both the proportion of non-independent outsiders and of independent directors remained fairly stable.
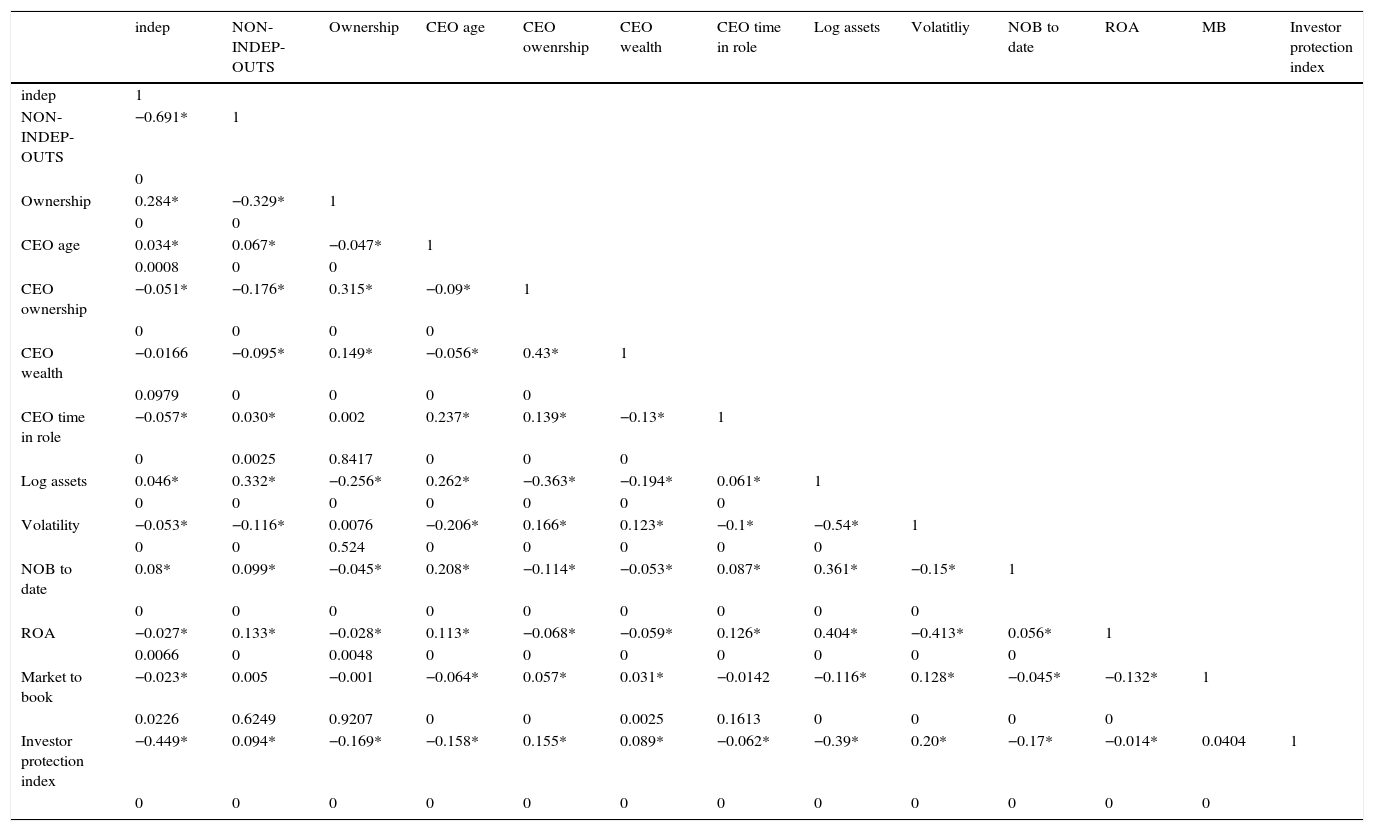
In Table 5 we present the correlation of the key variables in the analysis. As we can see from Table 5 (columns one and two) the absolute value of the correlations between our key explanatory variables (independent and non-independent outsiders) and the rest of explanatory variables do not exceed 0.45 and 0.13 respectively. These correlations are below the 0.7 threshold that is commonly set as the limit for multicollinearity. From column one we observe the significant negative correlation between independent directors and non-independent outsiders is of magnitude 0.69, marginally below the 0.7 threshold. As a precaution, both variables are not included simultaneously in the regression analysis.
Correlation matrix. Pairwise correlations of the key variables in the analysis and their significance level. Stars refer to correlation coefficients significant at the 10% level or better.
| indep | NON-INDEP-OUTS | Ownership | CEO age | CEO owenrship | CEO wealth | CEO time in role | Log assets | Volatitliy | NOB to date | ROA | MB | Investor protection index | |
|---|---|---|---|---|---|---|---|---|---|---|---|---|---|
| indep | 1 | ||||||||||||
| NON-INDEP-OUTS | −0.691* | 1 | |||||||||||
| 0 | |||||||||||||
| Ownership | 0.284* | −0.329* | 1 | ||||||||||
| 0 | 0 | ||||||||||||
| CEO age | 0.034* | 0.067* | −0.047* | 1 | |||||||||
| 0.0008 | 0 | 0 | |||||||||||
| CEO ownership | −0.051* | −0.176* | 0.315* | −0.09* | 1 | ||||||||
| 0 | 0 | 0 | 0 | ||||||||||
| CEO wealth | −0.0166 | −0.095* | 0.149* | −0.056* | 0.43* | 1 | |||||||
| 0.0979 | 0 | 0 | 0 | 0 | |||||||||
| CEO time in role | −0.057* | 0.030* | 0.002 | 0.237* | 0.139* | −0.13* | 1 | ||||||
| 0 | 0.0025 | 0.8417 | 0 | 0 | 0 | ||||||||
| Log assets | 0.046* | 0.332* | −0.256* | 0.262* | −0.363* | −0.194* | 0.061* | 1 | |||||
| 0 | 0 | 0 | 0 | 0 | 0 | 0 | |||||||
| Volatility | −0.053* | −0.116* | 0.0076 | −0.206* | 0.166* | 0.123* | −0.1* | −0.54* | 1 | ||||
| 0 | 0 | 0.524 | 0 | 0 | 0 | 0 | 0 | ||||||
| NOB to date | 0.08* | 0.099* | −0.045* | 0.208* | −0.114* | −0.053* | 0.087* | 0.361* | −0.15* | 1 | |||
| 0 | 0 | 0 | 0 | 0 | 0 | 0 | 0 | 0 | |||||
| ROA | −0.027* | 0.133* | −0.028* | 0.113* | −0.068* | −0.059* | 0.126* | 0.404* | −0.413* | 0.056* | 1 | ||
| 0.0066 | 0 | 0.0048 | 0 | 0 | 0 | 0 | 0 | 0 | 0 | ||||
| Market to book | −0.023* | 0.005 | −0.001 | −0.064* | 0.057* | 0.031* | −0.0142 | −0.116* | 0.128* | −0.045* | −0.132* | 1 | |
| 0.0226 | 0.6249 | 0.9207 | 0 | 0 | 0.0025 | 0.1613 | 0 | 0 | 0 | 0 | |||
| Investor protection index | −0.449* | 0.094* | −0.169* | −0.158* | 0.155* | 0.089* | −0.062* | −0.39* | 0.20* | −0.17* | −0.014* | 0.0404 | 1 |
| 0 | 0 | 0 | 0 | 0 | 0 | 0 | 0 | 0 | 0 | 0 | 0 |
To map the effect of board composition on CEO pay, we use alternatively three measures of board composition: the proportion of outsiders to board size, the proportion of non-independent outsiders to board size, and the proportion of independent directors to board size.
In a first stage, we consider the proportion of outsiders as a rough measure of independence inside the board. In a second stage, we split this general measure into two more-specific measures: the proportion of non-independent outsiders (those directors who are not members of the management team but have a stake in the firm, mainly as shareholders) and the proportion of independent directors (those outsiders who are independent of both the company and the major shareholders). The proportion of non-independent outsiders gives a measure of the relative power of owners versus managers. On the other hand, independent directors are important in protecting the interest of (minority) shareholders versus managers and major shareholders.
The econometric method combines a system of simultaneous equations—to account for the simultaneous determination of CEO pay and board structure—with a panel data estimation. When deciding the optimal board structure, owners have to balance the firm's monitoring and advising needs, information transmission and institutional market constraints. They can also use CEO compensation as a complementary governance mechanism. The level of CEO pay is key to attracting, motivating and retaining talented CEOs, while the structure of CEO pay can be used to ensure that CEOs’ incentives and owners’ interests are aligned. We present these relations in more detail when describing the econometric models used in our analysis. We also take advantage of the availability of data for a large number of firms that remain stable for a period of time. This allows us to build up a panel of data and to identify and take into account the potential effect of firm fixed effects to add robustness to the previous estimations.
Board composition and CEO payThe simultaneous equation model consists of the following equations:
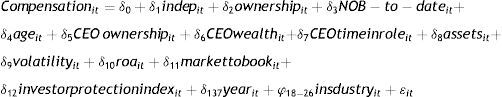

In Eq. (1), the amount of CEO compensation is explained by CEO characteristics, firm-specific characteristics, and market-level conditions. As a dependent variable, we include alternatively different measures of CEO compensation. The main measure of CEO pay is TOTAL COMPENSATION, which is the sum of salary, bonus and equity-linked compensation. In additional regressions, we use DIRECT COMPENSATION (sum of salary and bonus), EQUITY LINKED COMPENSATION (sum of shares and stock option) and EQUITY MIX (proportion of equity-linked compensation to total pay) to obtain a more detailed description of CEO pay.
The key explanatory variables are, alternatively, the proportion of total outside directors (OUTS), the proportion of non-independent outsiders on the board (NON INDEP OUTS) and the proportion of independent directors (INDEP). As additional explanatory variables, we include proxies for CEO talent and ability, along with firm characteristics and market level conditions. We use the number of board positions that the CEO has held to date (NOB TO DATE) as a proxy for CEO total experience in top executive positions. We use the variables CEO AGE and CEO WEALTH to proxy for the CEO degree of risk aversion, as younger and wealthier individuals are, ceteris paribus, less risk averse than older and less-wealthy individuals (Becker, 2006). We include, as CEO WEALTH, the logarithm of the value of cumulative holdings over time of stocks, stock options and long-term incentive plans. Although the variable wealth represents the CEO's ownership in the firm and not his total wealth, we use this variable as a proxy for CEO wealth, as the CEO's portfolio is usually undiversified and his role as CEO constitutes his largest source of income. We include CEO seniority within the firm (CEO TIME IN ROLE) to account for the match between CEO ability and the firm's needs. As the CEO gains seniority within the firm, owners learn about the CEO's abilities and effort provision. This diminishes asymmetric information, makes incentives less necessary and fosters a positive relation between time in role and the amount of CEO compensation. Yet, as the CEO gains seniority, the risk of entrenchment also increases. Whether the coefficient of this variable in a regression is positive and negative might be a reflection of which of the opposing relations (matching versus entrenchment) is prevalent. The alignment of interest of owners and the CEO is related to how much equity-linked compensation (which is an important part of total compensation) he has been granted to date. We use CEO wealth divided by firm market capitalization as a proxy for this alignment of interest (CEO OWNERSHIP). We also include the proportion of company shares in the hands of large owners (OWNERSHIP) to account for the need for monitoring. Firm size is also included to control for firm-specific levels of complexity, technology, and differences in the production function. As a measure of firm size, we use the natural logarithm of totals assets (ASSETS). The volatility of stock prices (VOLATILITY) reflects the firm-specific market risk. Because CEOs have to be rewarded for increased risk, we should expect a positive relation between the amount of CEO compensation and the volatility of stock prices. Following Core et al. (1999) we include a measure of performance (ROA) and a measure of investment opportunities (MARKET TO BOOK) to control for the economic determinants of CEO compensation. Consistent with Core et al. (1999) we expect a positive relation between these two measures and CEO compensation, as firms with a better performance or firms with greater investment opportunities should demand higher quality managers with higher equilibrium wages.
Finally, we take advantage of the multinational nature of our panel, and include an investor protection index (INVESTOR PROTECTION INDEX) to account for the good governance practises of each country. We expect companies in countries with higher investor protection levels to pay lower levels of equity linked compensation to their managers, as the superior institutions contribute partially to align the incentives of shareholders and managers (the risk of rent extraction is lower in countries where investors are protected). Yet, these countries usually have a vibrant market for managers that might swift equilibrium pay levels upwards. That later effect would yield a positive relation between protection index and levels of total compensation.
To account for the fact that board composition and CEO compensation might be simultaneously determined, we instrument board composition with variables that proxy for different firms’ requirements, from the relative need for monitoring and advising to the need for capital to the relative ability and power of the CEO within the board. In Eq. (2), we instrument (alternatively) OUTS, NON INDEP OUTS and INDEP, with proxies for the firm's need to monitor (OWNERSHIP; BOARDSIZE; CEO TIME IN ROLE; ASSETS) and obtain advice (MARKET_TO_BOOK), the need for capital (LEVERAGE) and the relative power of the CEO (CEO INTERLOCKING; MD), as well and time and country fixed effects, which are taken into account with the use of year and legal origin dummies.
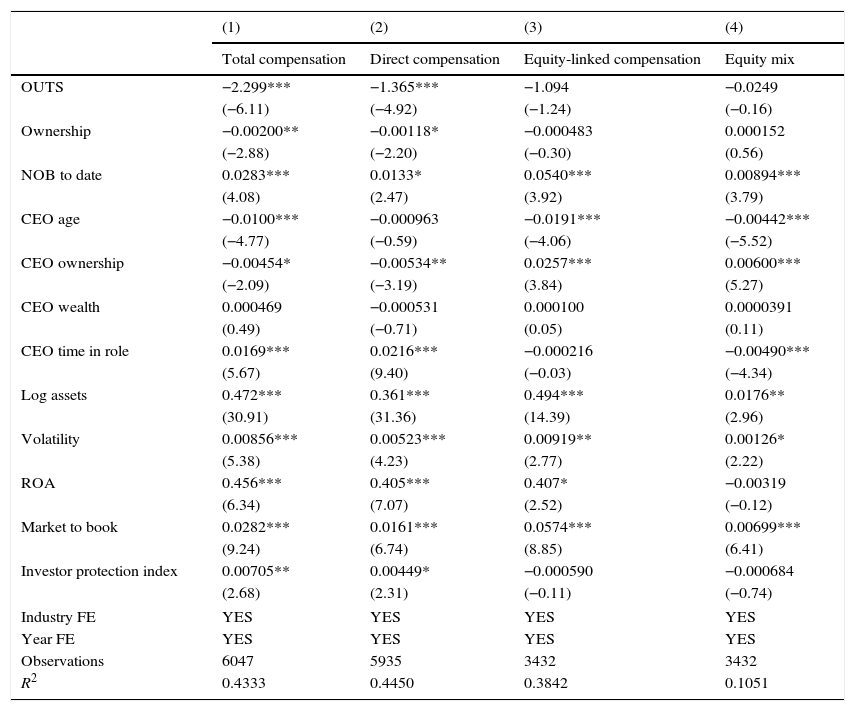
The results for the second-stage estimation are presented in Tables 6.1, 6.2 and 6.3, columns (1)–(4). The dependent variable is CEO compensation, measured by the log of total compensation (columns 1), the log of direct compensation (columns 2), the log of equity-linked compensation (columns 3), and the proportion of equity-linked compensation in total pay (columns 4). The key explanatory variables are the proportion of outsiders (OUTS) in Table 6.1, of non-independent non-executive directors to board size (NON INDEP OUTS) in Table 6.2, and of independent directors (INDEP) in Table 6.3. In columns 3 and 4, only those observations where equity-linked compensation is strictly positive are included. The results for the instrumental equation (Eq. (2)) are not presented in the table but are available upon request.
Board composition (outsiders proportion) and the level of CEO Compensation. The table shows results from second-stage instrumental variables and two-stage least squares for panel-data models. The dependent variable is CEO compensation, measured by the log of total compensation (column 1), the log of direct compensation (column 2), the log of equity-linked compensation (column 3) and the proportion of equity compensation to total pay (column 4). The key explanatory variable is the proportion of non-executive directors to board size, which have been instrumented using ownership concentration, board size, CEO time in role, the log of total assets, firm leverage and a dummy for legal origin. In columns 3 and 4, only those observations where equity-linked compensation is strictly positive are included. z-Values in parentheses. Stars refer to *P<0.10; **P<0.05; ***P<0.01.
| (1) | (2) | (3) | (4) | |
|---|---|---|---|---|
| Total compensation | Direct compensation | Equity-linked compensation | Equity mix | |
| OUTS | −2.299*** | −1.365*** | −1.094 | −0.0249 |
| (−6.11) | (−4.92) | (−1.24) | (−0.16) | |
| Ownership | −0.00200** | −0.00118* | −0.000483 | 0.000152 |
| (−2.88) | (−2.20) | (−0.30) | (0.56) | |
| NOB to date | 0.0283*** | 0.0133* | 0.0540*** | 0.00894*** |
| (4.08) | (2.47) | (3.92) | (3.79) | |
| CEO age | −0.0100*** | −0.000963 | −0.0191*** | −0.00442*** |
| (−4.77) | (−0.59) | (−4.06) | (−5.52) | |
| CEO ownership | −0.00454* | −0.00534** | 0.0257*** | 0.00600*** |
| (−2.09) | (−3.19) | (3.84) | (5.27) | |
| CEO wealth | 0.000469 | −0.000531 | 0.000100 | 0.0000391 |
| (0.49) | (−0.71) | (0.05) | (0.11) | |
| CEO time in role | 0.0169*** | 0.0216*** | −0.000216 | −0.00490*** |
| (5.67) | (9.40) | (−0.03) | (−4.34) | |
| Log assets | 0.472*** | 0.361*** | 0.494*** | 0.0176** |
| (30.91) | (31.36) | (14.39) | (2.96) | |
| Volatility | 0.00856*** | 0.00523*** | 0.00919** | 0.00126* |
| (5.38) | (4.23) | (2.77) | (2.22) | |
| ROA | 0.456*** | 0.405*** | 0.407* | −0.00319 |
| (6.34) | (7.07) | (2.52) | (−0.12) | |
| Market to book | 0.0282*** | 0.0161*** | 0.0574*** | 0.00699*** |
| (9.24) | (6.74) | (8.85) | (6.41) | |
| Investor protection index | 0.00705** | 0.00449* | −0.000590 | −0.000684 |
| (2.68) | (2.31) | (−0.11) | (−0.74) | |
| Industry FE | YES | YES | YES | YES |
| Year FE | YES | YES | YES | YES |
| Observations | 6047 | 5935 | 3432 | 3432 |
| R2 | 0.4333 | 0.4450 | 0.3842 | 0.1051 |
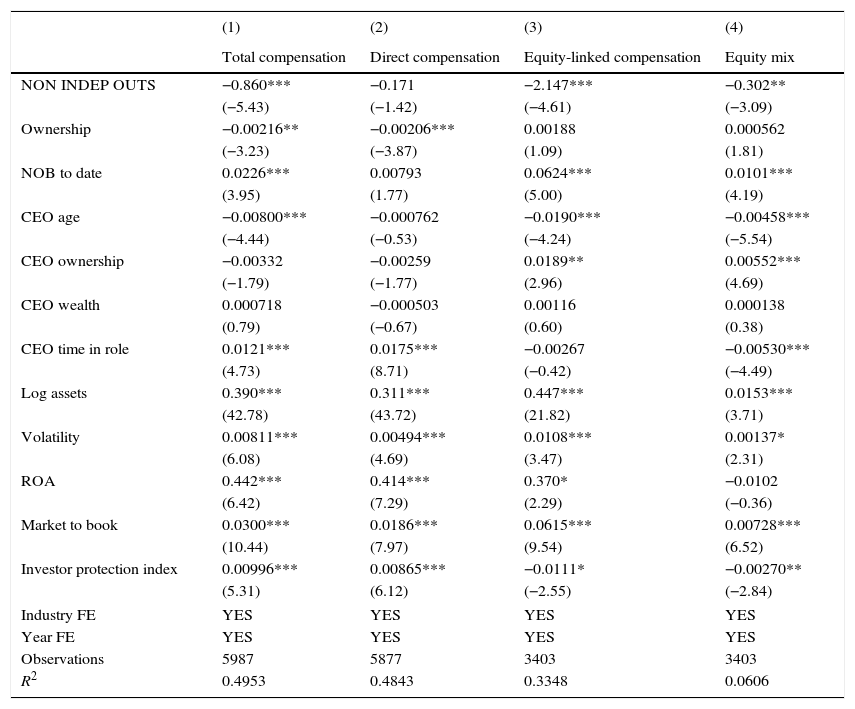
Board composition (proportion of non-independent outsiders) and CEO Compensation. The table shows results from second-stage instrumental variables and two-stage least squares for panel-data models. The dependent variable is CEO compensation, measured by the log of total compensation (column 1), the log of direct compensation (column 2), the log of equity-linked compensation (column 3) and the proportion of equity compensation to total pay (column 4). The key explanatory variable is the proportion of non-independent outsider directors to board size, which have been instrumented using ownership concentration, board size, CEO time in role, the log of total assets, firm leverage and a dummy for legal origin. In columns 3 and 4, only those observations where equity-linked compensation is strictly positive are included. z-Values in parentheses. Stars refer to *P<0.10; **P<0.05; ***P<0.01.
| (1) | (2) | (3) | (4) | |
|---|---|---|---|---|
| Total compensation | Direct compensation | Equity-linked compensation | Equity mix | |
| NON INDEP OUTS | −0.860*** | −0.171 | −2.147*** | −0.302** |
| (−5.43) | (−1.42) | (−4.61) | (−3.09) | |
| Ownership | −0.00216** | −0.00206*** | 0.00188 | 0.000562 |
| (−3.23) | (−3.87) | (1.09) | (1.81) | |
| NOB to date | 0.0226*** | 0.00793 | 0.0624*** | 0.0101*** |
| (3.95) | (1.77) | (5.00) | (4.19) | |
| CEO age | −0.00800*** | −0.000762 | −0.0190*** | −0.00458*** |
| (−4.44) | (−0.53) | (−4.24) | (−5.54) | |
| CEO ownership | −0.00332 | −0.00259 | 0.0189** | 0.00552*** |
| (−1.79) | (−1.77) | (2.96) | (4.69) | |
| CEO wealth | 0.000718 | −0.000503 | 0.00116 | 0.000138 |
| (0.79) | (−0.67) | (0.60) | (0.38) | |
| CEO time in role | 0.0121*** | 0.0175*** | −0.00267 | −0.00530*** |
| (4.73) | (8.71) | (−0.42) | (−4.49) | |
| Log assets | 0.390*** | 0.311*** | 0.447*** | 0.0153*** |
| (42.78) | (43.72) | (21.82) | (3.71) | |
| Volatility | 0.00811*** | 0.00494*** | 0.0108*** | 0.00137* |
| (6.08) | (4.69) | (3.47) | (2.31) | |
| ROA | 0.442*** | 0.414*** | 0.370* | −0.0102 |
| (6.42) | (7.29) | (2.29) | (−0.36) | |
| Market to book | 0.0300*** | 0.0186*** | 0.0615*** | 0.00728*** |
| (10.44) | (7.97) | (9.54) | (6.52) | |
| Investor protection index | 0.00996*** | 0.00865*** | −0.0111* | −0.00270** |
| (5.31) | (6.12) | (−2.55) | (−2.84) | |
| Industry FE | YES | YES | YES | YES |
| Year FE | YES | YES | YES | YES |
| Observations | 5987 | 5877 | 3403 | 3403 |
| R2 | 0.4953 | 0.4843 | 0.3348 | 0.0606 |
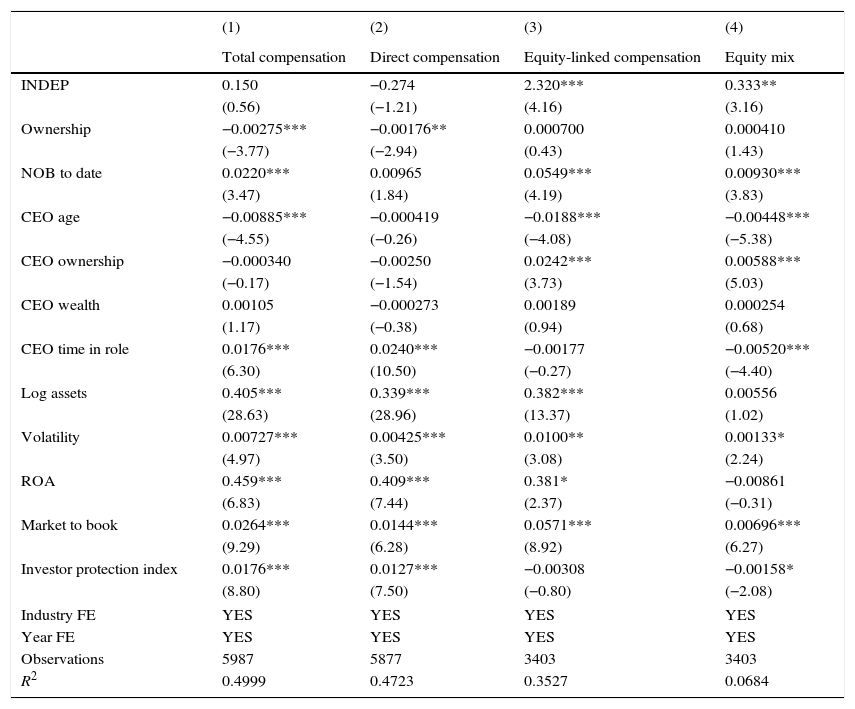
Board composition (proportion of independent directors) and the level of CEO compensation. The table shows results from second-stage instrumental variables and two-stage least squares for panel-data models. The dependent variable is CEO compensation, measured by the log of total compensation (column 1), the log of direct compensation (column 2), the log of equity-linked compensation (column 3) and the proportion of equity compensation to total pay (column 4). The key explanatory variable is the proportion of truly independent directors (not related to significant owners) to board size, which have been instrumented using ownership concentration, board size, CEO time in role, the log of total assets, firm leverage and a dummy for legal origin. In columns 3 and 4, only those observations where equity-linked compensation is strictly positive are included. z-Values in parentheses. Stars refer to *P<0.10; **P<0.05; ***P<0.01.
| (1) | (2) | (3) | (4) | |
|---|---|---|---|---|
| Total compensation | Direct compensation | Equity-linked compensation | Equity mix | |
| INDEP | 0.150 | −0.274 | 2.320*** | 0.333** |
| (0.56) | (−1.21) | (4.16) | (3.16) | |
| Ownership | −0.00275*** | −0.00176** | 0.000700 | 0.000410 |
| (−3.77) | (−2.94) | (0.43) | (1.43) | |
| NOB to date | 0.0220*** | 0.00965 | 0.0549*** | 0.00930*** |
| (3.47) | (1.84) | (4.19) | (3.83) | |
| CEO age | −0.00885*** | −0.000419 | −0.0188*** | −0.00448*** |
| (−4.55) | (−0.26) | (−4.08) | (−5.38) | |
| CEO ownership | −0.000340 | −0.00250 | 0.0242*** | 0.00588*** |
| (−0.17) | (−1.54) | (3.73) | (5.03) | |
| CEO wealth | 0.00105 | −0.000273 | 0.00189 | 0.000254 |
| (1.17) | (−0.38) | (0.94) | (0.68) | |
| CEO time in role | 0.0176*** | 0.0240*** | −0.00177 | −0.00520*** |
| (6.30) | (10.50) | (−0.27) | (−4.40) | |
| Log assets | 0.405*** | 0.339*** | 0.382*** | 0.00556 |
| (28.63) | (28.96) | (13.37) | (1.02) | |
| Volatility | 0.00727*** | 0.00425*** | 0.0100** | 0.00133* |
| (4.97) | (3.50) | (3.08) | (2.24) | |
| ROA | 0.459*** | 0.409*** | 0.381* | −0.00861 |
| (6.83) | (7.44) | (2.37) | (−0.31) | |
| Market to book | 0.0264*** | 0.0144*** | 0.0571*** | 0.00696*** |
| (9.29) | (6.28) | (8.92) | (6.27) | |
| Investor protection index | 0.0176*** | 0.0127*** | −0.00308 | −0.00158* |
| (8.80) | (7.50) | (−0.80) | (−2.08) | |
| Industry FE | YES | YES | YES | YES |
| Year FE | YES | YES | YES | YES |
| Observations | 5987 | 5877 | 3403 | 3403 |
| R2 | 0.4999 | 0.4723 | 0.3527 | 0.0684 |
From Table 6.1, we can observe a negative relation between the proportion of outside directors and CEO compensation. This relation holds for total and direct compensation but less so for equity-linked compensation. In fact, a 10% increase in the outside proportion leads to a 13.6% decrease in direct compensation and a 22.9% decrease in total compensation. Meanwhile, the proportion of outside directors is not significantly related to EQUITY MIX (the proportion of equity-linked compensation over total CEO pay), or EQUITY LINKED COMPENSATION. In addition, we observe a positive, significant and robust relation between the log of total assets and volatility and CEO pay. These variables behave as expected, in the sense that bigger, more complex and riskier firms reward their CEOs more substantially. Lastly, the positive relation with ROA and MARKET TO BOOK shows that CEOs gets a greater compensation if the firm is more efficient or holds a substantial set of growth opportunities.
This positive relation between CEO compensation and the proportion of outsiders might be disguising the compound effect of the two kinds of independent directors considered in the paper: the non-independent outsiders (independent of management but related to significant owners) and the truly independent directors (not related to management or significant owners). To disentangle this plausible compound effect, we run separate estimations for each of these measures of independent boards in Tables 6.2 and 6.3.
From Table 6.2, column (1), we observe a negative and significant relation between the proportion of non-independent outsiders on the board and the level of CEO compensation. A 10% increase in the proportion of non-independent directors on the board is related to an 8.6% decrease in total CEO compensation. We also find a negative and significant relation between ownership concentration and CEO pay. A 10% increase in ownership concentration is associated with a 2.1% lower CEO compensation. Taken together, the moderating effects of non-independent outsiders and ownership concentration suggest a non-negligible influence of large owners on CEO pay. Together with firm characteristics (firm size and volatility and certain industry dummies), and proxies for market conditions and company performance, ownership concentration and board characteristics are the main drivers of total CEO compensation.
In Table 6.2, columns (2) and (3), we decompose Total Compensation into its components. The moderating impact of non-independent outsiders remains in the use of equity-linked compensation. A 10% increase in the proportion of non-independent outsiders on the board is related to a 21.47% decrease in the total amount of equity-linked compensation. The proportion of incentives in total pay (column 4) is also reduced when more non-independent outsiders are on the board, suggesting that owners substitute costly pay incentives with strong monitoring. Thus, we confirm that the presence of non-independent directors has a moderating effect on the level of total compensation, and it is also negatively related to the grant of equity incentives (both in terms of the total amount of equity-linked compensation granted and the proportion of equity-linked compensation to total pay).
The analysis of the personal characteristics of the CEO shows some interesting results. The relation between CEO age and equity-linked compensation is negative and significant, suggesting a lower risk aversion for younger CEOs. Younger managers are ready to take higher compensations levels, mainly in the form of equity-linked pay, as we can see from the significance of the coefficients in columns (3) and (4) as opposed to the non-significant coefficient of direct compensation in column (2). CEO wealth is not directly related to any form of compensation. For CEO TIME IN ROLE, we find a different sign for total and direct compensation and for equity mix, which are positive and negative, respectively. An increase in CEO time in role might be the result of a better match between manager and firm that would result in higher amounts of direct and total compensation, yet a lower dependence on equity based remuneration. It could also reflect entrenchment, as CEO with tenure might have accumulated power over the years, and could extract economic rents in the form of excess compensation. The positive relation between ROA and compensation levels is more in line with the first argumentation. As expected, CEO ownership reveals a positive relation with compensation linked to the market value of the firm.
In Table 6.3, we show how the negative effect of board composition variables on compensation vanishes when we use the proportion of truly independent directors (not related to managers or significant owners) as a key explanatory variable. From column 1, we observe that the proportion of independent directors is positively but not significantly related to the total amount of CEO compensation. On the other hand, equity-link compensation is positively and significantly related to the presence of independent directors on board. According to our results, it seems the excess compensation paid to CEOs in firms with more-independent boards is mainly due to the higher equity-linked compensation packages to CEOs in these firms. As a result, a 10% increase in the proportion of independent directors on boards is associated with a 23% increase in equity-linked compensation. The proportion of equity-linked compensation to total pay (EQUITY MIX) is also positively related to the presence of independent directors on boards. This result is in line with Adams and Ferreira's (2007) argument that owners complement board independence with adequate incentives to promote information transmission between members of the management team and non-members.
The non-random selection into equity-linked compensationAn additional analysis is run considering that the use of equity-linked compensation is not generalized in Europe. Not every firm in Europe uses equity-linked compensation, and those that do use it do not grant equity-linked compensation every year systematically. This fact generates a selection problem that we take into account using a Heckman two-step procedure (Heckman, 1979). In a first step, the non-random selection into equity-linked schemes is taken into account, while in the second step, the extension and intensity in the use of CEO compensation schemes is explained by managerial and firm factors. Using a two-step selection approach, we account for the bias that might appear due to non-random selection into equity-linked compensation schemes. We run the following regressions:
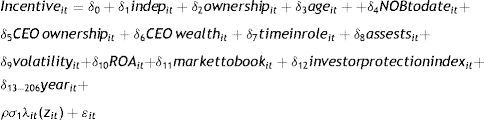

In the outcome equation, Eq. (3), the amount or intensity of incentives is explained by CEO, firm and board characteristics and market-level conditions. These incentives are measured by the proportion of equity-linked compensation to total pay (EQUITY MIX) and the total amount of equity-linked compensation (EQUITY LINK COMPENSATION) in logarithm, which are, alternatively, our dependent variables. To explain the amount and proportion of incentives, we include as explanatory variables—together with our measures of board independence—CEO and firm characteristics that might influence the power of these incentives. Because of the costs associated with incentive pay, owners will grant equity-linked compensation depending on the efficiency of these incentives. Holmstrom and Milgrom (1991) stress that the incentive contracts induce managers to exert higher levels of effort, but they also expose them to risk because perfect measures of effort and output are hardly available. In an agency model framework, incentives are more powerful when the manager has greater influence over firm profits, when profits respond positively to the manager's effort and when those profits are less risky. By contrast, they are more costly to the firm when the manager is risk averse and when the cost of effort to the manager is higher. NOB TO DATE proxies for the overall CEO experience. We include CEO AGE and CEO WEALTH to proxy for the CEO's degree of risk aversion. CEO TIME IN ROLE accounts for the asymmetry of information between owners and the CEO about the CEO's abilities. The proportion of a firm's shares in the hands of the CEO (CEO OWNERSHIP) accounts for the alignment of interests. Firm size (ASSESTS) and firm risk (VOLATILITY) account for the risk posed by and the influence of the CEO over the firm's profits. As before, ROA, MARKET TO BOOK and INVESTOR PROTECTION INDEX are controls for economic and institutional determinants of CEO compensation. Year dummies are also included.
In the selection Eq. (4), the dependent variable (INCENTIVEit=1) is a binary variable that takes the value of 1 if the CEO receives any kind of equity-linked compensation in year t, and 0 otherwise (EQUITY DUMMY). The key explanatory variables in the selection equation are (alternatively) the proportion of non-independent outsiders (NON INDEP OUTS) and the proportion of independent directors (INDEP) on the board. Additional explanatory variables included in the selection equation control for the firm's corporate governance design and firm and institutional constraints. These variables are ownership concentration (OWNERSHIP) and board size (BOARD SIZE). We expect ownership concentration to be negatively related to the grant of stock options, as shareholders with a large stake in a firm have an interest in monitoring the management closely. Board size is a board control variable. Arguably, larger boards have more resources to monitor the managers, which would reduce the need for incentives. We also include in the selection equation a set of firm-level controls. These controls are firm size (ASSETS), leverage (LEVERAGE), CEO seniority (CEO TIME IN ROLE), and year and industry dummies. We expect firm size (ASSETS) to be positively related to the use of incentives, as CEOs might favour increases in firm size above optimal levels because bigger firms pay higher salaries (Gabaix and Landier, 2008). By the same token, we expect the level of debt (LEVERAGE) to be negatively related to the grant of stock options, as debt holders also have an incentive to monitor intensively. Moreover, the need for funds can make the firm increase its transparency levels, making the CEO's effort more easily observable. The variable CEO TIME IN ROLE accounts for the power that the CEO exerts over the board. A CEO with longer tenure exerts power over his compensation package, having a preference for less-risky compensation. We use industry dummies (SECTOR) to control for differences in product characteristics and firm and industry's specific knowledge. Finally, the use of year dummies allows us to account for the effect and macroeconomic and regulation changes across the analyzed period.
Results for this model specification are presented in Table 7. Panel A presents the results of the outcome equation, whereas Panel B contains the results of the selection equation. In columns (1) and (2), the key explanatory variable for both the outcome and the selection equation is NON INDEP OUTS, and in columns (3) and (4), the key explanatory variable for both equations is the proportion of independent directors (INDEP).
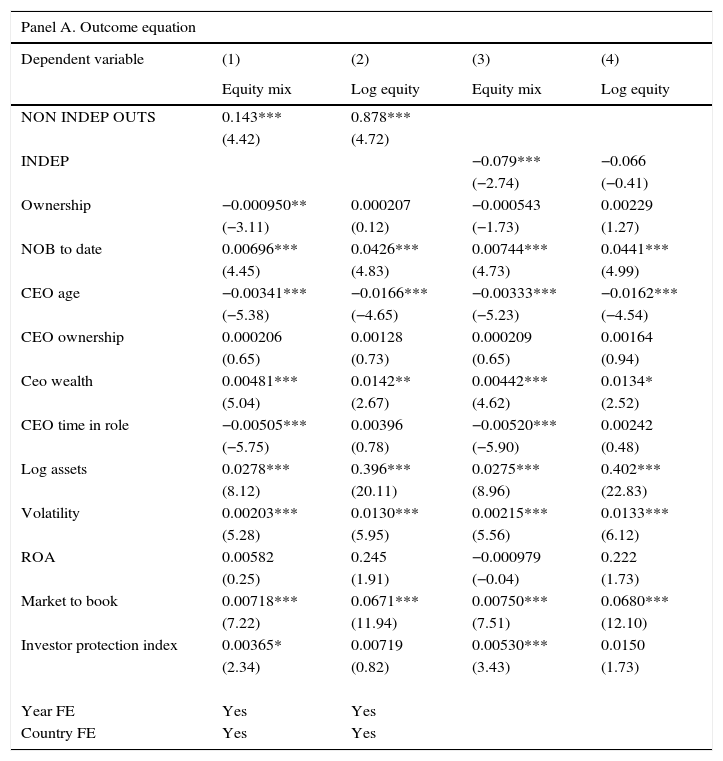
Board composition and the structure of CEO pay. The table shows results from a Heckman regression model estimation of Eqs. (3) and (4). In the outcome regression (Panel A), the dependent variable alternates between the proportion of equity-linked compensation to total compensation (equity mix) in Columns 1 and 3 and the log of equity-linked compensation in columns 2 and 4. In the selection equation (Panel B), the dependent variable is a dummy that takes the value one if the CEO received equity-linked compensation within the year (equity dummy). The key explanatory variable NON-INDEP OUTS refers to the proportion of non-independent outside directors to board size. The different columns differ by the dependent variable (equity ratio and total amount of equity compensation) in the outcome equation and by the different specifications of the selection equation. z-Values in parentheses. Stars refer to *P<0.05; **P<0.01; ***P<0.001.
| Panel A. Outcome equation | ||||
|---|---|---|---|---|
| Dependent variable | (1) | (2) | (3) | (4) |
| Equity mix | Log equity | Equity mix | Log equity | |
| NON INDEP OUTS | 0.143*** | 0.878*** | ||
| (4.42) | (4.72) | |||
| INDEP | −0.079*** | −0.066 | ||
| (−2.74) | (−0.41) | |||
| Ownership | −0.000950** | 0.000207 | −0.000543 | 0.00229 |
| (−3.11) | (0.12) | (−1.73) | (1.27) | |
| NOB to date | 0.00696*** | 0.0426*** | 0.00744*** | 0.0441*** |
| (4.45) | (4.83) | (4.73) | (4.99) | |
| CEO age | −0.00341*** | −0.0166*** | −0.00333*** | −0.0162*** |
| (−5.38) | (−4.65) | (−5.23) | (−4.54) | |
| CEO ownership | 0.000206 | 0.00128 | 0.000209 | 0.00164 |
| (0.65) | (0.73) | (0.65) | (0.94) | |
| Ceo wealth | 0.00481*** | 0.0142** | 0.00442*** | 0.0134* |
| (5.04) | (2.67) | (4.62) | (2.52) | |
| CEO time in role | −0.00505*** | 0.00396 | −0.00520*** | 0.00242 |
| (−5.75) | (0.78) | (−5.90) | (0.48) | |
| Log assets | 0.0278*** | 0.396*** | 0.0275*** | 0.402*** |
| (8.12) | (20.11) | (8.96) | (22.83) | |
| Volatility | 0.00203*** | 0.0130*** | 0.00215*** | 0.0133*** |
| (5.28) | (5.95) | (5.56) | (6.12) | |
| ROA | 0.00582 | 0.245 | −0.000979 | 0.222 |
| (0.25) | (1.91) | (−0.04) | (1.73) | |
| Market to book | 0.00718*** | 0.0671*** | 0.00750*** | 0.0680*** |
| (7.22) | (11.94) | (7.51) | (12.10) | |
| Investor protection index | 0.00365* | 0.00719 | 0.00530*** | 0.0150 |
| (2.34) | (0.82) | (3.43) | (1.73) | |
| Year FE | Yes | Yes | ||
| Country FE | Yes | Yes | ||
| Panel B. Selection equation. Dependent variable EQUITY DUMMY | ||||
| NON INDEP OUTS | −1.428*** | −1.428*** | ||
| (−18.61) | (−18.61) | |||
| INDEP | 1.127*** | 1.127*** | ||
| (13.89) | (13.89) | |||
| Ownership | −0.0139*** | −0.0139*** | −0.0153*** | −0.0153*** |
| (−18.71) | (−18.71) | (−21.04) | (−21.04) | |
| Leverage | −0.624*** | −0.624*** | −0.655*** | −0.655*** |
| (−6.10) | (−6.10) | (−6.48) | (−6.48) | |
| Board size | 0.0108 | 0.0108 | −0.00734 | −0.00734 |
| (1.68) | (1.68) | (−1.19) | (−1.19) | |
| CEO time in role | −0.00853** | −0.00853** | −0.00534 | −0.00534 |
| (−2.87) | (−2.87) | (−1.80) | (−1.80) | |
| Log assets | 0.201*** | 0.201*** | 0.167*** | 0.167*** |
| (18.31) | (18.31) | (14.76) | (14.76) | |
| Year FE | Yes | Yes | Yes | Yes |
| Industry FE | Yes | Yes | Yes | Yes |
| Lambda | 0.0345 | −0.636*** | 0.0174 | −0.637*** |
| (1.45) | (−4.63) | (0.75) | (−4.79) | |
| N | 8394 | 8394 | 8394 | 8394 |
From Table 7, columns (1) and (2), we find a positive and statistically significant relation between the proportion of non-independent outsiders on the board and the amount and the proportion of equity-linked compensation in CEO pay. A 10% increase in the proportion of outsiders on the board implies a 1.43% increase in the proportion of CEO pay that is linked to stocks and stock options and an increase of 8.78% in the total amount of equity-linked compensation received. These positive and significant coefficients of the variable NON INDEP OUTS in the outcome equation support the hypothesis that once they have chosen to pay equity-linked compensation, firms with a higher proportion of non-independent outsiders on their boards provide higher pay incentives to their CEO in terms of the amount of equity-linked compensation and of the percentage of compensation linked to equity.
However, the negative and significant coefficients of the explanatory variable NON INDEP OUTS in the selection equation (Panel B, columns 1 and 2) indicate that the presence of non-independent outsiders on boards reduces the probability that equity-linked compensation is used (these firms grant equity-linked compensation less often). The size of the coefficient shows that a 10% increase in the proportion of independent outsiders on the board implies a 14.28% decrease in the probability of existence of equity-linked compensation. We interpret this change in coefficient as an indication of the interaction between alternative governance mechanisms. In all cases, the complementary relation between board composition and CEO incentives remains positive and significant.
We include additional assumptions of agency models regarding risk, effort and noise in the output measurements to control the relationship between board composition and CEO compensation. Looking at the outcome equations (panel A), we see that the CEO degree of risk aversion is significantly related to the amount and proportion of CEO income that is linked to equity. We use AGE and WEALTH as proxies for the degree of risk aversion, as younger and wealthier individuals are arguably less risk averse. Accordingly, we find that younger (AGE) and richer CEOs (WEALTH) receive more incentive pay, both in absolute and relative terms. We also find that equity-linked compensation is positively related to firm size (ASSETS) and negatively related to CEO seniority (CEO TIME IN ROLE). Firm size controls for higher levels of complexity in the technology and production functions, provoking a substantial increase in the equity-linked compensation. The negative relation between CEO seniority and incentives might be explained by the fact that the owners gain a better knowledge of CEO abilities and effort provision as the CEO gains seniority within the firm, diminishing asymmetric information and making incentives less necessary. Finally, we find that the proportion and level of equity-linked pay are positively related to price volatility (VOLATILITY), a feature that is consistent with several previous empirical studies on executive compensation (see Prendergast, 2002), even when is contrary to agency predictions. The value of stock options, which depends positively on the volatility of the underlying asset, might be leading this positive relation. Unfortunately, we cannot separate the two components of equity-based compensation (shares and options) to address their different relation to the firm's risk. Finally, and regarding economic and institutional determinants of CEO compensation, a higher set of investment opportunities foster a higher level of equity compensation pay, as shows the positive sign of the variable Market to Book in columns (1) and (2). Investor protection index, as in the previous analysis, yields a positive relation for the equity mix and allows setting equilibrium pay levels upwards.
When we use the proportion of independent directors (INDEP) as a key explanatory variable (Table 7, columns 3 and 4), we observe a positive, significant and very high coefficient linking the use of equity-linked and the proportion of independent directors on the board. In terms of comparison, a 10% increase in the proportion of independent directors on board implies an 11.27% in the probability of CEO pay is linked to equity (Panel B, selection equation).
Once selection is taken into account, the amount of equity linked compensation is not significantly related to the proportion of independent directors, and is slightly negative when equity mix is the dependent variable (Panel A, outcome equation).
In sum, there is a higher probability to pay using equity-link compensation in firms with more independent boards. This result reinforces that of Table 6: independent boards rely more on incentive schemes linked to equity-link compensation, once the nonrandom selection of equity-link compensation is controlled for. The positive coefficient in Panel B columns 3 and 4 is in clear contrast to the results in columns 1 and 2, and supports the notion that owners set their corporate governance structure as a system and that the relation between corporate governance components is affected by the existence of alternative governance instruments (such as concentrated ownership and monitoring debt holders).
Alternative measures of CEO payThroughout our analysis, we have used the yearly remuneration as a measurement of CEO compensation. This definition leaves our certain features of CEO wealth, such as holdings of long term incentive plans or retirement plans, which might certainly influence CEO behaviour. In this section, we test whether our main conclusions remain when we include such components in the analysis. To do so, we replicate the analysis presented in equations one and two using as dependent variable alternative measures of CEO compensation.
The first one is TOTAL COMPENSATION WITH LTIP. We construct this variable adding, to our variable TOTAL COMPENSATION, the value of long term incentive plans held, for those CEOs for whom we have such information. The second one is EQUITY MIX WITH LTIP, which is the result of dividing equity-linked compensation by total compensation with LTIP. Finally, we include in our analysis the variable CEO WEALTH DELTA that refers to the change in CEO's wealth in the company for each 1% change in the stock price. Wealth delta is a commonly used measure of pay performance sensitivity and is obtained directly from the database BoardEx. The results for these model specifications are included in Table 8.
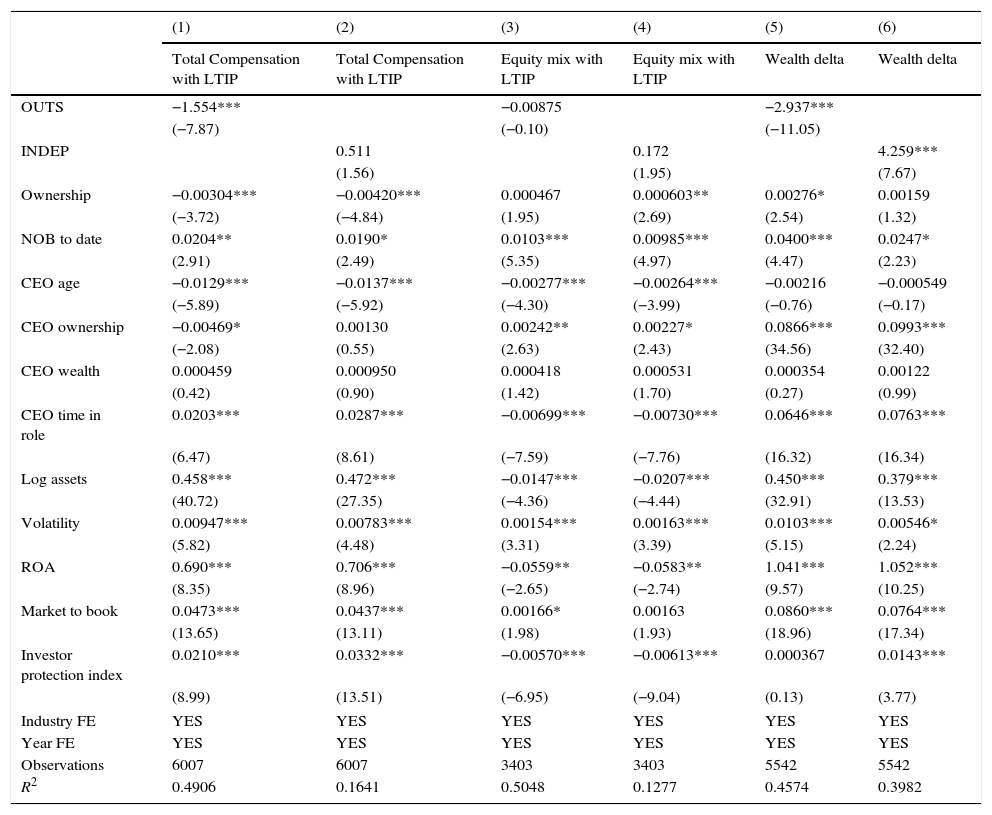
Alternative measures of CEO compensation. The table shows results from second-stage instrumental variables and two-stage least squares for panel-data models. The dependent variable is CEO compensation, measured by the log of total compensation plus long term incentive plans (columns 1 and 2), the ratio of equity linked compensation to total compensation plus long term incentive plans (columns 3 and 4) and the changes on CEO wealth for a 0ne percent change in stock price (columns 5 and 6). The key explanatory variable is the proportion of non-executive directors to board size, which have been instrumented using ownership concentration, board size, CEO time in role, the log of total assets, firm leverage and a dummy for legal origin. In columns 3 and 4, only those observations where equity-linked compensation is strictly positive are included. z-Values in parentheses. Stars refer to *P<0.10; **P<0.05; ***P<0.01.
| (1) | (2) | (3) | (4) | (5) | (6) | |
|---|---|---|---|---|---|---|
| Total Compensation with LTIP | Total Compensation with LTIP | Equity mix with LTIP | Equity mix with LTIP | Wealth delta | Wealth delta | |
| OUTS | −1.554*** | −0.00875 | −2.937*** | |||
| (−7.87) | (−0.10) | (−11.05) | ||||
| INDEP | 0.511 | 0.172 | 4.259*** | |||
| (1.56) | (1.95) | (7.67) | ||||
| Ownership | −0.00304*** | −0.00420*** | 0.000467 | 0.000603** | 0.00276* | 0.00159 |
| (−3.72) | (−4.84) | (1.95) | (2.69) | (2.54) | (1.32) | |
| NOB to date | 0.0204** | 0.0190* | 0.0103*** | 0.00985*** | 0.0400*** | 0.0247* |
| (2.91) | (2.49) | (5.35) | (4.97) | (4.47) | (2.23) | |
| CEO age | −0.0129*** | −0.0137*** | −0.00277*** | −0.00264*** | −0.00216 | −0.000549 |
| (−5.89) | (−5.92) | (−4.30) | (−3.99) | (−0.76) | (−0.17) | |
| CEO ownership | −0.00469* | 0.00130 | 0.00242** | 0.00227* | 0.0866*** | 0.0993*** |
| (−2.08) | (0.55) | (2.63) | (2.43) | (34.56) | (32.40) | |
| CEO wealth | 0.000459 | 0.000950 | 0.000418 | 0.000531 | 0.000354 | 0.00122 |
| (0.42) | (0.90) | (1.42) | (1.70) | (0.27) | (0.99) | |
| CEO time in role | 0.0203*** | 0.0287*** | −0.00699*** | −0.00730*** | 0.0646*** | 0.0763*** |
| (6.47) | (8.61) | (−7.59) | (−7.76) | (16.32) | (16.34) | |
| Log assets | 0.458*** | 0.472*** | −0.0147*** | −0.0207*** | 0.450*** | 0.379*** |
| (40.72) | (27.35) | (−4.36) | (−4.44) | (32.91) | (13.53) | |
| Volatility | 0.00947*** | 0.00783*** | 0.00154*** | 0.00163*** | 0.0103*** | 0.00546* |
| (5.82) | (4.48) | (3.31) | (3.39) | (5.15) | (2.24) | |
| ROA | 0.690*** | 0.706*** | −0.0559** | −0.0583** | 1.041*** | 1.052*** |
| (8.35) | (8.96) | (−2.65) | (−2.74) | (9.57) | (10.25) | |
| Market to book | 0.0473*** | 0.0437*** | 0.00166* | 0.00163 | 0.0860*** | 0.0764*** |
| (13.65) | (13.11) | (1.98) | (1.93) | (18.96) | (17.34) | |
| Investor protection index | 0.0210*** | 0.0332*** | −0.00570*** | −0.00613*** | 0.000367 | 0.0143*** |
| (8.99) | (13.51) | (−6.95) | (−9.04) | (0.13) | (3.77) | |
| Industry FE | YES | YES | YES | YES | YES | YES |
| Year FE | YES | YES | YES | YES | YES | YES |
| Observations | 6007 | 6007 | 3403 | 3403 | 5542 | 5542 |
| R2 | 0.4906 | 0.1641 | 0.5048 | 0.1277 | 0.4574 | 0.3982 |
Our main conclusions are robust to the inclusion of alternative measures of compensation. From Table 8, columns 1 and 3, we observe a negative and significant relation between the proportion of non-independent outsiders and Total compensation with LTIP and a non-significant relation to equity mix with LTIP, in line with our main results presented in Table 6.2. We also find a non-significant relation between independent directors and total compensation or equity mix with LTIP. Ultimately, long term incentive plans do not seem to be the relevant criteria in order to set up suitable incentives to the CEO by independent directors in our sample.
Finally, in Table 8, columns 5 and 6, we replace our dependent variable Total Compensation with a variable that measures the sensitivity of CEO pay to share performance (CEO WEALTH DELTA). We find a negative and significant relation between wealth delta and the proportion of non-independent outsiders on the board, and a positive and significant relation between wealth delta and the proportion of independent outsiders. This empirical finding could suggest governance substitution. According to the monitoring substitution hypothesis independent directors, lacking the means or incentives to monitor, rely on costly incentive packages (such as stocks and stock options) that eventually result in higher compensation. By contrast, non-independent outsiders serve as monitors to moderate pay packages, and CEO pay agreements rely less of market prices in this case. This interpretation is also robust to our analysis—where the non random selection of equity linked compensation is taken into account—that concludes that firms with more independent outsiders on the board grant equity linked compensation more often, and in larger sums than firms with non-independent outsiders on boards.
To test the robustness of our results, we have conducted two additional analyses. In the first one, we change the concept of board composition, to analyze the impact of supermajorities on boards. When we select only the observations where NON-INDEPENDENT-OUTSIDERS has a supermajority in the board (more than 50%), the coefficients keep their sign and significance, and become of bigger magnitude. For example, the coefficient that measures the relation between non-independent outsiders and CEO total compensation, which is −0.86 in Table 6.2 column 1 becomes −1.6 when the continuous variable non-independent-outsiders is substituted with a dummy for a supermajority of non-independent outsiders. This increase in magnitude implies that the moderating impact of non-independent outside directors on CEO total compensation does not peak when the number of such directors reaches a certain level, but remains even when the group of non-independent outsiders is large enough. The same conclusion remains when the board is composed by a supermajority of independent directors: coefficients do not change sign or significance, and they become larger in magnitude. The results of this robustness test are very interesting, and relevant in the analysis of board diversity and how homogeneous groups behave within organizations (in this case, boards), which is beyond the scope of this paper. The relevance to this paper is that it adds robustness to our main set of results, where we find a negative and significant relation between non independent outsiders on the board and CEO compensation. Results for this robustness test are not reported here, but are available upon request.
Finally, we split our sample in two groups (UK and non-UK firms) to test whether our results are driven by the institutional characteristics of the UK framework. We find that our main conclusions remain unchanged when we run the regressions separately for the sample that contains only observations from the UK, and for the sample that contains all observations from Continental Europe. In general, the coefficients that measure the relation between board composition and CEO compensation in the UK are slightly larger in magnitude than those from Continental Europe. Yet, we still find in Continental Europe a moderating effect of non-independent outsiders on total compensation, and increased equity linked compensation in firms with more independent directors on their boards. With this test (not reported here but available upon request) we control for the abundance of UK companies driving our set of results.
ConclusionsAs a result of the remarkable changes in the global business environment in the last decade, we observe a tendency towards increased regulation and stricter corporate governance recommendations in most developed economies. One area where there seems to be a certain degree of consensus among regulators is the necessity of having independent directors. Consequently, recommendations to increase the number of independent directors have been put in place both in the US and in Europe. Yet, non-independent directors are numerous in public corporations, indicating that although these directors might have a vested interest in extracting private rents from the firms of which they are board members, they can also add value to those firms. In this paper, we use a representative sample of listed firms for the main Western European Economies to explore the effect of board composition on CEO pay, taking into account the presence of other governance mechanisms.
We find evidence of a negative and significant relation between the presence of non-independent outsiders on European boards and CEO pay. This finding, together with the negative and significant relation between ownership concentration and CEO pay levels, supports the voices in Europe that advocate for a shareholder-friendly model of Corporate Governance. Strong owners have usually been perceived as safeguards of shareholder value in Europe, and our findings are in line with this view. Additionally, we find a significant positive relation between the proportion of independent directors in European boards and CEO equity-linked pay, even when the use of equity-linked compensation has been questioned as it might provide inadequate incentives.
In terms of policy implications, our analysis supports a Corporate Governance European policy that encourages the adoption and transparency of incentive pay systems combined with the use of strong boards. The quest for board independence challenges two of the main pillars of corporate governance in Europe: the presence of large block holders and the active involvement of large owners in the corporate governance of the corporations where they invest. Overall, our results are in line with a recent strand of the literature that advocates for a shareholder approach to corporate governance (Hansen, 2007), stressing the importance of large shareholders and supervisory directors for value creation.
The recent financial crisis and the United Kingdom's withdrawal from the European Union have put a brake on the process of corporate governance harmonization that was so intense in Europe during the period 2002−2010. Regulators have shifted the accent away from harmonization, towards creating more strict controls of board and CEO behaviours. It remains an open question whether these changes will affect the mechanisms through which board composition impacts pay structure and the design of equity linked compensation and other incentives.
The authors benefited from the valuable comments of two anonymous referees, I. Diez (the associate editor), J. Franks, G. Cestone, L. Cabeza, M. Conyon, B. Garcia-Osma, T. Berlund, M. Park, and A. Gallo as well as participants at the Acede Conference (Barcelona), the Executive Compensation after the Financial Crisis International Conference (Copenhagen), and the Family Business Symposium (Salamanca). They also thank Sandra Sizer and Alisa Larson for editorial assistance. Financial support from the Spanish Ministry of Economy and Competitiveness (grants ECO2012-32554 and ECO2014-56102-P) and from the Santander Financial Institute (APIE Num. 2/2015-2017) are gratefully acknowledged. Any errors are the sole responsibility of the authors.
articles