


This paper analyzes whether effective boards of directors in addressing shareholder interests also prove to be effective in guaranteeing the interests of the rest of the firm's stakeholders. We measure board effectiveness based on the shareholder perspective, and test whether it is valid for the stakeholder perspective. The novelty of this paper precisely lies in its approach, given that it considers both perspectives of corporate governance at a time. Using the transparency of sustainability reports as a proxy for the stakeholder perspective in an international sample of 2366 companies, the paper shows that effective boards are more likely to address the interests of both the shareholders and the rest of the firm's stakeholders. Furthermore, we propose a measure of board effectiveness by gathering several board characteristics. Our results contribute to research on corporate governance and corporate social responsibility reporting, and it has implications for policy makers.
This paper analyzes whether boards of directors that are effective in addressing shareholder interests also prove to be effective in guaranteeing the interests of the rest of the firm's stakeholders. We propose a measure of board effectiveness based on the board characteristics that contribute to the protection of shareholder interests under the shareholder perspective of corporate governance and test its validity under the stakeholder perspective of the firm's corporate governance. According to Letza et al. (2004), the shareholder and stakeholder perspectives are the most relevant approaches for analyzing the firm's corporate governance. The former considers that the key aim of corporate governance is the protection of shareholder interests. The latter advocates that the main objective of corporate governance is to guarantee the interests of all of the firm's stakeholders. This approach extends the scope of corporate governance by considering shareholders as a type of stakeholder with rights equal to those held by the others (Money and Schepers, 2007).
The stakeholder perspective of corporate governance is strongly linked to corporate social responsibility (CSR) (Jamali et al., 2008). CSR aims to maximize “…the creation of shared value for their owners/shareholders and for their other stakeholders and society at large” (European Commission, 2011:6). Therefore, CSR contributes to the goal of corporate governance under the stakeholder perspective. The establishment of governance structures related to CSR, such as CSR committees and reporting, emphasizes the significant relationship between corporate governance and CSR (Money and Schepers, 2007). Even the growing literature on the topic highlights the crucial role of corporate governance mechanisms, especially boards of directors, in establishing CSR practices (Amran et al., 2014; Fernández Sánchez et al., 2011; García-Sánchez et al., 2015; Khan et al., 2013; Webb, 2004).
Boards are responsible for monitoring the management and providing it with strategic advice. Prior research on the effectiveness of boards in performing these tasks has mainly relied on the shareholder perspective (Finegold et al., 2007; John and Senbet, 1998; Kiel and Nicholson, 2003; Van den Berghe and Levrau, 2004). These papers conclude that several demographic characteristics of boards (e.g. independence, female directors, the separation of CEO and chairperson) determine board effectiveness in promoting shareholder value. In fact, most of them are suggested in Codes of Best Practices around the world. Conversely, research on board effectiveness under the stakeholder perspective is scarce. Several papers analyze the influence of board characteristics on CSR practices and reporting (Amran et al., 2014; Garcia-Sanchez et al., 2014; Lattemann et al., 2009; Mallin and Michelon, 2011; Prado-Lorenzo et al., 2009; Rodríguez-Ariza et al., 2014), without taking into account the effect of these board characteristics on the protection of shareholder interests. This paper contributes to filling this gap. It considers both perspectives of corporate governance and explores whether boards that are effective in guaranteeing shareholder interests, by means of increasing shareholder value, are also effective in responding to the interests of the rest of the stakeholders. The scope of corporate governance has broadened to consider all stakeholders (Letza et al., 2004), so it seems necessary to look into whether the effect of board effectiveness also extends to and guarantees the protection of all stakeholder interests.
To this end, we measured board effectiveness by gathering in a single variable those board characteristics that contribute to the aim of corporate governance under the shareholder perspective. To assess whether stakeholder interests are satisfied, we used the transparency of sustainability reports as proxy for the stakeholder perspective. The sustainability report is the tool most widely used by firms to disclose CSR information (Fernandez-Feijoo et al., 2014a). By means of providing transparent sustainability reports, firms satisfy the information interests of their stakeholders on CSR issues. We established a structural equation model to analyze whether board effectiveness under the shareholder perspective influences the stakeholder perspective of the firm's corporate governance. We tested our model in an international sample of 2366 firms throughout the period ranging from 2009 to 2012. We found that board effectiveness positively affects the transparency of sustainability reports. This result implies that the boards which are effective in addressing shareholder interests are also effective in protecting the interests of all the firm's stakeholders.
This paper makes several contributions to research on corporate governance as well as on CSR practices and reporting. It demonstrates that boards benefiting the shareholders also enhance CSR reporting and increase the firm's awareness on the needs of the rest of its stakeholders. It also responds to the call to improve the understanding of the determinants of board effectiveness (Van den Berghe and Levrau, 2004). We capture board effectiveness in a single variable and develop a quantifiable measure based on several demographic board characteristics. Our measure facilitates assessment and allows for a comparative analysis of board effectiveness for future research. Additionally, we demonstrate that the conceptualization and measurement of board effectiveness under the shareholder perspective maintains its validity under the stakeholder perspective of corporate governance. Finally, our results have implications for policy makers. Codes of Best Practice all over the world are suggesting many of the board characteristics driving board effectiveness based on the shareholder perspective. Including these recommendations not only helps to further protect shareholder interests, but it also guarantees the interests of the rest of stakeholders.
This paper is structured as follows. After this introduction, the following section reviews previous literature on board effectiveness and corporate governance perspectives to develop the hypothesis. The third section describes the methodology, while fourth section introduces and discusses our results. Finally, the last section presents the conclusions and limitations of the study and suggests further research.
Literature review and hypothesis developmentResearch on board effectiveness has mostly relied on classical theories of corporate governance, such as agency, stewardship and resource dependence theories (Finegold et al., 2007; John and Senbet, 1998; Kiel and Nicholson, 2003; Van den Berghe and Levrau, 2004). These theories fall under the shareholder perspective as they advocate that the aim of corporate governance mechanisms, including the board of directors, is to increase shareholder value and protect owner interests (Letza et al., 2004). Therefore, this line of research argues that board effectiveness depends on how well the boards perform their monitoring and strategic advisory roles (Adams et al., 2010; Forbes and Milliken, 1999; Kroll et al., 2008; Minichilli et al., 2012). Both of these roles contribute to financial performance in response to shareholder interests (Duchin et al., 2010; Forbes and Milliken, 1999; John and Senbet, 1998). According to de Andres et al. (2005), board characteristics determining board effectiveness under this perspective can be grouped into three categories: size, composition and internal functioning.
Regarding board size, de Andres et al. (2005) highlighted that corporate governance rating systems agree on limiting the maximum number of directors because large boards are suboptimal, whereas small boards enhance participation, involvement and cohesiveness. However, they noted that a minimum number of members should also be established to meet the proper composition in terms of power and diversity. Newell and Wilson (2002) proposed that the ideal size is 5 to 9 members. This suggestion is consistent with the results of prior papers that found both positive and negative relationships between board size and board effectiveness (Finegold et al., 2007). The average board size is within the 5–9 range in the papers reporting a positive relationship (Huse et al., 2009; Kiel and Nicholson, 2003). Conversely, the average sizes in the studies that found a negative relationship were either above or below this range (de Andres et al., 2005; Eisenberg et al., 1998; Yermack, 1996). Therefore, Newell and Wilson's (2002) proposal contributes to board effectiveness. In fact, Codes of Best Practices in several countries (e.g. Spain) propose a minimum and maximum threshold for board size.
Literature on board composition distinguishes four main issues: independence, CEO duality, presence of women and directors’ experience. Most studies support a positive relationship between independence and the board's monitoring (Dahya et al., 2002; John and Senbet, 1998; Klein, 2002; Renneboog, 2000; Suchard et al., 2001; Tuggle et al., 2010) and strategic advisory roles (Baysinger et al., 1990; Johnson et al., 1993), as a means to protect shareholder interests. Regarding the effect of board independence on financial performance, Duchin et al. (2010) concluded that the cost of acquiring information for outside directors moderates this relationship. They found that financial performance improves when the outside directors’ cost of acquiring information is low, whereas financial performance worsens when this cost is high. Therefore, board independence improves financial performance under the right conditions.
CEO duality implies substantial power for the CEO/chairperson, for example, by allowing that person to set the board meeting agendas to suit his or her interests and thereby avoid intense monitoring (Jensen, 1993; Tuggle et al., 2010). Some papers reported that CEO duality has a negative effect on financial performance (Coles et al., 2001; Rechner and Dalton, 1991). Daily and Dalton (1994) concluded that firms with CEO duality are more likely to go bankrupt, which implies that it jeopardizes corporate survival. Regarding the boards’ monitoring role, Tuggle et al. (2010) reported that CEO duality weakens the relationship between poorer prior performance and attention to monitoring. Additionally, CEO duality is also negatively related to the strategic involvement of the board (Ruigrok et al., 2006).
The presence of female directors is an important driver of board effectiveness. Boards with women are related to higher financial performance (Daily and Dalton, 2003; Joecks et al., 2013; Smith et al., 2006). Adams and Ferreira (2009) concluded that female directors are better monitors than men because they attend board meetings more regularly, promote the attendance of their male peers, and are more likely to work on monitoring committees. These authors also indicate that women's intense monitoring influences their positive effect on financial performance. A major presence of female directors only improves firm performance in corporations with weak shareholder rights, when tougher monitoring is necessary. Women are more sensitive to the interest of others and usually consider the perspectives of multiple parties (Terjesen et al., 2009). These features contribute to the strategic advisory role of boards by considering different strategic options (Daily and Dalton, 2003), improving the oversight of corporate strategy (Nielsen and Huse, 2010), and enhancing board dynamics (Kramer et al., 2006).
Directors’ profiles are also a key element of board composition (Van den Berghe and Levrau, 2004). Forbes and Milliken (1999) argued that directors should have functional and firm-specific experience and skills to increase board effectiveness. Kroll et al. (2008) found that firms obtain better outcomes when acquiring other companies if their directors have industry-specific experience. Similarly, markets react positively to the appointment of new directors when they are accounting and finance experts (Defond et al., 2005), or when they have business knowledge and experience (Fich, 2005). Directors’ experience also improves the monitoring and strategic roles of boards. Conger et al. (1998) concluded that directors require appropriate knowledge to develop their tasks effectively. Kroll et al. (2008) posited that directors with no appropriate expertise become less involved because of intellectual constraints.
Board meetings and board committees are the most analyzed issues in relation to the internal functioning of boards. The frequency of meetings is related to the internal administrative structure of boards (de Andres et al., 2005). According to Van den Berghe and Levrau (2004), board meetings are a procedural aspect that improves board effectiveness and they are used as a proxy for board activity. Vafeas (1999) studied how the number of meetings affects firm performance. He found that boards meet more regularly in years with lower performance. Nonetheless, years with more frequent meetings are followed by an increase in performance in subsequent years. This result suggests that board meetings contribute to financial performance in the long term and that monitoring increases when firms face problems. Other authors agreed with this conclusion as they found that the number of board meetings promote board monitoring (Conger et al., 1998; de Andres et al., 2005). Corporate governance rating systems and Codes of Best Practices promote the establishment of different committees to improve board effectiveness (Van den Berghe and Levrau, 2004). For instance, firms with audit committees and remuneration committees are related to higher performance (Chen and Nowland, 2010). Klein (1998) argued that board committees should be structured in two categories to contribute to board effectiveness: monitoring committees (audit, compensation and nomination committees) and productivity committees (finance, investment and strategic committees).
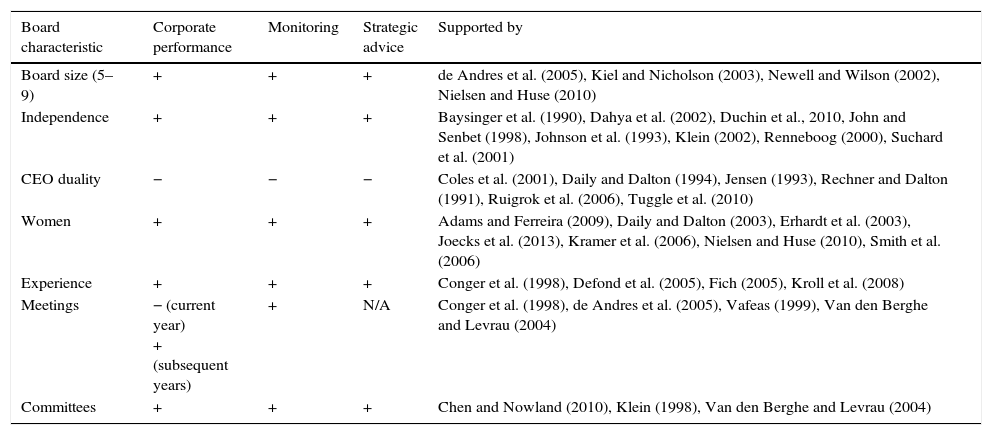
These three types of board characteristics (size, composition and internal functioning) are crucial to conceptualizing and determining board effectiveness based on the shareholder perspective. Table 1 provides a summary on how these board characteristics influence board effectiveness outcomes under that perspective of corporate governance.
Effect of board characteristics on board effectiveness outcomes under the shareholder perspective.
N/A: not applicable.
Since the late 20th century, academics support that the firm's corporate governance can also be approached from a stakeholder perspective (Letza et al., 2004). This change toward a stakeholder viewpoint is demonstrated by the fact that stakeholder issues have been included in Codes of Best Practices in recent years (Szabó and Sørensen, 2013). Based on the stakeholder theory (Freeman, 1984), this perspective argues that corporate governance should guarantee the protection of the interests of all of a firm's stakeholders. This evolution requires revisiting the conceptualization of board effectiveness under the shareholder perspective to assess its validity for the stakeholder perspective. Initially, the two perspectives may be regarded as opposites, given that satisfying the interests of the rest of the stakeholders could imply giving less attention to shareholder interests. However, they should be considered complementary. The stakeholder perspective does not promote the protection of stakeholder interests at the expense of the protection of the shareholder interests. It extends the scope of corporate governance by considering shareholders a specific type of stakeholder, with rights equal to those held by others (Money and Schepers, 2007). Given this broader scope, board effectiveness based on the shareholder perspective should have a positive effect on the stakeholder perspective of the firm's corporate governance.
Additionally, social concerns about firms’ economic, environmental and social impacts have grown significantly over the last decades (Abeysekera, 2013; Gray, 2006). This situation requires companies to legitimize their activities to guarantee their survival (Deegan, 2002). Firms should operate in a way that benefits or, at least, does not harm society to gain support from their stakeholders. Boards of directors play an important role in establishing strategies to legitimize firm behavior, especially through CSR practices and reporting (Khan et al., 2013). Therefore, effective boards based on the shareholder perspective should be effective in addressing stakeholder interests and increasing the stakeholder perspective of the firm's corporate governance.
Finally, Webb (2004) studied the structure of boards of directors in 394 socially responsible firms and compares it to the structure of boards in a matched sample of non-socially responsible firms. She found socially responsible firms have boards with higher proportion of women and outsiders and less CEO duality than non-socially responsible firms. These characteristics are some of the drivers of board effectiveness under the shareholder perspective. Being socially responsible is a way of responding to stakeholder interests; hence, we expect that firms with effective boards in protecting shareholder interests may be also more effective in promoting stakeholder interests.
Based on the arguments presented above, we propose the following hypothesis:H1 Board effectiveness under the shareholder perspective positively affects the stakeholder perspective of the firm's corporate governance.
Information on boards of directors, sustainability reports and firm characteristics was collected from the Asset4 database (Thomson Reuters Datastream), the Global Reporting Initiative (GRI) database and corporate webpages. Asset4 database collects and uses data from corporate reports and websites, as well as from other publicly available sources to offer transparent, objective, auditable and systematic information about economic, environmental governance and social matters to assess firm performance (Schäfer et al., 2006). The universe of Asset4 covers over 4000 listed firms worldwide. GRI is the organization that issues the most world widely used guidelines to elaborate sustainability reports (Brown et al., 2009; Roca and Searcy, 2012). GRI database is built based on the information presented by the firms that publish sustainability reports following the GRI Guidelines. GRI database covers more than 6000 companies that have published at least one sustainability report between 1999 and 2014.
Using Asset4 as primary source, we selected firms from the countries that belong to the two main corporate governance models, as identified by Weimer and Pape (1999): the market-oriented and the network-oriented models. This selection yielded an initial sample of 3351 companies. For those firms that disclose sustainability reports following the GRI guidelines according to Asset4, we collected additional data on their reports from the GRI database. When we observed any inconsistencies between the Asset4 and GRI data, we relied on the information provided by the company itself through its website.
We analyzed the years spanning from 2009 to 2012. We chose 2009 as the starting year because it was the first year in which all the firms in our sample publishing a sustainability report followed the most recent version of the GRI guidelines at the time, the G3 version. These guidelines were released in 2006, so some firms still followed the G2 version until 2009 while others followed the G3 version. We only included the firms that had data on all the variables for at least one year in our final sample. We established this requirement instead of having data for all four years to include the firms that might have disappeared during the period. Thus, we avoided survival bias. After this adjustment, our final sample consisted of 2366 firms with all the data available for at least one year, and it included 8546 firm-year observations throughout the period ranging from 2009 to 2012.
VariablesThe dependent and independent variables are two latent constructs that are not directly observable by nature. Therefore, their measurement requires the establishment of a set of observable indicators that are related to how the latent variables behave. The relationship between the latent variables and their indicators, known as epistemic relationship, can be formative or reflective (Diamantopoulos and Siguaw, 2006). A formative relationship is causal, whereby changes in the latent variable are determined by changes in its indicators, the so-called formative indicators. A reflective relationship is consequential, whereby changes in the latent variable are reflected in changes in its indicators, the so-called reflective indicators. Based on this distinction, we established the following measurement models for each variable.
Dependent variableStakeholder perspective of the firm's corporate governance is the dependent variable. We used the transparency of sustainability reports, proposed by Fernandez-Feijoo et al. (2014b), as a proxy for our dependent variable. The sustainability report is the most common tool that firms use to provide their stakeholders with CSR disclosures and satisfy their interests in receiving transparent and reliable information. According to Fernandez-Feijoo et al. (2014b), the transparency of sustainability reports is the reflection of four characteristics assessing the content and quality of sustainability reports following GRI guidelines: frequency of reporting, level of application of the GRI guidelines, declaration of the level and assurance. Despite “greenwashing” or legitimating motivations for disclosing CSR information, prior research highlighted that the quality and content of sustainability reports reflect CSR practices and behavior (De la Cuesta-González et al., 2006; Fernandez-Feijoo et al., 2014a; De Godos Díez et al., 2012). Moreover, transparency, through the disclosure of information to stakeholders, is one of the most important principles of corporate governance (Gaa, 2009). Therefore, the transparency of sustainability reports is an appropriate proxy to assess the stakeholder perspective of a firm's corporate governance.
To assess transparency, Fernandez-Feijoo et al. (2014b) gathered the four characteristics mentioned above in a single variable. They measured frequency of reporting by computing the average number of sustainability reports that each firm published, with respect to the number of years analyzed. They measured the other three characteristics (level of application, declaration of the level and assurance) by computing the average number of times that the sustainability report fulfilled each characteristic with respect to the number of sustainability reports published by each firm during the period. We followed Fernandez-Feijoo et al. (2014b) methodology to measure these characteristics. We defined a reflective measurement model using them as indicators, given that the level of transparency of sustainability reports is a consequence of changes in these indicators. The transparency of a firm's sustainability report, and hence its stakeholder perspective, is reflected on the frequent disclosure of sustainability reports, the high level of application of the GRI guidelines, the declaration of that level by a third-party and the assurance of the sustainability report.
Independent variableBoard effectiveness, based on the shareholder perspective of corporate governance, is the independent variable. According to the literature review, we established a formative measurement model using the board characteristics determining board effectiveness as indicators. These characteristics are causally related to board effectiveness. They determine the effectiveness of boards in developing their roles under the shareholder perspective, in order to guarantee shareholder interest and increase shareholder value (see Table 1). Specifically, the formative indicators are size and independence of the board, CEO duality, presence of women on boards, directors’ experience, number of meetings and the establishment of specific board committees (one indicator per type of committee). Similarly to the measurement of the dependent variable, we defined each board characteristic as the average figure for its value between 2009 and 2012. A reflective measurement model could have also been established using the outcomes of board effectiveness as indicators, such as financial performance. However, these outcomes may be influenced by factors other than only by board effectiveness. So if we used them as reflective indicators, we could have captured other elements unrelated to board effectiveness. Thus, a formative measurement model for board effectiveness was seemingly better.
Control variablesWe included three additional variables (firm size, industry and country orientation) to control for their effect on the stakeholder perspective of the firm's corporate governance, measured as the transparency of the sustainability report. Prior research agreed on a positive effect of firm size on CSR reporting (Fifka, 2013; Hahn and Kühnen, 2013). Companies that operate in environmentally sensitive industries disclose better CSR information (Brammer and Pavelin, 2008; Young and Marais, 2012). Finally, firms from countries with a stakeholder-oriented system of corporate governance (code law countries) provide more transparent and reliable information by means of assuring their sustainability report than do those from countries with a shareholder-oriented system of corporate governance (common law countries) (Simnett et al., 2009).
We used the average logarithm of assets and sales during the periods as indicators for firm size. Regarding environmentally sensitive industries, we used a dichotomous variable as indicator. It takes the value of 1 if the firm operates in an industry that has an important impact on the environment. Following Castelo Branco and Lima Rodrigues (2008), Fernandez-Feijoo et al. (2014a,b) and Gamerschlag et al. (2011), we coded the following industries as environmentally sensitive: Applied resources, Automobile & auto parts, Chemicals, Energy – fossil fuels, Industrial & conglomerates services, Industrial conglomerates, Industrial goods, Mineral resources, Renewable energy, Transportation, Uranium and Utilities. Finally, we used a dichotomous variable that distinguishes whether the firm comes from a country with a stakeholder-oriented system of corporate governance as an indicator for the country's corporate governance system. According to Weimer and Pape (1999), the market-oriented system comprises Australia, Canada, United Kingdom and USA; while the network-oriented systems includes Austria, Belgium, Denmark, Finland, France, Germany, Italy, Japan, Netherlands, Norway, Spain, Sweden and Switzerland. The countries in the first group are common law countries, with a shareholder-oriented corporate governance model whereas the countries in the latter group are code law countries, with a stakeholder-oriented corporate governance model (Ball et al., 2000). We defined a reflective measurement model for each control variable using these indicators given that they are outcomes reflecting the behavior of the control variables.
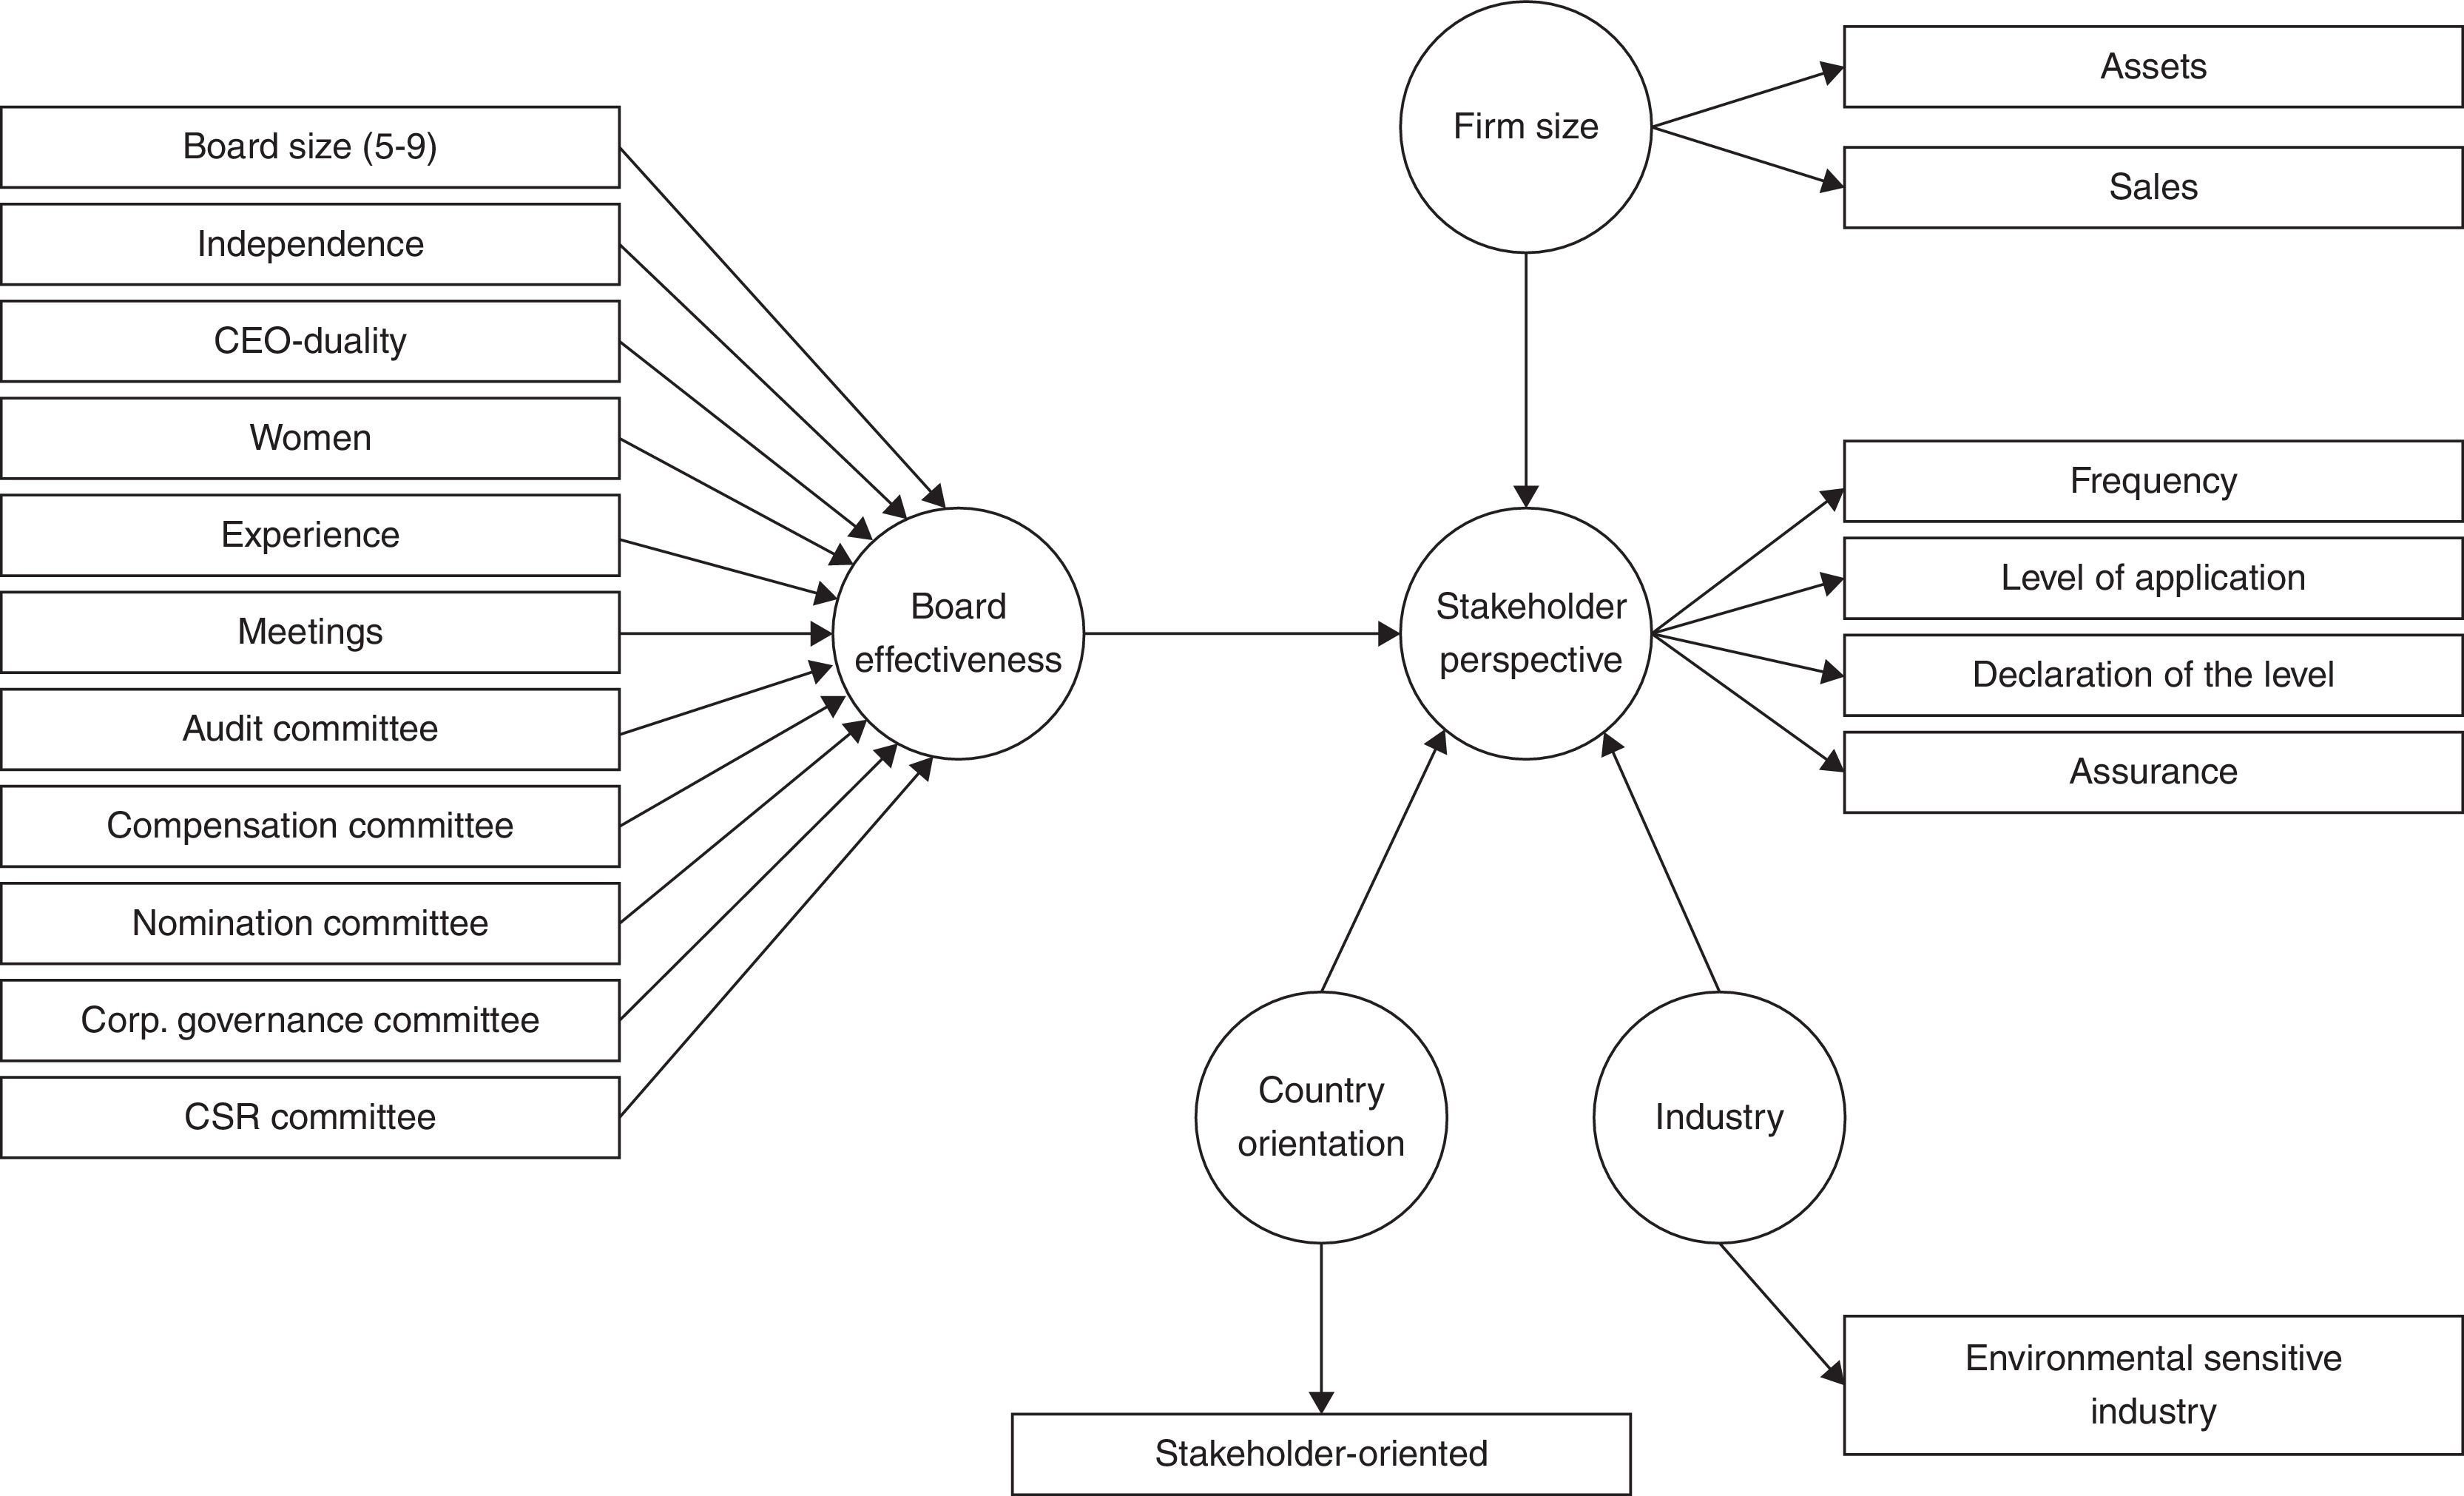
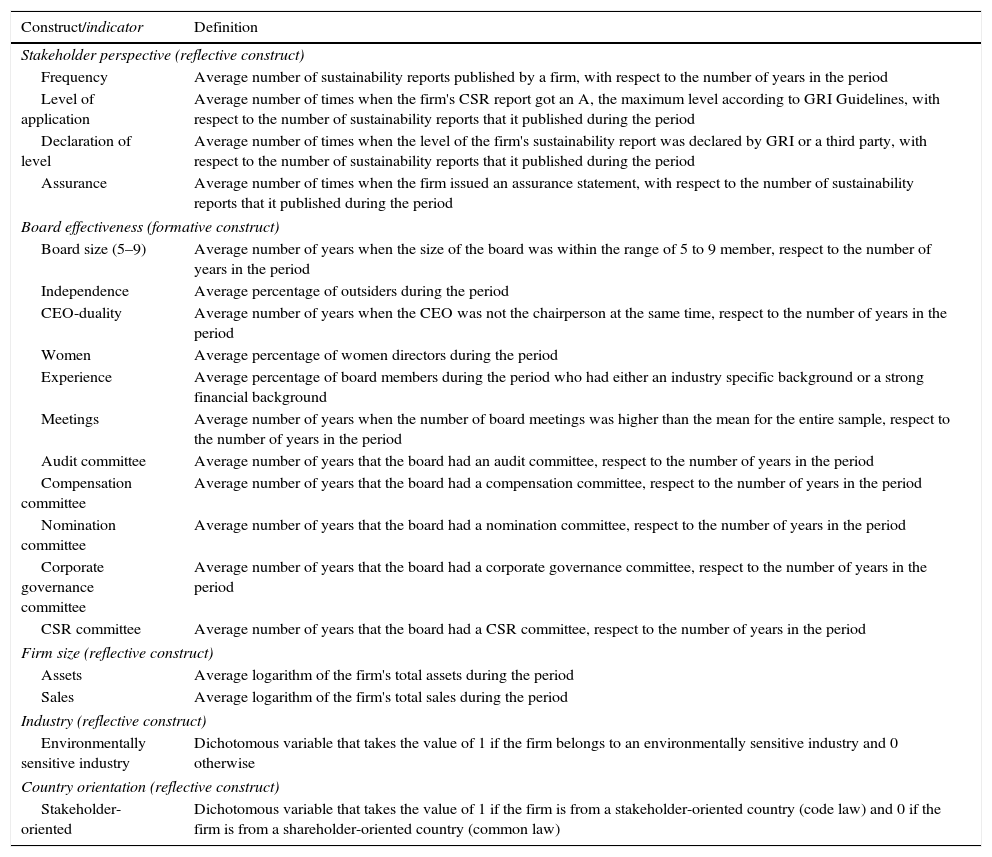
Table 2 summarizes the measurement models for each variable and the definitions of their indicators. Additionally, Fig. 1 graphically describes the established measurement and structural models.
Block of indicators for each construct and their definition.
| Construct/indicator | Definition |
|---|---|
| Stakeholder perspective (reflective construct) | |
| Frequency | Average number of sustainability reports published by a firm, with respect to the number of years in the period |
| Level of application | Average number of times when the firm's CSR report got an A, the maximum level according to GRI Guidelines, with respect to the number of sustainability reports that it published during the period |
| Declaration of level | Average number of times when the level of the firm's sustainability report was declared by GRI or a third party, with respect to the number of sustainability reports that it published during the period |
| Assurance | Average number of times when the firm issued an assurance statement, with respect to the number of sustainability reports that it published during the period |
| Board effectiveness (formative construct) | |
| Board size (5–9) | Average number of years when the size of the board was within the range of 5 to 9 member, respect to the number of years in the period |
| Independence | Average percentage of outsiders during the period |
| CEO-duality | Average number of years when the CEO was not the chairperson at the same time, respect to the number of years in the period |
| Women | Average percentage of women directors during the period |
| Experience | Average percentage of board members during the period who had either an industry specific background or a strong financial background |
| Meetings | Average number of years when the number of board meetings was higher than the mean for the entire sample, respect to the number of years in the period |
| Audit committee | Average number of years that the board had an audit committee, respect to the number of years in the period |
| Compensation committee | Average number of years that the board had a compensation committee, respect to the number of years in the period |
| Nomination committee | Average number of years that the board had a nomination committee, respect to the number of years in the period |
| Corporate governance committee | Average number of years that the board had a corporate governance committee, respect to the number of years in the period |
| CSR committee | Average number of years that the board had a CSR committee, respect to the number of years in the period |
| Firm size (reflective construct) | |
| Assets | Average logarithm of the firm's total assets during the period |
| Sales | Average logarithm of the firm's total sales during the period |
| Industry (reflective construct) | |
| Environmentally sensitive industry | Dichotomous variable that takes the value of 1 if the firm belongs to an environmentally sensitive industry and 0 otherwise |
| Country orientation (reflective construct) | |
| Stakeholder-oriented | Dichotomous variable that takes the value of 1 if the firm is from a stakeholder-oriented country (code law) and 0 if the firm is from a shareholder-oriented country (common law) |

Our dependent and independent variables are two latent constructs that cannot be measured directly. Therefore, we used a structural equation model analysis to test the influence of board effectiveness on the stakeholder perspective. This technique allows us to determine the relationship between latent variables using data from observable indicators (Williams et al., 2009). Structural equation models can be analyzed through two different sets of techniques: covariance-based methods and variance-based methods. In this study, we opted for a partial least squares regression (PLS), a variance-based method, for the following reasons (Chin, 2010; Roldán and Sánchez-Franco, 2012). First, we include a formative latent variable (BE) that can only be modeled using a PLS. Second, PLS focuses on the prediction of the dependent variable; hence it may be preferably used for a causal-predictive analysis. Finally, PLS requires soft distributional assumptions for the data which makes it applicable to a wide range of samples. The PLS analysis was performed using the SMART PLS 2.0 M3 software (Ringle et al., 2005).
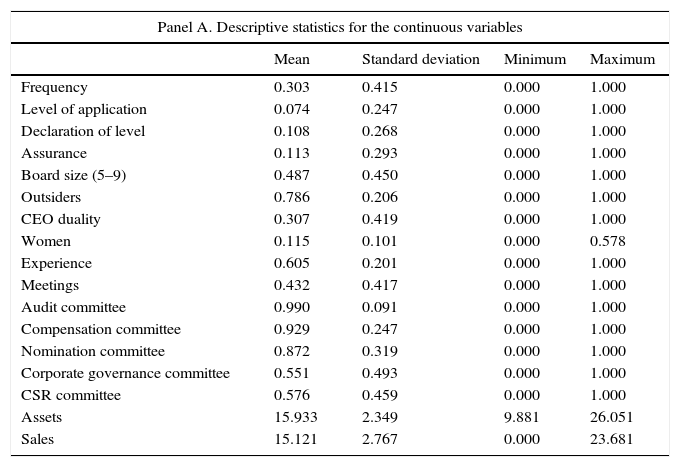
Results and discussionDescriptive statisticsTable 3 presents a descriptive summary of the indicators of each measurement model. Panel A shows the descriptive statistics of the indicators that are continuous variables while Panel B presents the frequencies of the dichotomous indicators. In terms of the stakeholder perspective, the firms published a sustainability report in 30.3% of the analyzed years on average. With respect to the number of sustainability reports that were published, 7.41% of them achieved the A level of the GRI guidelines, 11.3% were assured and the level of 10.8% of the reports was declared by a third-party.
Descriptive summary of the indicators.
| Panel A. Descriptive statistics for the continuous variables | ||||
|---|---|---|---|---|
| Mean | Standard deviation | Minimum | Maximum | |
| Frequency | 0.303 | 0.415 | 0.000 | 1.000 |
| Level of application | 0.074 | 0.247 | 0.000 | 1.000 |
| Declaration of level | 0.108 | 0.268 | 0.000 | 1.000 |
| Assurance | 0.113 | 0.293 | 0.000 | 1.000 |
| Board size (5–9) | 0.487 | 0.450 | 0.000 | 1.000 |
| Outsiders | 0.786 | 0.206 | 0.000 | 1.000 |
| CEO duality | 0.307 | 0.419 | 0.000 | 1.000 |
| Women | 0.115 | 0.101 | 0.000 | 0.578 |
| Experience | 0.605 | 0.201 | 0.000 | 1.000 |
| Meetings | 0.432 | 0.417 | 0.000 | 1.000 |
| Audit committee | 0.990 | 0.091 | 0.000 | 1.000 |
| Compensation committee | 0.929 | 0.247 | 0.000 | 1.000 |
| Nomination committee | 0.872 | 0.319 | 0.000 | 1.000 |
| Corporate governance committee | 0.551 | 0.493 | 0.000 | 1.000 |
| CSR committee | 0.576 | 0.459 | 0.000 | 1.000 |
| Assets | 15.933 | 2.349 | 9.881 | 26.051 |
| Sales | 15.121 | 2.767 | 0.000 | 23.681 |
| Panel B. Frequencies of the dichotomous variables | ||
|---|---|---|
| 1 | 0 | |
| Environmentally-sensitive industry | 0.459 | 0.541 |
| Country orientation | 0.296 | 0.704 |
Concerning board effectiveness, 48.7% of boards had a size within the range of 5–9 members suggested by Newell and Wilson (2002). On average, outsiders and women represented 78.63% and the 11.52% of the directors, respectively. The chairperson was not the CEO at the same time in 30.7% of the firms throughout the period. The proportion of directors with financial or industry-specific experience totaled 60%. Most boards had established audit, compensation and nomination committees (99.0%, 92.9% and 87.2% of the boards had one of them on average, respectively). However, only 55.1% and 57.6% of the boards had established corporate governance and CSR committees during over the period.
Regarding control variables, the average logarithms of assets and sales were 15.93 and 15.12. Firms operating in environmentally-sensitive industries represent the 45.90% of the sample. Finally, 29.6% of the companies were from countries with a stakeholder-oriented model of corporate governance.
Measurement modelFollowing Chin (2010), we analyzed the results of the PLS analysis in two steps. First, we evaluated the validity and reliability of the measurement models of the constructs. Each type of measurement model (formative or reflective) was analyzed based on different criteria (Mathieson et al., 2001). Thus, we evaluated the measurement model of the formative construct before analyzing the measurement models of the reflective constructs. Afterwards, we moved to the second step of the PLS results and analyzed the structural model, which determines the relationship between the constructs.
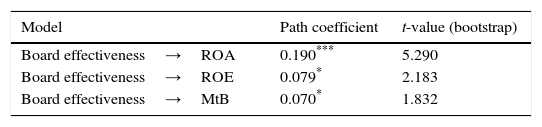
Formative construct (Board effectiveness)Formative measurement models are assessed at two levels: at the construct level (whether the formative construct carries the intended meaning) and at the indicator level (whether the indicators contribute to the construct by carrying the intended meaning) (Henseler et al., 2009). At the construct level, external validity requires determining whether the formative measurement model explains a high percentage of the variance of the same construct measured by the reflective indicators. To our knowledge, there are no alternative measures of board effectiveness through reflective indicators. Thus, we could not assess the external validity and we moved on to the next step (Chin, 2010). Nomological validity involves assessing the relationship between the formative construct and other variables, as identified by prior research (Henseler et al., 2009). Several studies have argued that board effectiveness under the shareholder perspective leads to higher firm performance (Duchin et al., 2010; John and Senbet, 1998). Therefore, we checked the relationship between our formative construct and three proxies for firm performance (ROA, ROE and market-to-book ratio) (Table 4). The results show the expected positive and significant effect of board effectiveness in the three cases. Although the path coefficients are of small magnitude, they are significant due to the large size of the sample.
Analysis of the nomological validity of the formative construct.
| Model | Path coefficient | t-value (bootstrap) |
|---|---|---|
| Board effectiveness→ROA | 0.190*** | 5.290 |
| Board effectiveness→ROE | 0.079* | 2.183 |
| Board effectiveness→MtB | 0.070* | 1.832 |
ROA, return on assets; ROE, return on equity; MtB market-to-book ratio.
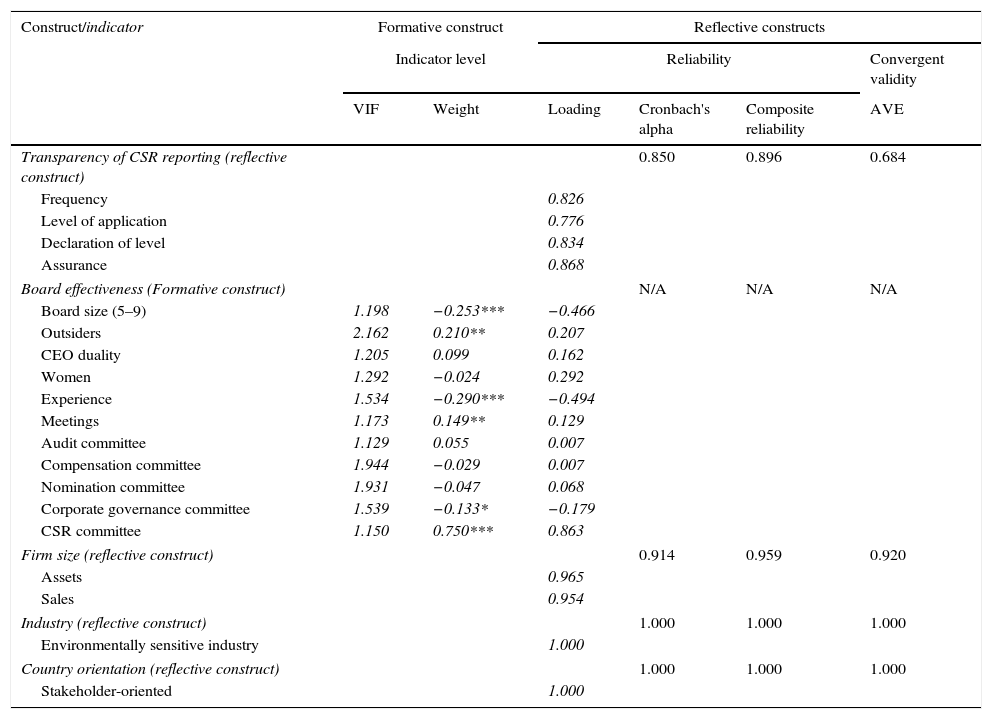
At the indicator level, potential multicollinearity among the indicators should be analyzed first because it might yield unstable estimates (Mathieson et al., 2001). To test for multicollinearity between the formative indicators, we calculated the variance inflation factor (VIF) using SPSS v.20. Table 5 presents the main statistics used to assess the measurement models of both the formative and reflective constructs. As shown in the table, there is no multicollinearity because our highest VIF (1.944) is below the threshold of 3.3 suggested by Roberts and Thatcher (2009). Afterwards, we evaluated the weights of the formative indicators, which rank their contribution in building the construct. Table 5 shows that six indicators significantly contribute to the construct. The weights are calculated through a regression of the latent variable scores with the formative indicators as independent variables (Hair et al., 2014). This method reveals that three indicators, despite having the lowest negative weights, are significant because they also have negative loadings. Indicators with no significant weights should not be removed due to statistical results as long as their inclusion is justified (Henseler et al., 2009). Thus, we left the five indicators that had no significant weights because their inclusion was supported by previous research, as previously discussed.
Analysis of formative and reflective measurement models.
| Construct/indicator | Formative construct | Reflective constructs | ||||
|---|---|---|---|---|---|---|
| Indicator level | Reliability | Convergent validity | ||||
| VIF | Weight | Loading | Cronbach's alpha | Composite reliability | AVE | |
| Transparency of CSR reporting (reflective construct) | 0.850 | 0.896 | 0.684 | |||
| Frequency | 0.826 | |||||
| Level of application | 0.776 | |||||
| Declaration of level | 0.834 | |||||
| Assurance | 0.868 | |||||
| Board effectiveness (Formative construct) | N/A | N/A | N/A | |||
| Board size (5–9) | 1.198 | −0.253*** | −0.466 | |||
| Outsiders | 2.162 | 0.210** | 0.207 | |||
| CEO duality | 1.205 | 0.099 | 0.162 | |||
| Women | 1.292 | −0.024 | 0.292 | |||
| Experience | 1.534 | −0.290*** | −0.494 | |||
| Meetings | 1.173 | 0.149** | 0.129 | |||
| Audit committee | 1.129 | 0.055 | 0.007 | |||
| Compensation committee | 1.944 | −0.029 | 0.007 | |||
| Nomination committee | 1.931 | −0.047 | 0.068 | |||
| Corporate governance committee | 1.539 | −0.133* | −0.179 | |||
| CSR committee | 1.150 | 0.750*** | 0.863 | |||
| Firm size (reflective construct) | 0.914 | 0.959 | 0.920 | |||
| Assets | 0.965 | |||||
| Sales | 0.954 | |||||
| Industry (reflective construct) | 1.000 | 1.000 | 1.000 | |||
| Environmentally sensitive industry | 1.000 | |||||
| Country orientation (reflective construct) | 1.000 | 1.000 | 1.000 | |||
| Stakeholder-oriented | 1.000 | |||||
N/A: not applicable.
Weight significant at * p<0.05, ** p<0.01, *** p<0.001 (based on t(4999, two-tailed test)).
Based on this assessment, we concluded that the formative measurement model for board effectiveness, based on the shareholder perspective, is valid.
Reflective constructs (stakeholder perspective of the firm's corporate governance, firm size, industry, and country orientation)Reflective measurement models are assessed based on their reliability and validity (Chin, 2010). Individual item reliability evaluates the component of the variance of the indicator explained by the construct. To meet this criterion, the construct should explain at least 50% of the variance of the indicator, which implies that the indicator has a loading above 0.707. Therefore, all of the reflective indicators fulfilled individual item reliability (Table 5). The next step focuses on the construct reliability, which determines whether all of the reflective indicators of a construct measure the same latent variable. The four reflective constructs meet this requirement as the Cronbach's alpha and the composite reliability are both above the suggested 0.7 threshold.
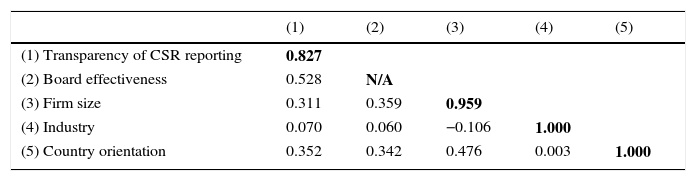
In terms of validity, convergent validity implies that each block of reflective indicators stands for the one and only construct they are supposed to measure (Henseler et al., 2009). To satisfy convergent validity, the average variance extracted (AVE) should be above 0.5 (Fornell and Larcker, 1981). Thus, the four reflective constructs achieve convergent validity (Table 5). Finally, discriminant validity requires that the different conceptual constructs be sufficiently different from each other (Henseler et al., 2009). Discriminant validity is demonstrated when the square root of the AVE of a construct is higher than the correlations between this construct and the others. Table 6 presents comparative square roots of the AVEs and the correlations between the constructs. The results show that discriminant validity is fulfilled. These outputs indicate that each reflective construct is more strongly related to its indicator than to the other constructs.
Discriminant validity of the reflective constructs.
| (1) | (2) | (3) | (4) | (5) | |
|---|---|---|---|---|---|
| (1) Transparency of CSR reporting | 0.827 | ||||
| (2) Board effectiveness | 0.528 | N/A | |||
| (3) Firm size | 0.311 | 0.359 | 0.959 | ||
| (4) Industry | 0.070 | 0.060 | −0.106 | 1.000 | |
| (5) Country orientation | 0.352 | 0.342 | 0.476 | 0.003 | 1.000 |
Elements in the diagonal (bold) are the square roots of the AVE.
Off-diagonal elements are the correlations among the constructs.
N/A: not applicable.
Therefore, based on our evaluation of the four criteria, the measurement models of the four reflective constructs are valid and reliable.
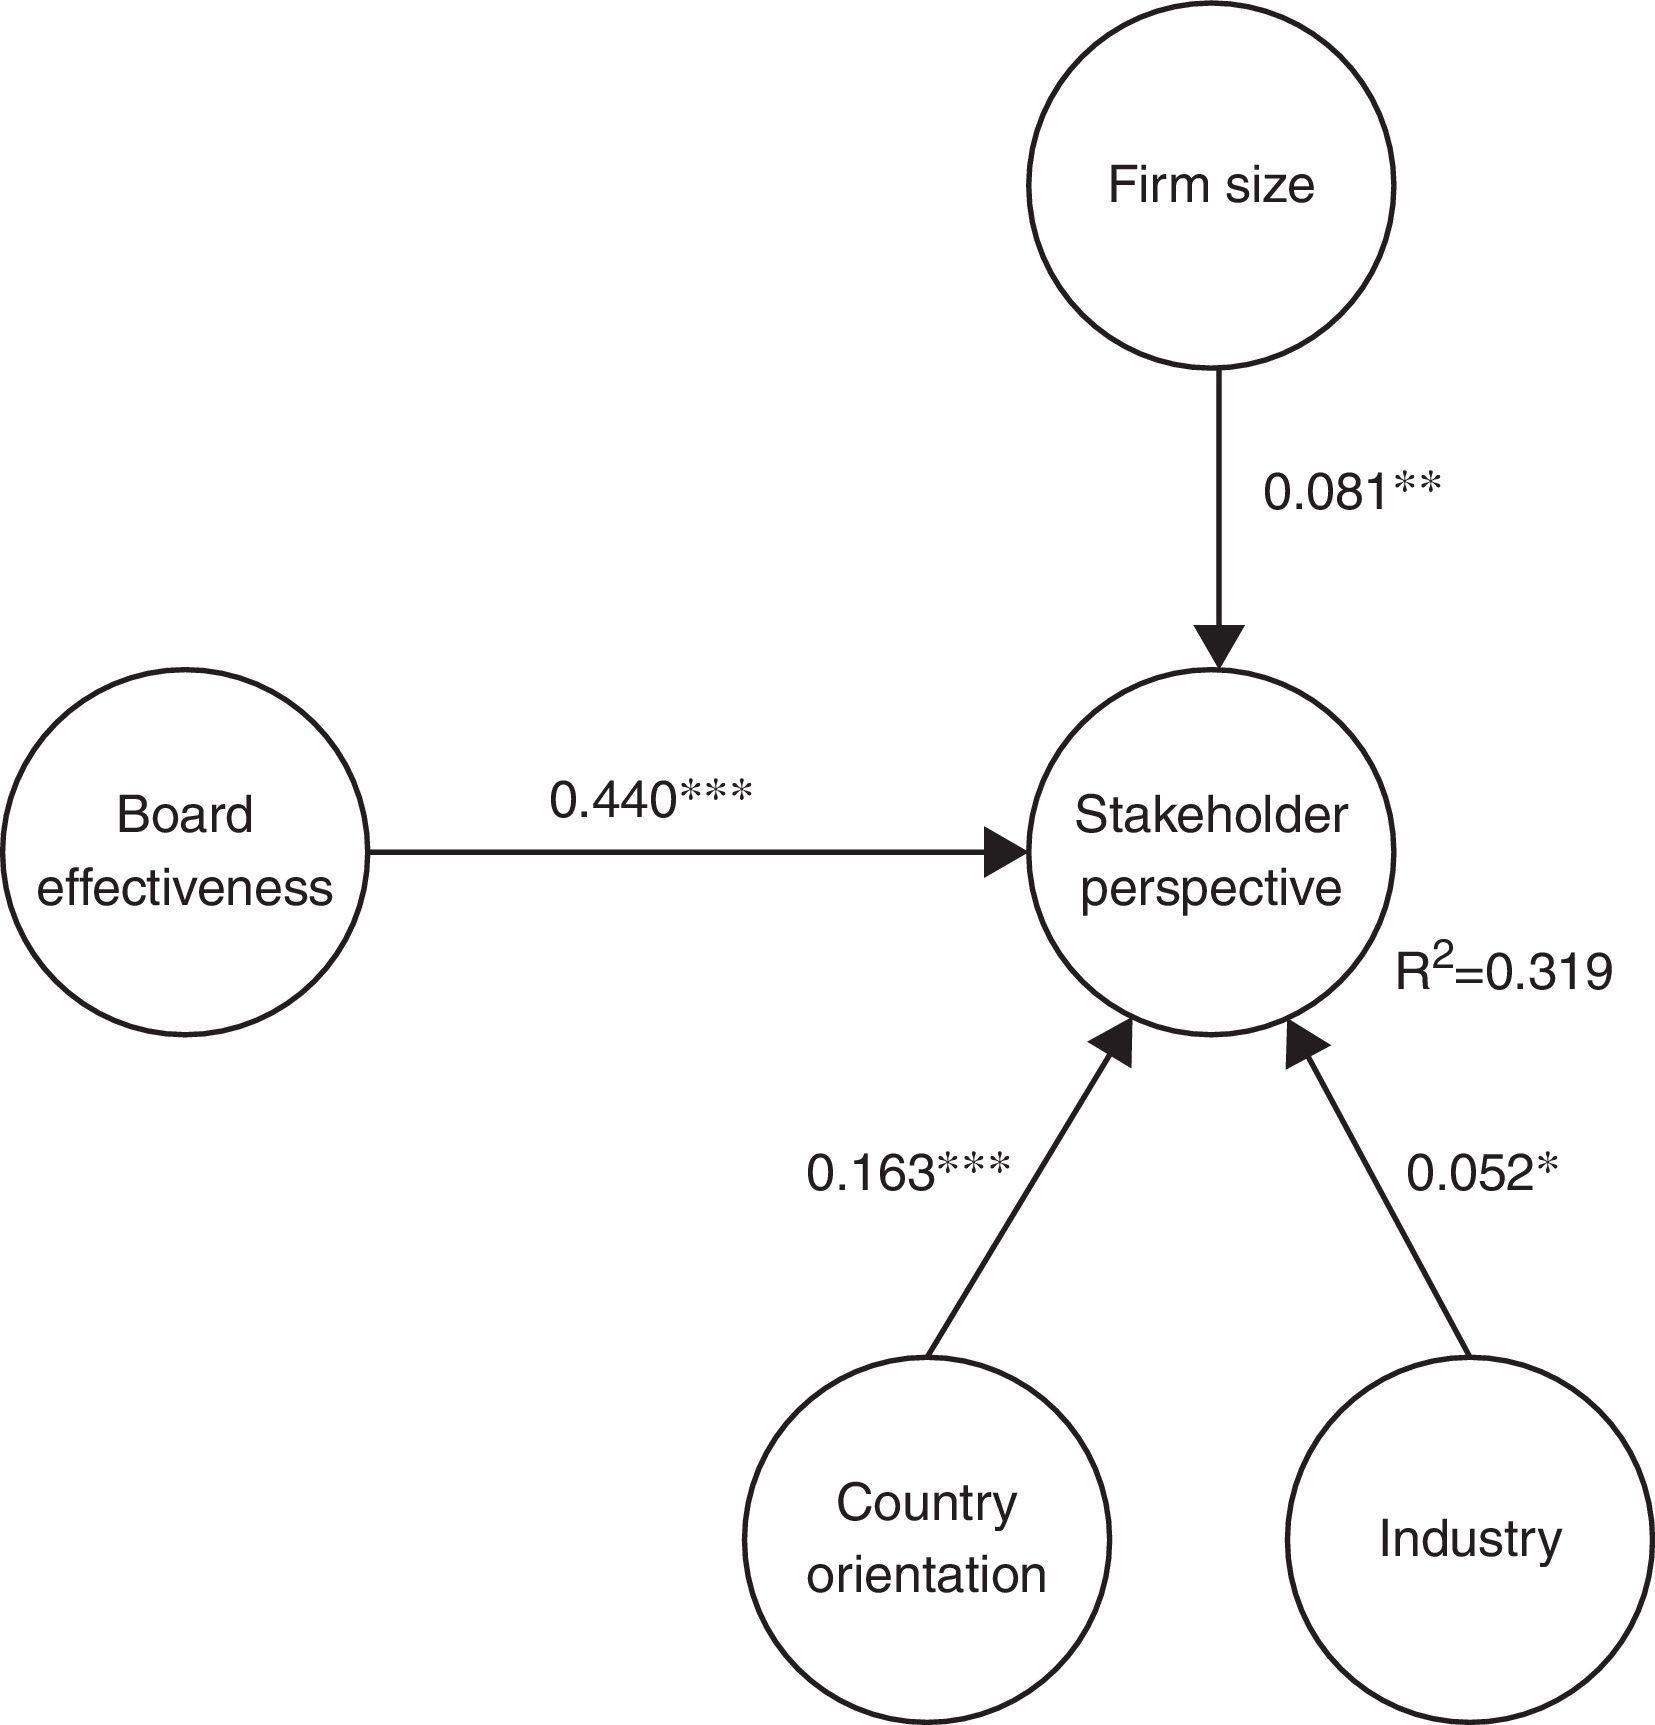
Structural modelFig. 2 presents the R2 of the dependent variable and the path coefficients of the exogenous variables. The R2 evaluates the predictive power of the structural model (Chin, 2010). Our model has a R2 of 31.9%, which is close to the moderate prediction level of 33% suggested by Chin (1998).
).")
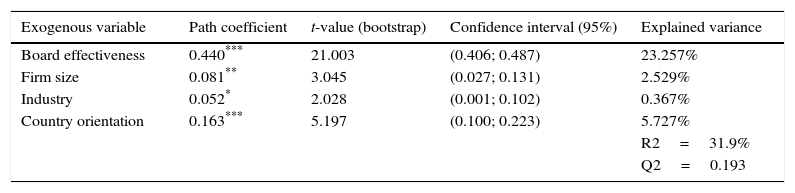
We used a bootstrapping procedure of 5000 resamples to test the significance of the path coefficients and calculate the confidence intervals. Table 7 presents the results of the regression, the bootstrapping, and the variance of the dependent variable explained by each exogenous variable. The t-values and the confidence intervals both show that the four exogenous variables have a positive and significant influence on the stakeholder perspective of the firm's corporate governance. Therefore, we accept our hypothesis. In particular, board effectiveness (path=0.440, t-value=21.003) has the most important effect given that it explains 23.257% of the variance of the dependent variable. This is followed by the orientation of the country (path=0.163, t-value=5.197), firm size (path=0.081, t-value=3.045) and industry (path=0.052, t-value=2.028).
Effects on transparency of CSR reporting.
| Exogenous variable | Path coefficient | t-value (bootstrap) | Confidence interval (95%) | Explained variance |
|---|---|---|---|---|
| Board effectiveness | 0.440*** | 21.003 | (0.406; 0.487) | 23.257% |
| Firm size | 0.081** | 3.045 | (0.027; 0.131) | 2.529% |
| Industry | 0.052* | 2.028 | (0.001; 0.102) | 0.367% |
| Country orientation | 0.163*** | 5.197 | (0.100; 0.223) | 5.727% |
| R2=31.9% | ||||
| Q2=0.193 |
The significance of the path coefficients and their confidence intervals were calculated using a bootstrapping procedure of 5000 resamples.
We apply the Stone-Geisser test (Chin, 1998) to corroborate the predictive relevance of the model. The Q2 statistic of this test is above the minimum threshold of 0 (Q2=0.193). Therefore, the results confirm the predictive relevance of the dependent variable.
We also run the regression considering if the company belongs to a socially sensitive industry, to check if our main result holds for this additional model (the results of this regression are not reported for the sake of brevity). We found that board effectiveness continue to have a positive and significant effect on the stakeholder perspective. The rest of the independent variables have similar significance and signs as in the first model, unless the new industry variable, which is non-significant.
DiscussionOur main result indicates that board effectiveness positively influences the transparency of sustainability reports as a proxy for the stakeholder perspective of the firm's corporate governance. As expected, this relationship shows that board effectiveness under the shareholder perspective of corporate governance is also a valid construct under the stakeholder perspective. This result implies that boards effective in protecting shareholder value are also effective in responding to the interests of the rest of the firm's stakeholders.
Our main finding is consistent with that of Webb (2004), who found that boards of socially responsible firms have more outside and female directors, and their CEO is less-likely to be the chairperson than boards in non-socially responsible companies. Based on her findings, she suggested that the causal relationship between these characteristics of board structure and being a socially responsible firms should be analyzed. Our result partially contribute to this call, as we found that board effectiveness in protecting shareholder interests, which includes the characteristics reported by Webb (2004), have a positive effect on the firm's response to stakeholder interests. Our finding is also consistent with the result of Ntim and Soobaroyen (2013), who found that better-governed firms are more likely to engage in CSR activities and that a combination of good corporate governance mechanism, such as board of directors, and good CSR practices leads to higher financial performance.
Our findings also suggest that, although the shareholder and the stakeholder perspectives might initially be considered as opposing approaches (Letza et al., 2004), this is not the case. Consistently with Money and Schepers (2007), our results indicate that these approaches have a similar orientation but they differ in scope. The shareholder perspective shows a narrow scope. It considers that corporate governance mechanisms should only contribute to protecting shareholder interests and increasing firm value. In contrast, the stakeholder perspective shows a wider scope and considers that the firm's corporate governance mechanisms should guarantee the interests of all the stakeholders. This perspective includes shareholders as a specific type of stakeholders. Our findings show that the scope of board effectiveness broadens as the perspective of corporate governance broadens. Our result reinforces the idea that shareholder interests are also advocated under the emergent stakeholder perspective.
Our results may also be explained by the fact that the interests of shareholders are expanding and these shareholders are giving greater importance to CSR. This is particularly the case of significant shareholders. As a consequence of their long-term interest in the firm, they are more likely to invest in CSR (Godos-Díez et al., 2014). In addition, these shareholders are concerned about maintaining their reputation, which is closely linked to that of their corporations and may be preserved through CSR (Anderson et al., 2003). Thus, the interests of shareholders are becoming partially aligned with those of the rest of stakeholders. Therefore, in consonance with our results, when a board of directors promotes CSR practices and reporting, it is also effective in considering the interests of significant shareholders all at the same time.
All of the control variables were found to have the expected significant and positive effect on the stakeholder perspective, using the transparency of sustainability reports as a proxy. Consistent with previous research (Fifka, 2013; Hahn and Kühnen, 2013), we found that larger companies are more likely to offer more transparent CSR information. Firms operating in environmentally-sensitive industries also produce more transparent sustainability reports. As Young and Marais (2012) concluded, companies belonging to these industries provide better CSR reporting to gain legitimacy. Finally, firms from stakeholder-oriented countries publish more transparent sustainability reports. This result corroborates that of Simnett et al. (2009), who reported that companies from those countries assure their sustainability reports more. It also corroborates the result of Young and Marais (2012), who found that companies from stakeholder-oriented countries disclose better CSR information than do those from shareholder-oriented countries.
ConclusionsIn this paper, we study whether boards effective in protecting shareholder interests are also effective in guaranteeing the interests of the rest of the firm's stakeholders. To do so, we developed a measure of board effectiveness, based on the shareholder perspective, and analyzed whether it also promotes the stakeholder perspective of the firm's corporate governance. We used transparency of sustainability reports as a proxy for the stakeholder perspective and we established a structural equation model that was estimated through a PLS regression. Using a sample of 2366 companies from 17 countries, we found that board effectiveness has a positive and significant effect on the stakeholder perspective of the firm's corporate governance. Additionally, we found that large firms, firms that operate in environmentally sensitive industries and firms that are from countries with a stakeholder-oriented system of corporate governance are more likely to address the interests of all of the firm's stakeholders by issuing more transparent sustainability reports.
CSR is an important element in corporate strategy that can lead to competitive advantages, innovation and opportunities (McWilliams et al., 2006; Porter and Kramer, 2006; Smith, 2003). Additionally, some studies point out that financial markets value the disclosure of transparent sustainability reports (Reverte, 2012; Carnevale et al., 2012). On the other hand, our main result indicates that effective boards of directors contribute to guaranteeing the interests of the rest of the stakeholders as well as those of the shareholders themselves. So the premise that CSR, based on the consideration of all of a firm's stakeholders, only represents a cost that should be avoided seems to not be the case anymore.
Based on our results, the contribution of this paper to the literature on corporate governance is two-fold. First of all, we demonstrate that board effectiveness based on the shareholder perspective of corporate governance may also be applied to the stakeholder perspective. Board effectiveness can be asserted to promote the protection of the interests of all the stakeholders of a firm, within which the shareholders conform a particular group. As Money and Schepers (2007:8) claimed: “there is an increasing awareness that there cannot be shareholder value without stakeholder value.”
Secondly, we respond to “the need for a better understanding of all elements that determine board effectiveness” (Van den Berghe and Levrau, 2004:461). To our knowledge, this paper is a first attempt to capture and measure board effectiveness in a single variable. We establish a measurement model for board effectiveness using the demographic characteristics of boards previously found to have affected board task performance.
In addition, this paper specifically contributes to research on the relationship between CSR reporting and boards of directors. We demonstrated that companies with more effective boards tend to provide more transparent sustainability reports.
Finally, our results have implications for policy makers. Many characteristics of boards that drive board effectiveness (e.g., a majority of outsiders, increased female representation, CEO-chairman separation, the establishment of committees, etc.) are suggested in Codes of Best Practices all over the world (Adams and Ferreira, 2009; Denis and Mcconnell, 2014). We have demonstrated that, by introducing these recommendations, codes may improve board effectiveness to protect the interests of all the stakeholders of a company, including those of the shareholders.
These findings should be viewed in light of some limitations. All of the firms analyzed are public because information on boards of directors of non-listed companies is not easily accessible. Shareholders are important stakeholders for those firms that financially depend on the market. Our results may be influenced by the relevance of shareholders as a specific group of stakeholders in our sample. Additionally, mainstream corporate governance research postulates that board behavior and processes are more critical than demographic characteristics in determining board effectiveness (Forbes and Milliken, 1999; Minichilli et al., 2009, 2012). This study represents a first attempt to capture board effectiveness in a single variable, so we used demographic variables because they are more objective and may be directly measured (Pfeffer, 1983). Finally, we note that the dependent and independent variables refer to the same time period. This could affect the capacity to infer causality. We built our variables by gathering information from the years 2009–2012. The use of lagged data for the independent variables would not have been a solution. Some years would continue to be included in both types of variables. Moreover, this could have reduced the size of the sample given that data on board characteristics of some firms was unavailable for the year 2008.
This paper offers directions for future research. First, the sample should be extended by including non-listed corporations to check for possible differences between quoted and non-quoted firms. Second, it would be interesting to develop a measurement model of board effectiveness based on behavioral and procedural aspects of the board and check its correlation with the measurement model presented in this paper. Additionally, we analyzed how board effectiveness, under the shareholder perspective, impacts on the stakeholder perspective. Future research should analyze whether the causal relationship could also be the opposite: whether being concerned about stakeholder interests could be a precursor of effectively responding to shareholder interests. Finally, the use of PLS also provides another course of research. This technique quantifies the value of the latent variable board effectiveness for each company. So, it could prove interesting to analyze whether industry or geographic factors influence this variable.
We would like to acknowledge the financial support of ECOBAS – Xunta de Galicia (AGRUP2015/08) for this research.
articles