


Using a large sample of firms from 37 countries over the period of 2007–2015, we empirically analyse the impact of religion and national culture characteristics on the level of corporate risk-taking around the world and the channels through which this can take place. First, we initially observe that different religious backgrounds have different impacts on corporate risk-taking, these being negative for Catholic and Islamic-based countries and positive for firms in Protestant nations. Secondly, we observe that companies in countries with high scores of power distance, masculinity, individualism and long-term orientation tend to increase risk-taking while high levels of uncertainty avoidance moderates corporate risk-taking behavior. We also show results that in companies where institutional investors are the most relevant reference shareholder the influence of religion on corporate risk-taking is not felt, unlike when the main shareholder is an individual or a family.
Excessive corporate risk-taking is a particularly important topic given that it is usually pointed out as a direct cause of the recent 2007–08 financial crisis (see for instance Erkens et al., 2012 as well as a survey of senior managers conducted by KPMG, 2009). Thus, better understanding which factors can influence corporate risk-taking is crucial for investors, regulators and indeed all major remaining stakeholders. Extant research usually focuses on governance, ownership structure and incentive systems as the direct causes of corporate risk taking and is typically more concerned with the financial sector (ex. Laeven and Levine, 2009; Coles et al., 2006; Kempf et al., 2009; Conyon et al., 2011; Berger et al., 2016). We take the view that, notwithstanding the above factors, both religion and culture are dimensions that need also to be considered in explaining corporate risk-taking decisions (for both financial and non-financial firms).
In our paper, we seek to develop further the literature that connects corporate risk taking with culture by introducing a religious dimension and extending the analysis to include explicit interactions between the national culture and religion, notably by taking into account the major religion groups in the world, while using an extensive sample of observations. Although religion and culture have been the subject of a vast literature in many areas of study, research on these subjects in the field of economics is relatively new and more limited, especially in the specific field of financial economics (see Iyer, 2016 for a survey on Religion and Economics, and Beugelsdijk and Maseland, 2011, and Reuter, 2011, for literature reviews on Culture and Economics). In this paper we seek to fill some of that void by using a large sample of 34,251 observations for the period 2007–2015 encompassing 37 different countries to analyse if, and how, religion and national culture characteristics impact on the risk-taking behaviour of listed companies across different countries and industries, and try to shed a light on potential interactions between these two dimensions.
In a recent paper, Minkov and Hofstede (2014) conclude, on the basis of a survey on personal values, that national culture influence is a much stronger influence than global religions. In our research we seek to verify if indeed such assertion that religion plays a secondary role (or no role at all) truly holds in the determination of corporate risk-taking around the world. We also attempt to verify if any interactions exist between the cultural and religious dimensions for explaining the observable corporate behaviour towards the assumption of risks.
The remainder of this paper is organized as follows. Section 2 reviews previous research on the relations between national culture, religion and corporate risk-taking and formulates our hypotheses. Section 3 describes the sample and variables and explains the empirical methodology. Section 4 shows the empirical results and assesses the degree to which our initial hypotheses are confirmed or not. The final section draws our major conclusions and suggests some directions for future research.
Literature review and hypotheses developmentReligion and corporate risk-takingAs Kanagaretnam et al. (2015) state, the culture of a nation involves many dimensions such as language, education, ethnic background and religion. In fact, religion should be considered more ancient than other cultural values (Guiso et al., 2004, 2008). Thus, a country’s principal religion background becomes a relevant dimension to be considered in the study of a company’s decision-making process.1
Although religion has long been part of the economic though (cf. the studies of the Spanish School in the XVI Century or Smith, 1976), research in the field known as ``economics of religion’’ is relatively new (Iyer, 2016). Whereas early works studied the motivations that individuals might have to hold religious beliefs (Ekelund et al., 2002), more recent research is focused quite heavily on the socioeconomic consequences of religion, using economic theory and more sophisticated statistical tools. In fact, research in accounting and finance increasingly focuses on the link between religion and corporate decision-making, emphasizing two aspects: (1) the role of religion as an external monitoring mechanism and (2) its relationship to risk aversion (Kanagaretnam et al., 2015). Thus, and following the seminal study by Iannaccone (1998), we address the religious issue by studying religion as an independent variable on risk attitudes.2
Most of previous research on the role of religion in firms and corporate risk-taking, focuses on the religiosity differences within a country. For instance, Hilary and Hui (2009) investigate how a firm’s investment decisions are affected by the religiosity of its environment. Shu et al. (2011) link local religiosity to risk taking by mutual funds. Kumar et al. (2011) see religion as a proxy for gambling propensity and relate geographical heterogeneity in religion to differences in corporate decisions and stock returns. Their findings suggest a positive association between religiosity and risk aversion.3 Nevertheless, while the literature is quite clear about the fact that religious people of any faith generally display greater risk aversion,4 it is unclear regarding differences across religious groups. Besides, previous research mainly focuses on the differences between Christian denominations.
Traditionally, OECD countries can be divided into four groups, depending on the religious background: Catholic/Orthodox,5 Protestant, Muslim and Eastern Religions (including, Buddhist, Hindus and Taoists) (Iannaccone, 1998).
The distinction between Christian denominations derives from the different treatment given to creditors’ and investors’ rights that resulted from the Calvinist Reform in the XVI Century.6 What distinguishes Catholic social thought7 from the Protestant culture is that it does not regard private property and its economic benefits as absolute goods, but as those that are subject to the good of society. In fact, this view holds that those responsible for business enterprises have an obligation to consider the good of persons and not only the increase in profits (Bainbridge, 2002).8 On the contrary, Protestant thought is based on the idea that individuals are responsible for their own actions (Luther’s free exam) and, thus, each individual determines on his own what is right. In that sense, the existence of such a common good for Catholics prevents competition in contrast to Protestants (Stulz and Williamson, 2003).
Furthermore, Catholic faith emphasizes private charity, very useful where society lacks formal structures, such as insurance markets and government welfare programs, to deal with individual uncertainty (McCleary and Barro, 2006). In contrast, Protestant value highly economic success, but charitable acts are downplayed, as going against God’s will.9
Thus, considering these two different points of view among the two main Christian denominations, we postulate our first hypothesis.Hypothesis 1 There is a positive (negative) relation between a nation´s Protestant (Catholic/Orthodox) background and corporate risk-taking.
Although, like Christianity, Islam emphasizes exclusivity, claiming that there is only one way to heaven, there is a big difference between the two major religions in the world: the link between faith and reason. Indeed, Islam is legalistic, stressing the fulfilment of laws that are communally enforced (Michalopoulos et al., 2016) rather than a faith that should be subject to thought. Islamic belief has clear guidelines, based on the five pillars of faith, for improving a person’s chances of an after-death life (Voll, 1982), and a good example can be find in the characteristics of Islamic banking (Alnahas et al., 2017). Two of the fundamental principles of Islamic banking are the sharing of profit and loss and the prohibition of the collection and payment of interest by lenders and investors (Iqbal and Molyneus, 2005).
From an Islamic perspective of corporate governance practices, previous literature has detected the so-called ``negative Islamic effect’’: a common, systematic and undiversifiable risk factor that negatively affects cross-sectional expected returns in Islamic stock returns in Saudi Arabia (Merdad et al., 2015). Besides, Chee-Wooi and Ali (2017) show that firms with Muslim CEOs have weaker performance.
In such a context, promoting riskier decision would be seen as not contributing to the welfare of the society, given that what directs financial decisions is not value creation, but to follow the guidelines for appropriate religious behaviour (Voll, 1982).
Hence, our second hypothesis is defined as follows:Hypothesis 2 There is a negative relation between a nation´s Islamic background and corporate risk-taking.
Lastly, we must refer to Eastern religions. Although the importance of Eastern countries in global economy is growing (Cohn, 2016), most of previous research has just adapted Western postulates to those countries, forgetting their cultural and religious particularities.
Whereas in most Western societies a rejection of mainstream religion’s claims clearly represents a form of risk-taking (Adhikari and Agrawal, 2016), in many Eastern societies, where Buddhism, Hinduism or Shinto are the dominant religious traditions, the risk of non-participation is more unclear. Following Iannaccone’s (1998) and Miller (1992, 1995), individuals in Eastern societies create their own strategies for obtaining religious goals, and this often comprises selection and choosing from a diversity of religious and secular philosophies. Additionally, Eastern religious traditions are grounded on the consequences of a person’s individual behaviour (e.g. the laws of karma). Hence, while religions offer a personal guidance on appropriate behaviour, it is ultimately the behaviour itself and not the religious affiliation that is supposed to be effective.
The three main Eastern religions (Buddhism, Hinduism and Shinto) teach that one’s individual actions, not one’s religious affiliation or the performance of prescribed rituals, are what ultimately determine the quality of one’s afterlife reward. Consequently, in such a cultural setting, becoming part of a specific religion becomes irrelevant and, therefore, does not necessarily constitute a specific risk-taking behaviour.
Accordingly, our third hypothesis is the following:Hypothesis 3 There is no relation between a nation’s Buddhist, Hindu or Shinto background and corporate risk-taking.
Agency theory states that companies' assumption of risk may be conditioned by the different shareholders, managers or creditors’ attitudes towards risk (Kubicek et al., 2013), as well as the possibility of obtaining private benefits associated with the adoption of such risk.
In the previous section we have developed a set of hypotheses considering that the dominant religion of a country is likely to influence the financial decisions of companies in that country (Salaber, 2013). Developing deeper that statement and following the social identity and social impact theory (Hogg and Abrams, 1988), we take the view that “the predominant local religion could influence local cultural values and norms and consequently affect the financial and economic decisions of individuals located in that region, even if they do not personally adhere to the dominant local faith” (Kumar et al., 2011). Furthermore, we also take the perspective that “individuals have less control over their culture than over other social capital. They cannot alter their ethnicity, race or family history, and only with difficulty can they change their country or religion. Because of the difficulty of changing culture and its low depreciation rate, culture is largely ‘given’ to individuals throughout their lifetimes’’ (Becker, 1996) Additionally, religious practices, even when they respond to economic circumstances, can change through time only over centuries or even millennia (Botticini and Eckstein, 2005).
The reality is that a given shareholder may hold a distinct nationality from its country of residence, but given that religion is difficult to be changed, the only relevant dimension to be considered is what refers to national culture. Thus, and going further than previous work, we consider that shareholder nationality becomes a relevant dimension to be considered (Sanchirico, 2015; Lester, 2015), as there may be a divergence between a certain company’s ‘nationality’ (commonly related to where its headquarters are located) and that company’s shareholder national heterogeneity.
Previous literature has shown considerable differences in terms of the institutional environment and has also revealed that numerous companies in our environment are characterized by the simultaneous presence of several large shareholders. Indeed, it has been observed that agency relationships and conflicts between different types of shareholders may be more significant than the separation of ownership and control in most companies of the OECD countries (Bennedsen and Nielsen, 2010; Konjin et al., 2011; Ruiz and Santana, 2011).
Firms with a higher concentration of ownership present higher levels of profitability (Hu and Izumida, 2008) and achieve higher productivity (Claessens and Djankov, 1999). More specifically, Shleifer and Vishny (1986) argue that large shareholders have the means to direct companies towards projects with higher levels of risk and, following Hill and Snell (1988), these shareholders may discourage companies from engaging in unrelated investment strategies. Therefore, it seems that companies with a reference shareholder assume higher levels of risk and, given the relationship between profitability and risk, tend to obtain better results in the long run (Díez-Esteban et al., 2013; Nguyen, 2011).
In this context, the monitoring role10 of other reference shareholders becomes relevant and we ask whether that role is different in terms of national culture.11 Considering that, to a greater or lesser extent, other reference shareholders influence the major shareholder decisions (Attig et al., 2008, 2009; Laeven and Levine, 2008; Maury and Pajuste, 2005), we analyse whether that monitoring role is more relevant when there is no culture heterogeneity among shareholders or, on the contrary, if that role is more difficult to be exercised when other reference shareholders have different national cultures.
In the presence of heterogeneity between other reference shareholders’ nationality, reaching agreements to monitor the main shareholder may turn out to be more difficult. In this context, a reference shareholder may have fewer barriers in promoting riskier investments.
Thus, we posit our fourth hypothesis as follows:Hypothesis 4 There is a positive relation between nationality heterogeneity among non-main reference shareholders and corporate risk-taking.
Culture has been recently the subject of considerable research in Economics even though with just limited attention in the field of Finance (Karolyi, 2016). As individuals make economic decisions in the presence of incomplete information and with limited or no previous experience, they tend to rely on prior beliefs as a basis for their choices, which is to a great extent shaped by culture. Hofstede (1980) considers culture to be a collective programming of the mind that distinguishes different groups of individuals while Guiso et al. (2006, p. 23) define culture as “those customary beliefs and values that ethnic, religious, and social groups transmit fairly unchanged from generation to generation”. Culturally transmitted preferences are thus seen to a large extent persistent (Giavazzi et al., 2014), a feature that Guiso et al (2006, p. 24) describe as a “low depreciation rate” and determined early in an individual’s life. As such, cultural values and culturally transmitted preferences are therefore likely to become major influences on individual’s decision-making processes.12
Although, similar to Hofstede (1980), other researchers (see for example Parsons and Shils, 1951; Kluckhohn and Strodtbeck, 1961; Inkeles and Levinson, 1969; Schwartz, 1994, 2004) have also proposed that culture should be represented by more than one dimension, Hostede’s (1980) classification has become the most accepted and cited one in studies that connect culture with economic phenomena (Aggarwal et al., 2016, 2014),13 in spite of some criticisms (see for instance McSweeney, 2002). Originally proposed on the basis of the results from an empirical survey undertaken among IBM employees between 1967 and 1973, and further refined since then, Hofstede (1980) initially found systematic differences in national culture that led him to propose four cultural dimensions, later to be extended to six following a number of additional surveys and refinements (Hofstede et al, 2010). Of these dimensions, we consider five to be the most relevant for our study, which are described as follows14:
- (i)
Power distance: this dimension measures the acceptance of hierarchy or power differentials within a society. According to Hofstede, high power distance cultures prefer strong authority and steep hierarchies in part because they help preserve the existing social order and its related distribution of power. In high power distance cultures, organizations tend to be centralized, with power concentrated in a few hands. In low power distance cultures, organizations are more decentralized, there is more consultation in decision making, and independent action by less-powerful actors is valued and encouraged (Li and Harrison, 2008).
One may expect that organizations in high-power distance societies are more prone to promote corporate risk-taking. In support of this, Anderson and Galinsky (2006) suggest and find evidence that possessing power increases the propensity of individuals to engage in risk. This assertion is related to the Approach/Inhibition theory (Gray, 1991; Sutton and Davidson, 1997) which states that when owning power, individuals have their behavioural approach system more active and attend to more reward-laden information. As a result, when in the presence of choices to engage in a risky course of action, powerful people will have a greater focus on the potential payoffs rather than on its risks. In addition, Anderson and Galinsky (2006) also argue and present evidence that the sense of power can increase optimism in perceiving risks thus conducing to a riskier behaviour.
The perspective that power increases risk-taking may however be at least partly counterbalanced by the fact that powerful individuals may also develop a degree of risk-aversion in order to preserve power or to diversify their wealth arising from current power. For instance, Pathan (2009) shows that a measure of CEO power in banks is associated with a reduction in corporate risk-taking, a feature the author associates with the desire of these CEOs to reduce the risk related to its exposure to un-diversifiable wealth related to the human capital vested in their banks and dependence on a relatively large fixed salary component. Thus, it is essentially an empirical matter whether the first effect dominates the second or not.
- (ii)
Individualism relates to the degree to which people in a society are effectively integrated into groups. In societies that are more individualistic, its members tend to have strong ties only to their immediate families and not to more extended groups and even less so to society as a whole. The individualism dimension emphasizes independence, freedom and individual achievement, whereas in contrast collectivism prioritizes the group’s interests, its preservation and cohesion.
Breuer et al (2014) observe that overconfidence and over-optimism are related to individualism and find evidence that this cultural dimension has a positive impact on risk taking in household financing decisions. Accordingly, one could expect that firms in more individualistic countries would exhibit higher levels of corporate risk-taking due to the placement of a higher value to individual accomplishments and to using own judgement more frequently than alternative group-decision making processes (Kreiser et al., 2010). In contrast, firms in collectivistic countries would be more focused on preserving the well being of the larger group where individuals belong to and would be more likely to subject decisions to the consensus of the group, leading to a greater focus on risks rather than rewards. Companies in collectivistic societies may also give priority to maintaining the overall interests of stakeholders (especially large shareholders and major creditors)15 and thus would not be interested in encouraging excessive risk-taking.
- (iii)
Masculinity measures the acceptance of masculine values and rigid gender roles in a society and a focus on work success relative to fostering the wellbeing of others (Griffin et al., 2017). Masculine cultures favour managerial decisiveness and a performance orientation, with an emphasis on proactive competitive behaviour and self-confidence, whereas in feminine cultures, a more supportive social orientation prevails, accompanied by a strong concern for the preservation of existing relationships (Li and Harrison, 2008) and a preference for cooperation instead of competition.
It is likely that societies whose cultures are more feminine are expected to give women a stronger role in society which, given the empirically observable tendency of women to be more risk-averse than men (see for example Barber and Odean, 2001, in the case of equity investments and Weber et al., 2002, for financial risk-taking in general), may also lead to lower risk-taking. Proposed theories to justify such observed relations include biological (Saad and Gill, 2000; Buss, 1989) and social-based ones (Anselmi and Law, 1998).16 However, Meier-Pesti and Penz (2008) show that it is masculinity, rather than gender, that is better able to predict financial risk-taking, while also documenting that masculinity has a positive impact on risk-taking. Given all the above, it is reasonable to expect that societies that feature a high score on the masculinity cultural dimension will be more likely to promote corporate risk-taking.
- (iv)
Uncertainty avoidance is defined by Hofstede as the “extent to which the members of a culture feel threatened by uncertain or unknown situations” or in other words, as the “level of a society´s tolerance for ambiguity” (Hofstede, 1991). Cultures with high uncertainty avoidance attempt to mitigate the stress associated with uncertainty in favour of safety and security (Hofstede, 2001). Consequently, managers in high uncertainty avoidance societies are expected to avoid undertaking excessively innovative or riskier projects.
One would anticipate that in environments where a strong culture of uncertainty avoidance is present, individuals and organizations will have a preference for following established rules and be more comfortable with high levels of social conformity. In addition, they would be more prone to scrutinize and discourage projects or decisions that could increase the levels of risk and which are characterised by highly unpredictable outcomes. In accordance with this, Mihet (2013) and Li et al. (2013) find that firms in societies that are seen as highly averse to uncertainty tend to take less risky decisions. Likewise, Graham et al. (2013) show that CEOs with high levels of culturally transmitted uncertainty aversion traits are less likely take riskier decisions like the acquisition of other companies.
- (v)
Finally, societies that score low on long-term orientation prefer to maintain time-honoured traditions and norms while viewing societal change with suspicion. Those with a culture which scores high on this dimension, on the other hand, tend to encourage thrift and efforts in education to prepare for the future. In the business context, this dimension is often characterised as (short term) normative versus (long-term) pragmatic approaches to corporate behaviour.
Lumpkin et al. (2010) define long term orientation as “the tendency to prioritize the long-range implications and impact of decisions and actions that come to fruition after an extended time period” and note that family-run businesses are likely to be more risk-averse (Naldi et al., 2007) at the same time that they are also usually seen as more long-term oriented. This can be motivated by the family firms’ desire to maintain the status quo and preserve existing wealth. In addition, as Breton-Miller and Miller’s (2006) observe, “long term priorities include good stewardship aimed at reducing risk”. Lumpkin et al (2010) further note that family firms tend to be more focused on long-term survival rather than on increased profitability or growth, being more likely to refrain from bolder activities that could provide short-term profitability but with greater risk taking.
Adding to this, Gonzalez and André (2014) mention that managerial short-termism is usually considered as one of the main causes for the recent financial crisis and some of the most relevant recent corporate failures. Aligned with such view, Hutchinson et al. (2015) show results where institutional investors may promote short term performance over long term value creation when firms are financially distressed. Laverty (2004) finds evidence suggesting that long term orientation is more related to a firm’s culture rather than simple managerial myopia. Díez-Esteban et al. (2016) similarly report evidence consistent with institutional investors promoting excessive risk-taking by focusing on short-term profitability rather than sustainable long-term value creation, a feature that allegedly helped to foster the 2007–08 financial crisis in Europe.
Therefore, one can assume that companies in countries with greater long-term orientation will be less interested in promoting riskier decisions and will tend to see the future with a special concern for uncertainty and a stronger commitment to ensure sustainability and long-term survival.
Some of the more relevant exceptions to the rule that cultural factors have to a significant extent been ignored in the literature on corporate financial risk-taking (i) are Li et al. (2013) and Pan et al. (2017) on corporate risk taking in general, (ii) Antonczyk and Salzmann (2014) and Arosa et al. (2014) on capital structure decisions, (iii) Ashraf et al. (2016) on bank risk taking, (iv) Chang and Noorbakhsh (2009) and Chen et al (2015) on cash holdings determinants, and (v) Fidrmuc and Jacob (2010) on the choice of dividend policies.
Using a sample of firms from 35 countries, Li et al. (2013) show that when analysing the impact of Hofstede’s (1980, 2001) and Schwartz’s (1994, 2004) cultural dimensions, they find that individualism and uncertainty avoidance have a positive and negative impact, respectively, on the levels of corporate risk-taking (measured by volatility of earnings and RandD over assets ratio). In turn, using a sample of US public companies, Pan et al (2017) conclude that the firm founder‘s cultural heritage (proxied by Hofstede’s Uncertainty Avoidance Index) is a driving factor of corporate culture, with corresponding risk preferences passed over from generation to generation through particular selection and promotion processes.
Antonczyk and Salzmann (2014) look at one specific area of corporate risk-taking, the choice of a capital structure. The authors look at one particular Hofstede dimension (individualism) and find evidence that companies in countries that are seen as being high on the individualism cultural value show a strong level of optimism and overconfidence and this leads to the choice of higher (and riskier) debt ratios for their companies. Arosa et al. (2014) utilize a larger set of Hofstede dimensions than Antonczyk and Salzmann (2014) also to analyse capital structure decisions and find that countries with high levels of uncertainty avoidance and also those with high power distance tend to have lower debt ratios.
In the context of risk-taking in banking, Ashraf et al. (2016) use a sample of banks in 75 countries and, using four of Hofstede’s cultural dimensions, find that bank risk taking tends to be higher in countries which possess high individualism, low uncertainty avoidance, and low power distance cultural values.
Regarding the corporate decision to hold cash reserves (which also reflects to a large extent an attitude towards corporate risk-taking), Chang and Noorbakhsh (2009) show that, after controlling for governance issues and the level of financial development of the country, cultural dimensions also influence the decision to hold cash reserves. The authors document that cash holdings tend to be larger in settings of high uncertainty avoidance, high masculinity17 and longer term orientation. In a later study, Chen et al. (2015) report evidence that corporate cash levels are larger when individualism is low and uncertainty avoidance is high.
Finally, in the context of dividend policy decisions, which can also contribute to the level of risk-taking by companies, Fidrmuc and Jacob (2010) show that countries characterised by high individualism, low power distance, and low uncertainty avoidance tend to present higher dividend payouts.
The above studies show that, to a large extent, the implications of Hofstede’s dimensions on corporate risk-taking decisions are in accordance with the predictions discussed above. This leads us to expect the following null hypothesis regarding the influence of culture on risk-taking:Hypothesis 5 Companies strongly influenced by cultures with high levels of (H1a) Power Distance, (H1b) Masculinity, (H1c) Individualism, and/or low levels of (H1d) Long Term Orientation or (H1e) Uncertainty Avoidance are expected to engage in more risk-taking activities.
However, one can also conclude that in the existing studies focusing on the relationship between national culture and corporate risk-taking the religious dimension is notoriously absent.
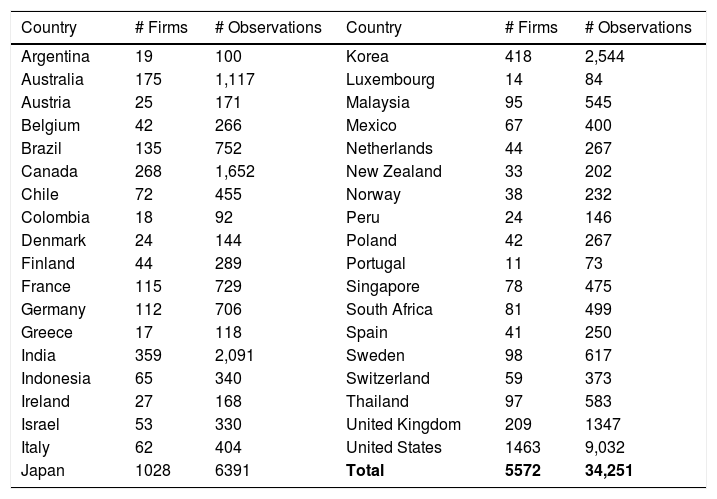
Data and methodologySample and data sourcesOur sample consists of 5572 companies from 37 countries for the period 2007–2015, with a total of 34,251 firm-year observations. We have obtained accounting data from financial statements (balance sheet and profit and loss statements), while corporate ownership structure and share prices of the firms were taken from THOMSON ONE BANKER database. Table 1 provides a summary of the sample by country.
Composition of the sample by countries.
| Country | # Firms | # Observations | Country | # Firms | # Observations |
|---|---|---|---|---|---|
| Argentina | 19 | 100 | Korea | 418 | 2,544 |
| Australia | 175 | 1,117 | Luxembourg | 14 | 84 |
| Austria | 25 | 171 | Malaysia | 95 | 545 |
| Belgium | 42 | 266 | Mexico | 67 | 400 |
| Brazil | 135 | 752 | Netherlands | 44 | 267 |
| Canada | 268 | 1,652 | New Zealand | 33 | 202 |
| Chile | 72 | 455 | Norway | 38 | 232 |
| Colombia | 18 | 92 | Peru | 24 | 146 |
| Denmark | 24 | 144 | Poland | 42 | 267 |
| Finland | 44 | 289 | Portugal | 11 | 73 |
| France | 115 | 729 | Singapore | 78 | 475 |
| Germany | 112 | 706 | South Africa | 81 | 499 |
| Greece | 17 | 118 | Spain | 41 | 250 |
| India | 359 | 2,091 | Sweden | 98 | 617 |
| Indonesia | 65 | 340 | Switzerland | 59 | 373 |
| Ireland | 27 | 168 | Thailand | 97 | 583 |
| Israel | 53 | 330 | United Kingdom | 209 | 1347 |
| Italy | 62 | 404 | United States | 1463 | 9,032 |
| Japan | 1028 | 6391 | Total | 5572 | 34,251 |
Source: Thomson One Banker database.
The difficulty in obtaining data on the ownership structure prevents the analysis of all listed companies. This selection represents companies – financial firms are excluded because of their special accounting practices- of all kinds of sizes and from a diverse set of countries, to encompass different cultural and religion backgrounds.
Variables description and empirical frameworkCorporate risk-takingWe use two alternative measures of corporate risk-taking in our tests. Firstly, and consistent with previous literature, we use a measure of risk related to firms’ shares (Ignatowski and Korte, 2014; Huang et al. 2013; Nguyen, 2011; John et al., 2008; Konishi and Yasuda, 2004). Specifically, we assume that a firm’s risk is associated with the variance of daily returns.18 Consequently, we define the variable corporate market risk (MRISK) as the standard deviations of daily stock returns of the company for each year.
Second, we use the Z-score (ZS), a measure of firm distress and distance from insolvency. It consists of an index of accounting measures of profitability, leverage and volatility, and it is calculated as the sum of the return on assets ratio plus the capital asset ratio divided by the standard deviation of the return on assets ratio over the entire sample period. The Z-score indicates the number of standard deviations that a firm’s losses (negative profits) can increase until these deplete equity, making the firm insolvent (De Nicolò, 2000). Thus, the higher the Z-score the more stable and the more financially healthy the firm will be.
National cultureNational culture is measured using five of the six Hofstede cultural dimensions: power distance (PD), individualism (IND), masculinity (MAS), uncertainty avoidance (UA) and long-term orientation (LTO). All five variables range from 0 to 100, with higher scores indicating a greater influence of a certain variable in a certain country. Data for the six dimensions has been obtained from https://www.hofstede-insights.com.
Religious backgroundWe have considered four possible groups of religions: Catholicism/Orthodox, Protestantism, Islamic and Eastern religions (Buddhism, Hindu and Shinto). Following prior research on this field, data has been obtained from the 2013 World Fact Book (Stulz and Williamson, 2003). Accordingly, (CATH) is a dummy variable that takes the value of 1 for Catholic countries and 0 otherwise; (PROT) is a dummy variable that takes the value of 1 for Protestant countries and 0 otherwise; (EASTERN) is a dummy variable that takes the value of 1 for Eastern religion countries and 0 otherwise. Finally, (ISLAM) is a dummy variable that takes the value of 1 for Islamic countries and 0 otherwise.
Ownership and monitoringThe power of the main shareholder is measured through the proportion of shares held by that shareholder (OWN1)19 and by the first five shareholders (OWN5). The monitoring role of other reference shareholders different from the main one is measured by the variable (MONITOR), calculated as the sum of the percentage of shares held by the second to fifth shareholder divided by the percentage owned by the first.20 A higher value of this index means that other reference shareholder can play an active monitoring role.21
Finally, the variable (NATHET) measures the nationality heterogeneity among the second to the fifth reference shareholder. It is calculated as the number of different nationalities among those shareholders.
Control variablesFirstly, following Bruno and Shong Shing (2014), we have included GDP growth (GDP) which captures each country’s overall growth. It is assumed that higher country-level growth should be associated with higher earnings volatility, and thus higher risk. We have obtained GDP data from the World Bank database.
Second, we determine a country’s market or bank orientated financial markets, to measure to what extent companies in a country are dependent on financial institutions financing which may play a moderating role in risk decisions (Tsai and Luan, 2016). Thus, we use market orientation (MO) variable as the ratio between domestic credit provided by the financial sector and market capitalization of listed companies for each country and year. The higher the MO ratio is, the more important banks are relative to capital markets. Data on this is taken from the World Bank indicators.
Lastly, we include in the analysis the Market-to-book value of assets ratio (MB), defined as the sum of the equity market value plus the debt book value divided by the sum of the book values of equity and debt, as it is commonly defined in current research (Maury and Pajuste, 2005; Villalonga and Amit, 2006). The rationale is that the higher the market-to-book ratio is, the lower the value attached to the assets in place and, in turn, the higher the value related to growth opportunities and also the higher will be corresponding corporate risk levels. We also control for the firms’ capital structure (LEV), measured as the financial leverage ratio (i.e., debt-to-equity ratio). To account for firm size, we calculate the log of total assets (LNA).
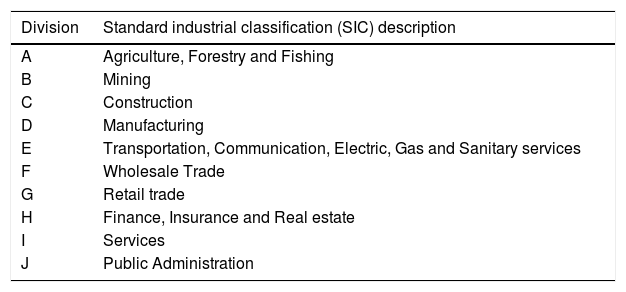
Because different industries face different risk levels, we have also included appropriate sectorial dummies (see Table A2). Thus, our model includes industry dummies and year dummies (INDUSTRY and YEAR, respectively). All control variables are measured for each firm in each year.
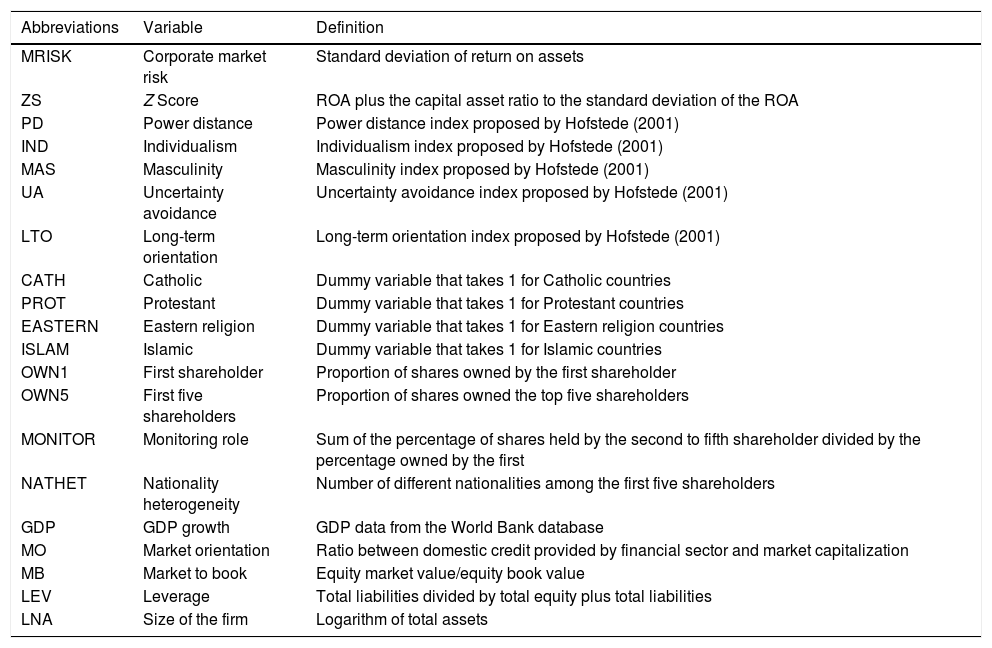
See the Appendix A for a summary table with the definition of all the variables.
where i denotes the firm, t the time period, ηi is the fixed-effects term of each firm or unobservable and constant heterogeneity, and εi,t is the stochastic error used to introduce possible errors in measurement of the independent variables and the omission of explanatory variables.
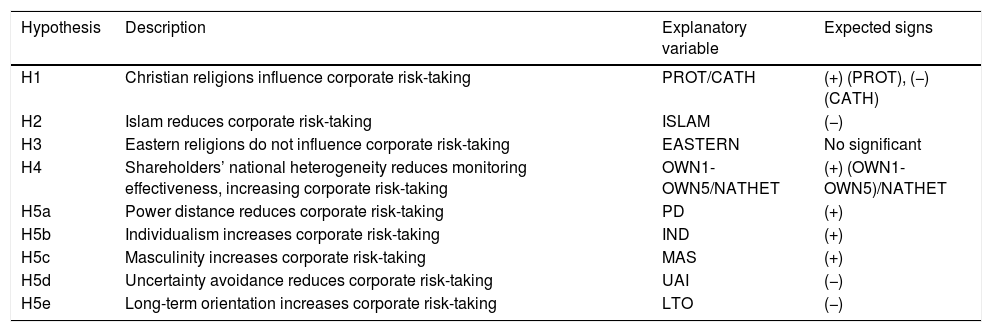
Considering the above definition of variables, Table 2 presents a summary of the hypothesis explained in the previous section, while showing also the expected signs of the relationship between our measures of risk-taking and the different explanatory variables.
Summary of hypothesis.
| Hypothesis | Description | Explanatory variable | Expected signs |
|---|---|---|---|
| H1 | Christian religions influence corporate risk-taking | PROT/CATH | (+) (PROT), (−) (CATH) |
| H2 | Islam reduces corporate risk-taking | ISLAM | (−) |
| H3 | Eastern religions do not influence corporate risk-taking | EASTERN | No significant |
| H4 | Shareholders’ national heterogeneity reduces monitoring effectiveness, increasing corporate risk-taking | OWN1-OWN5/NATHET | (+) (OWN1-OWN5)/NATHET |
| H5a | Power distance reduces corporate risk-taking | PD | (+) |
| H5b | Individualism increases corporate risk-taking | IND | (+) |
| H5c | Masculinity increases corporate risk-taking | MAS | (+) |
| H5d | Uncertainty avoidance reduces corporate risk-taking | UAI | (−) |
| H5e | Long-term orientation increases corporate risk-taking | LTO | (−) |
The table shows the summary of the hypothesis (dependent variable: MRISK or ZS) and the expected signs. See Table A1 for variable definitions.
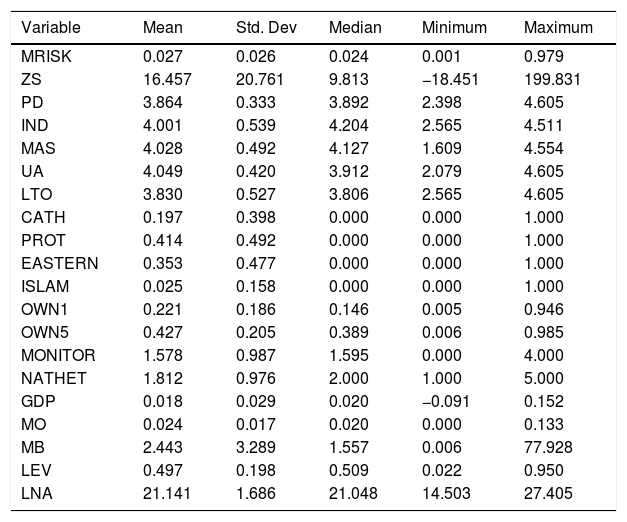
We first report descriptive statistics to show the main characteristics of our sample and to examine the consistency of our data with the results of previous research. This step provides preliminary evidence about a possible differential impact of cultural variables as well as religious background on corporate risk-taking.
Second, we test our hypotheses through an empirical analysis to validate the relation between corporate risk-taking, national culture, religious background and the effectiveness of the monitoring role among shareholders.
Our database combines time series with cross-sectional data, allowing the formation of panel data, which we estimate with the appropriate panel data methodology (Arellano and Bond, 1991; Arellano and Bover, 1990; Bond, 2002). Using this technique has two advantages. First, we can control the so-called constant unobserved heterogeneity, that refers to specific characteristics of each firm that remain constant over time as represented by the fixed-effects term ηi. Second, we can treat the possible endogeneity of the variables by using a generalized method of moments (GMM). We use system estimator, an enhanced version of the estimator GMM in which variable differences are also used as instruments in levels by equations (Blundell and Bond, 2000; Blundell et al., 2000; Bond 2002).
The consistency of the GMM estimators depends on the absence of a second order serial correlation in the error term and the validity of the instruments. For this reason, in Tables 6–9 we present the model specification tests. The validity of the instruments is assessed through the Hansen test of over-identifying restrictions that evaluates the joint validity of the selected instruments. We also perform a test (AR2) to verify that the error terms in the regressions do not present a second-order serial correlation, since the definition of the model makes the existence of first-order correlation very likely.
ResultsDescriptive statisticsTo characterize the sample under analysis, we present in Table 3 the descriptive statistics of the variables used. The data shows that there is a large variability of values for our risk-taking variables (either for MRISK or ZS). Also, the percentage of observations categorised as being from a Catholic environment is 19.7%, while Protestant beliefs encompass 41.4% of the sample, Eastern religions total 35.3% and Islam corresponds to 2.5%. Regarding ownership variables, the main shareholders own on average 22.2% of each firm, while the other reference shareholders maintain, on average, 42.7% of the shares, what makes the study of their monitoring role relevant.
Descriptive statistics.
| Variable | Mean | Std. Dev | Median | Minimum | Maximum |
|---|---|---|---|---|---|
| MRISK | 0.027 | 0.026 | 0.024 | 0.001 | 0.979 |
| ZS | 16.457 | 20.761 | 9.813 | −18.451 | 199.831 |
| PD | 3.864 | 0.333 | 3.892 | 2.398 | 4.605 |
| IND | 4.001 | 0.539 | 4.204 | 2.565 | 4.511 |
| MAS | 4.028 | 0.492 | 4.127 | 1.609 | 4.554 |
| UA | 4.049 | 0.420 | 3.912 | 2.079 | 4.605 |
| LTO | 3.830 | 0.527 | 3.806 | 2.565 | 4.605 |
| CATH | 0.197 | 0.398 | 0.000 | 0.000 | 1.000 |
| PROT | 0.414 | 0.492 | 0.000 | 0.000 | 1.000 |
| EASTERN | 0.353 | 0.477 | 0.000 | 0.000 | 1.000 |
| ISLAM | 0.025 | 0.158 | 0.000 | 0.000 | 1.000 |
| OWN1 | 0.221 | 0.186 | 0.146 | 0.005 | 0.946 |
| OWN5 | 0.427 | 0.205 | 0.389 | 0.006 | 0.985 |
| MONITOR | 1.578 | 0.987 | 1.595 | 0.000 | 4.000 |
| NATHET | 1.812 | 0.976 | 2.000 | 1.000 | 5.000 |
| GDP | 0.018 | 0.029 | 0.020 | −0.091 | 0.152 |
| MO | 0.024 | 0.017 | 0.020 | 0.000 | 0.133 |
| MB | 2.443 | 3.289 | 1.557 | 0.006 | 77.928 |
| LEV | 0.497 | 0.198 | 0.509 | 0.022 | 0.950 |
| LNA | 21.141 | 1.686 | 21.048 | 14.503 | 27.405 |
The table shows the mean, standard deviation, median, minimum, and maximum values of the model variables. See Table A1 for variable definitions.
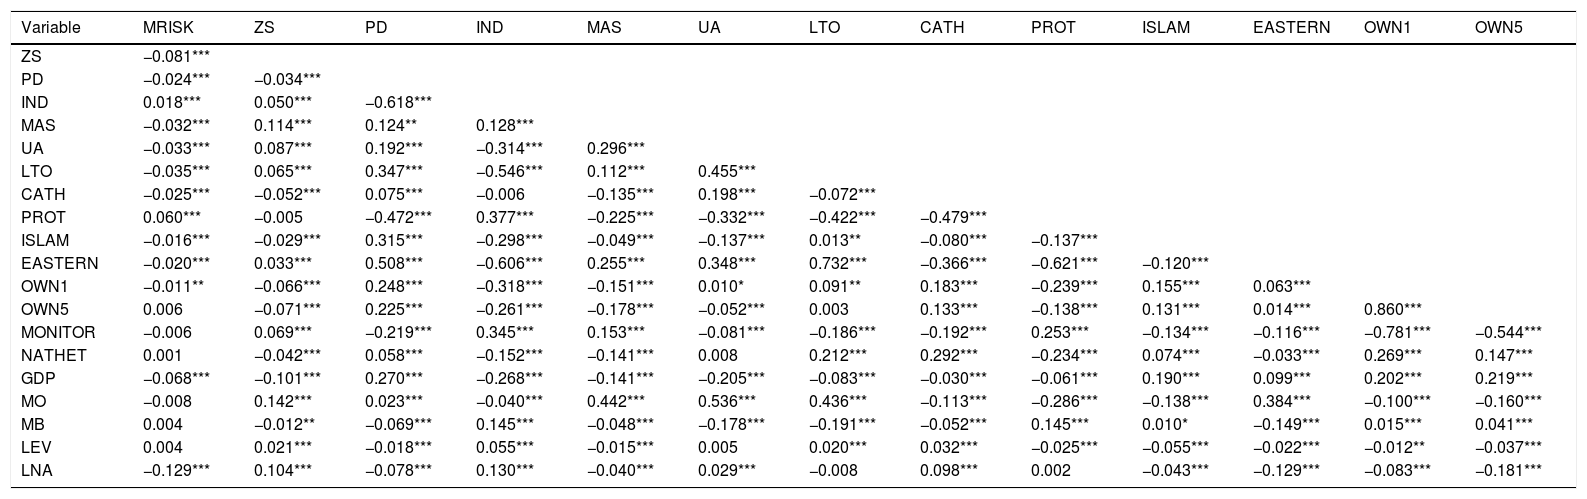
Table 4 shows the correlations between the variables for the whole sample. Both risk measurements (MRISK and ZS) reveal statically significant relationships with the cultural, religious and ownership variables considered. Nevertheless, the high correlation among them suggests further analysis separately.
Correlation matrix.
| Variable | MRISK | ZS | PD | IND | MAS | UA | LTO | CATH | PROT | ISLAM | EASTERN | OWN1 | OWN5 |
|---|---|---|---|---|---|---|---|---|---|---|---|---|---|
| ZS | −0.081*** | ||||||||||||
| PD | −0.024*** | −0.034*** | |||||||||||
| IND | 0.018*** | 0.050*** | −0.618*** | ||||||||||
| MAS | −0.032*** | 0.114*** | 0.124** | 0.128*** | |||||||||
| UA | −0.033*** | 0.087*** | 0.192*** | −0.314*** | 0.296*** | ||||||||
| LTO | −0.035*** | 0.065*** | 0.347*** | −0.546*** | 0.112*** | 0.455*** | |||||||
| CATH | −0.025*** | −0.052*** | 0.075*** | −0.006 | −0.135*** | 0.198*** | −0.072*** | ||||||
| PROT | 0.060*** | −0.005 | −0.472*** | 0.377*** | −0.225*** | −0.332*** | −0.422*** | −0.479*** | |||||
| ISLAM | −0.016*** | −0.029*** | 0.315*** | −0.298*** | −0.049*** | −0.137*** | 0.013** | −0.080*** | −0.137*** | ||||
| EASTERN | −0.020*** | 0.033*** | 0.508*** | −0.606*** | 0.255*** | 0.348*** | 0.732*** | −0.366*** | −0.621*** | −0.120*** | |||
| OWN1 | −0.011** | −0.066*** | 0.248*** | −0.318*** | −0.151*** | 0.010* | 0.091** | 0.183*** | −0.239*** | 0.155*** | 0.063*** | ||
| OWN5 | 0.006 | −0.071*** | 0.225*** | −0.261*** | −0.178*** | −0.052*** | 0.003 | 0.133*** | −0.138*** | 0.131*** | 0.014*** | 0.860*** | |
| MONITOR | −0.006 | 0.069*** | −0.219*** | 0.345*** | 0.153*** | −0.081*** | −0.186*** | −0.192*** | 0.253*** | −0.134*** | −0.116*** | −0.781*** | −0.544*** |
| NATHET | 0.001 | −0.042*** | 0.058*** | −0.152*** | −0.141*** | 0.008 | 0.212*** | 0.292*** | −0.234*** | 0.074*** | −0.033*** | 0.269*** | 0.147*** |
| GDP | −0.068*** | −0.101*** | 0.270*** | −0.268*** | −0.141*** | −0.205*** | −0.083*** | −0.030*** | −0.061*** | 0.190*** | 0.099*** | 0.202*** | 0.219*** |
| MO | −0.008 | 0.142*** | 0.023*** | −0.040*** | 0.442*** | 0.536*** | 0.436*** | −0.113*** | −0.286*** | −0.138*** | 0.384*** | −0.100*** | −0.160*** |
| MB | 0.004 | −0.012** | −0.069*** | 0.145*** | −0.048*** | −0.178*** | −0.191*** | −0.052*** | 0.145*** | 0.010* | −0.149*** | 0.015*** | 0.041*** |
| LEV | 0.004 | 0.021*** | −0.018*** | 0.055*** | −0.015*** | 0.005 | 0.020*** | 0.032*** | −0.025*** | −0.055*** | −0.022*** | −0.012** | −0.037*** |
| LNA | −0.129*** | 0.104*** | −0.078*** | 0.130*** | −0.040*** | 0.029*** | −0.008 | 0.098*** | 0.002 | −0.043*** | −0.129*** | −0.083*** | −0.181*** |
| Variable | MONITOR | NATHET | GDP | MO | MB | LEV |
|---|---|---|---|---|---|---|
| NATHET | −0.314*** | |||||
| GDP | −0.148*** | 0.031*** | ||||
| MO | 0.055*** | −0.022*** | −0.414*** | |||
| MB | 0.025*** | −0.027*** | 0.085*** | −0.177*** | ||
| LEV | −0.003 | 0.005 | −0.035*** | 0.065*** | 0.083*** | |
| LNA | 0.072*** | 0.120*** | −0.116*** | 0.095*** | −0.176*** | 0.378*** |
*Significant at 90% confidence level; **Significant at 95%; ***Significant at 99%. See Table A1 for variable definitions.
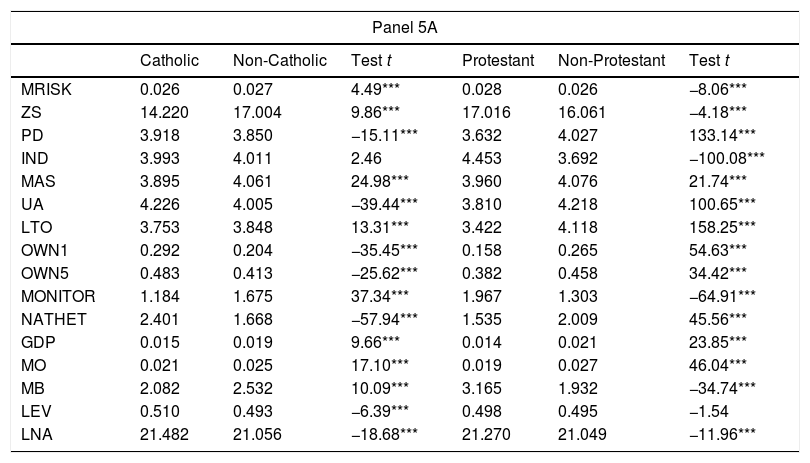
In Table 5, we present the mean values of all considered variables in our study depending on the religious background. Firstly, it is remarkable that there are significant differences in terms of market risk (MRISK) between Protestant countries (0.028) and the rest (0.026 and 0.024 for Catholic and Eastern ones and Islamic, respectively), whereas regarding Z-score values, Eastern religion countries are those that present the highest values.
Main descriptive statistics.
| Panel 5A | ||||||
|---|---|---|---|---|---|---|
| Catholic | Non-Catholic | Test t | Protestant | Non-Protestant | Test t | |
| MRISK | 0.026 | 0.027 | 4.49*** | 0.028 | 0.026 | −8.06*** |
| ZS | 14.220 | 17.004 | 9.86*** | 17.016 | 16.061 | −4.18*** |
| PD | 3.918 | 3.850 | −15.11*** | 3.632 | 4.027 | 133.14*** |
| IND | 3.993 | 4.011 | 2.46 | 4.453 | 3.692 | −100.08*** |
| MAS | 3.895 | 4.061 | 24.98*** | 3.960 | 4.076 | 21.74*** |
| UA | 4.226 | 4.005 | −39.44*** | 3.810 | 4.218 | 100.65*** |
| LTO | 3.753 | 3.848 | 13.31*** | 3.422 | 4.118 | 158.25*** |
| OWN1 | 0.292 | 0.204 | −35.45*** | 0.158 | 0.265 | 54.63*** |
| OWN5 | 0.483 | 0.413 | −25.62*** | 0.382 | 0.458 | 34.42*** |
| MONITOR | 1.184 | 1.675 | 37.34*** | 1.967 | 1.303 | −64.91*** |
| NATHET | 2.401 | 1.668 | −57.94*** | 1.535 | 2.009 | 45.56*** |
| GDP | 0.015 | 0.019 | 9.66*** | 0.014 | 0.021 | 23.85*** |
| MO | 0.021 | 0.025 | 17.10*** | 0.019 | 0.027 | 46.04*** |
| MB | 2.082 | 2.532 | 10.09*** | 3.165 | 1.932 | −34.74*** |
| LEV | 0.510 | 0.493 | −6.39*** | 0.498 | 0.495 | −1.54 |
| LNA | 21.482 | 21.056 | −18.68*** | 21.270 | 21.049 | −11.96*** |
| Panel 5B | ||||||
|---|---|---|---|---|---|---|
| Islamic | Non-Islamic | Test t | Eastern | Non-Eastern | Test t | |
| MRISK | 0.024 | 0.027 | 2.96*** | 0.026 | 0.027 | 3.82*** |
| ZS | 12.748 | 16.556 | 5.38*** | 17.404 | 15.940 | −6.23*** |
| PD | 4.509 | 3.846 | −61.60*** | 4.093 | 3.738 | −100.01*** |
| IND | 3.020 | 4.034 | 57.88*** | 3.565 | 4.249 | 141.09*** |
| MAS | 3.879 | 4.032 | 9.09*** | 4.198 | 3.935 | −48.86*** |
| UA | 3.694 | 4.058 | 25.71*** | 4.247 | 3.941 | −68.72*** |
| LTO | 3.872 | 3.828 | −2.42** | 4.353 | 3.544 | −200.00*** |
| OWN1 | 0.399 | 0.216 | −29.17*** | 0.237 | 0.212 | −11.760*** |
| OWN5 | 0.592 | 0.422 | −24.56*** | 0.431 | 0.424 | −2.73*** |
| MONITOR | 0.764 | 1.599 | 25.05*** | 1.423 | 1.662 | 21.61*** |
| NATHET | 2.276 | 1.800 | −14.37*** | 1.767 | 1.837 | 6.27*** |
| GDP | 0.053 | 0.017 | −35.80*** | 0.022 | 0.016 | −18.49*** |
| MO | 0.009 | 0.024 | 25.86*** | 0.033 | 0.019 | −77.17*** |
| MB | 2.657 | 2.437 | −1.95* | 1.779 | 2.805 | 27.88*** |
| LEV | 0.429 | 0.498 | 10.32*** | 0.490 | 0.500 | 4.17*** |
| LNA | 20.694 | 21.152 | 7.97*** | 20.844 | 21.302 | 24.16*** |
Mean values by religious and legal background. The t-value test is the maximum level of significance to reject the null hypothesis of equality of means between both subsamples. *Significant at 90% confidence level; **Significant at 95%; ***Significant at 99%. See Table A1 for variable definitions.
We must also note that cultural variables also present statistically significant differences, specially between Protestant countries and the rest. This different pattern anticipates a possible different influence of cultural variables on corporate risk-taking, depending on the religious background
Regarding ownership variables, there is a higher ownership concentration (OWN1) in Catholic, Islamic and Eastern countries than in the Protestant ones, and these values are observable when the first five shareholders (OWN5) are considered. Accordingly, the monitoring role (MONITOR) shows also differences. Lastly, national heterogeneity among the reference shareholders (NATHET) is more relevant in Catholic countries than in the other ones.
Multivariate analysisOur major empirical analysis draws on the results of the descriptive analysis. Tables 6–9 report the results from the estimation of Eq. (1). As reported in the previous section, the high correlation among the variables that describe the three considered dimensions (culture, religion and ownership structure) leads us to analyse them separately.
Results of the estimation of model 1.
| Corporate Market Risk (MRISK) | Z-score (ZS) | |||||
|---|---|---|---|---|---|---|
| Cultural dimensions | Religious background | Ownership structure | Cultural dimensions | Religious background | Ownership structure | |
| MRISK/ZS (t−1) | 0.419*** | 0.275* | 0.344** | 0.434*** | 0.621*** | 0.546*** |
| (0.134) | (0.147) | (0.142) | (0.193) | (0.150) | (0.134) | |
| PD | 0.003* | 17.682*** | ||||
| (0.002) | (6.146) | |||||
| IND | 0.008*** | 35.399*** | ||||
| (0.002) | (8.566) | |||||
| MAS | 0.002** | 12.819*** | ||||
| (0.001) | (3.577) | |||||
| UAI | −0.003* | −48.936*** | ||||
| (0.002) | (13.327) | |||||
| LTO | 0.002* | 4.157* | ||||
| (0.002) | (6.216) | |||||
| CATH | −0.001* | −0.864* | ||||
| (0.005) | (3.940) | |||||
| PROT | 0.012** | 6.991* | ||||
| (0.005) | (3.777) | |||||
| ISLAM | −0.006* | −2.232* | ||||
| (0.007) | (4.320) | |||||
| EASTERN | 0.003 | 4.408 | ||||
| (0.005) | (4.035) | |||||
| OWN1 | 0.015* | 123.723* | ||||
| (0.008) | (68.097) | |||||
| OWN5 | 0.022*** | 91.085* | ||||
| (0.007) | (54.263) | |||||
| MONITOR | −0.002*** | −5.901* | ||||
| (0.001) | (3.434) | |||||
| NATHET | 0.001*** | 0.535** | ||||
| (0.001) | (0.662) | |||||
| GDP | −0.061* | −0.010* | −0.010* | −116.393*** | −118.375*** | −100.713* |
| (0.092) | (0.099) | (0.101) | (25.743) | (25.865) | (60.862) | |
| MO | −0.058* | −0.272** | −0.259** | −112.012* | 61.909 | −1.800** |
| (0.063) | (0.133) | (0.128) | (133.845) | (109.682) | (64.466) | |
| MB | −0.006*** | −0.007*** | −0.007*** | 0.114 | −0.300** | 0.550 |
| (0.001) | (0.001) | (0.001) | (0.446) | (0.349) | (0.412) | |
| LEV | −0.005 | 0.001* | −0.002 | 11.372** | 32.035* | −44.067 |
| (0.011) | (0.013) | (0.011) | (11.015) | (19.291) | (22.329) | |
| LNA | −0.009*** | −0.013*** | −0.012*** | −5.507* | −4.046* | −1.651* |
| (0.001) | (0.002) | (0.002) | (2.752) | (2.084) | (1.333) | |
| INDUSTRY | YES | YES | YES | YES | YES | YES |
| YEAR | YES | YES | YES | YES | YES | YES |
| Constant | 0.242** | 0.315*** | 0.301*** | −187.391*** | 76.919 | −11.605 |
| (0.078) | (0.101) | (0.051) | (63.394) | (50.954) | (24.214) | |
| Wald test (g.l.) | 1,161.59*** (21) | 1,056.55*** (20) | 1,072.88*** (20) | 505.14*** (21) | 720.19*** (20) | 389.37*** (20) |
| m1 | −4.86*** | −4.66*** | −4.84*** | −3.28*** | −5.14*** | −5.37*** |
| m2 | 1.02 | 0.14 | 0.30 | −1.38 | −0.91 | −1.25 |
| Hansen test (g.l.) | 33.18 (27) | 27.53 (26) | 33.65 (27) | 32.72 (27) | 36.38 (27) | 29.42 (27) |
*Significant at 90% confidence level; **Significant at 95%; ***Significant at 99%. See Table A1 for variable definitions.
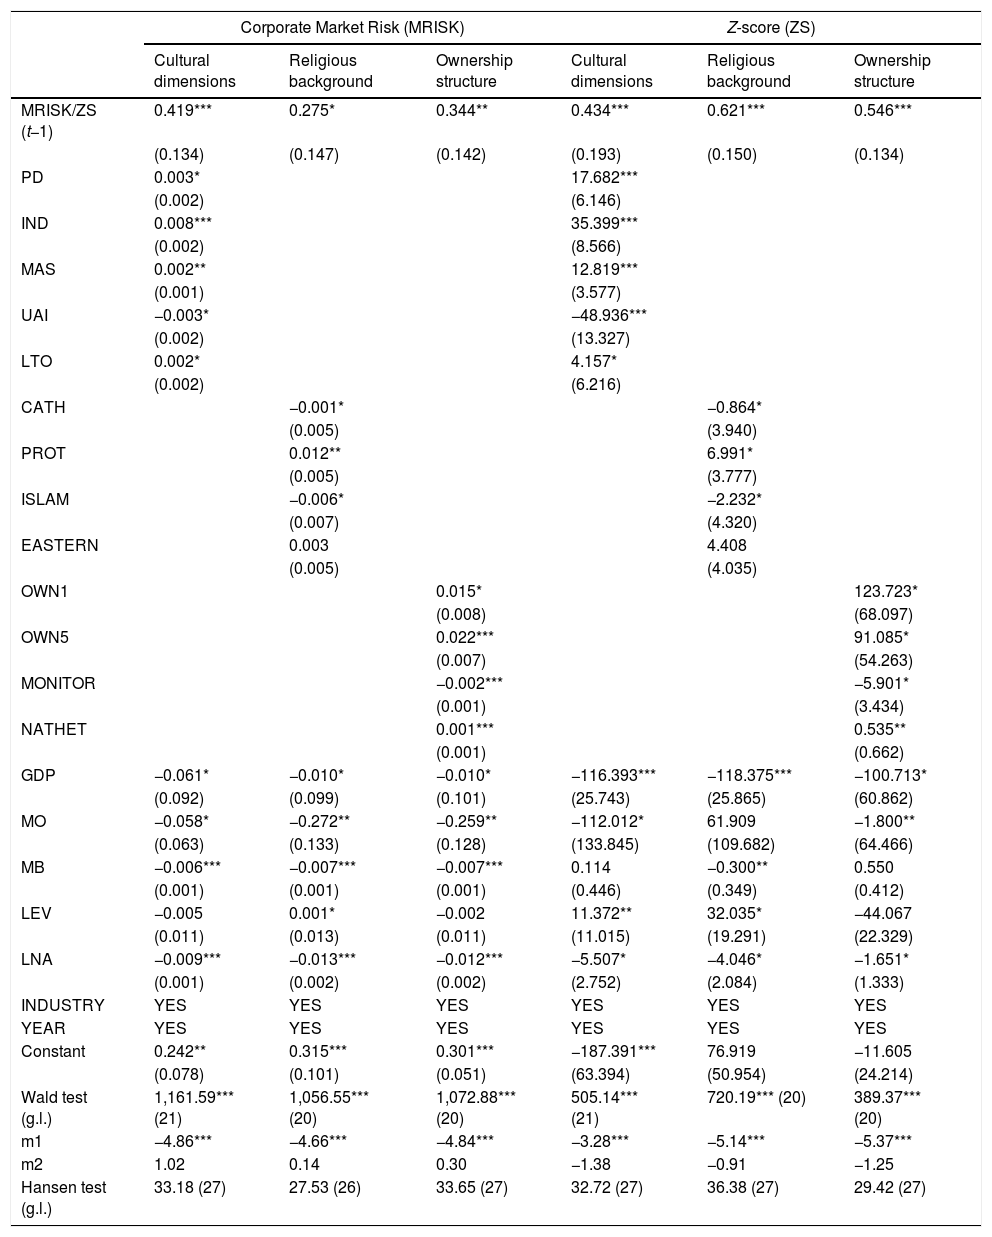
Regarding results reported in columns 1 and 4 (cultural dimensions), we observe that PD, IND, MAS and LTO coefficients are positive and statistically significant. In high power distance countries, those where individualism and masculinity are characteristics of such societies, and those which are more focused on the long-term, companies tend to promote corporate risk-taking. On the contrary, UAI coefficients suggest a negative and statistically significant relation between UAI and risk. This result confirms that firms in countries with a higher UAI score tend to take less risk. These results to a large extent confirm our fifth set of hypotheses and previous research except for the long-term orientation (LTO) trait which shows an opposite sign. A potential explanation for this last result can be the mediating role of innovation. In other words, if long term orientation is associated with greater a tendency for fostering innovation (Lumpkin et al, 2010), this effect can potentially compensate the risk-taking moderating impact of LTO.
Columns 2 and 5 present results for a country’s religious background and its influence on corporate risk-taking. We observe a significant positive relationship between risk and a Protestant background, a significant negative one for Catholic and Islamic but not significant for Eastern ones. This finding, in line with our set of hypotheses related to religion (H1 to H3), is consistent with the view that the Protestant view of business promotes competition and, hence, corporate risk-taking, whereas the theological view of business and the common good in Catholic and Islamic countries makes companies less risk seekers.
Ownership structure results are reported in columns 3 and 6. As expected, ownership concentration (OWN1 and OWN5) coefficients are positively related to corporate risk-taking, confirming the findings of previous studies. Although it is not part of our hypothesis development, we have included in the model the variable MONITOR to measure the monitoring role exercised by the non-main reference shareholders over the main one. The coefficient of this variable is negative and statistically significant, consistent with a monitoring role that reduces corporate risk-taking. As expected, NATHET is positively related to corporate risk-taking, because when there is heterogeneity between the non-main reference shareholders’ nationality, reaching agreements turns out to be more difficult and, hence, the main reference shareholder will not have any barriers in promoting riskier investments. These results confirm the expectations of our fourth hypothesis.
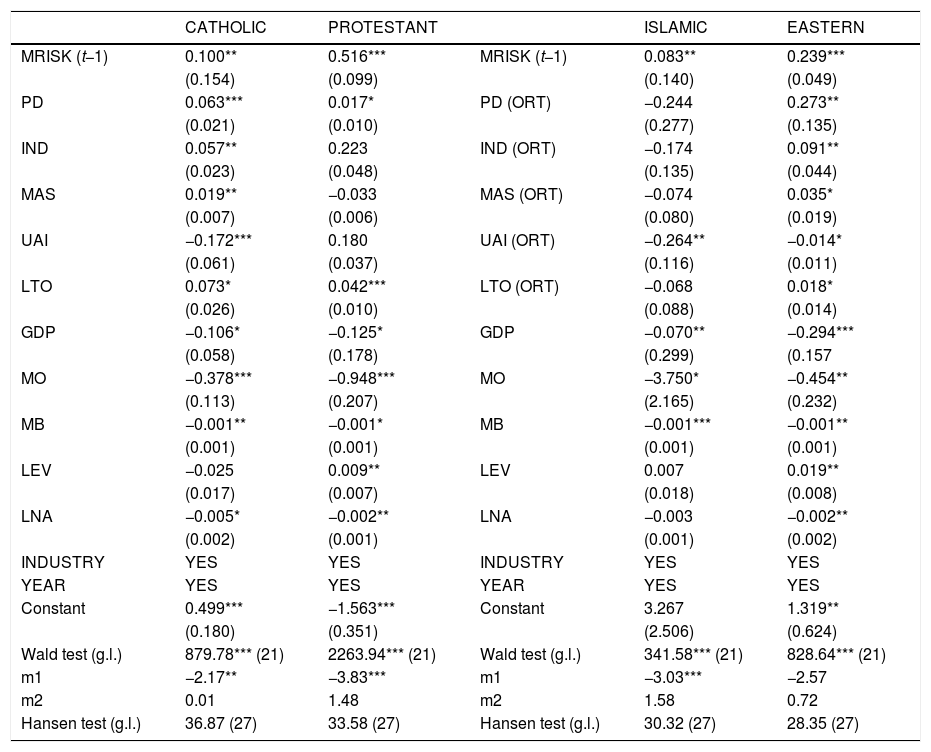
One of the key issues addressed by our study is to better understand the relationship between national culture and a country’s religious background. Thus, in Table 7 we report the results of the estimation of our model for the cultural variables by dividing our sample into four groups, according to the religious groups considered. Proceeding this way, the interaction between both dimensions may be interpreted in the context of corporate risk-taking.
Results of the estimation of model 1 for religious background and cultural dimensions (MRISK).
| CATHOLIC | PROTESTANT | ISLAMIC | EASTERN | ||
|---|---|---|---|---|---|
| MRISK (t−1) | 0.100** | 0.516*** | MRISK (t−1) | 0.083** | 0.239*** |
| (0.154) | (0.099) | (0.140) | (0.049) | ||
| PD | 0.063*** | 0.017* | PD (ORT) | −0.244 | 0.273** |
| (0.021) | (0.010) | (0.277) | (0.135) | ||
| IND | 0.057** | 0.223 | IND (ORT) | −0.174 | 0.091** |
| (0.023) | (0.048) | (0.135) | (0.044) | ||
| MAS | 0.019** | −0.033 | MAS (ORT) | −0.074 | 0.035* |
| (0.007) | (0.006) | (0.080) | (0.019) | ||
| UAI | −0.172*** | 0.180 | UAI (ORT) | −0.264** | −0.014* |
| (0.061) | (0.037) | (0.116) | (0.011) | ||
| LTO | 0.073* | 0.042*** | LTO (ORT) | −0.068 | 0.018* |
| (0.026) | (0.010) | (0.088) | (0.014) | ||
| GDP | −0.106* | −0.125* | GDP | −0.070** | −0.294*** |
| (0.058) | (0.178) | (0.299) | (0.157 | ||
| MO | −0.378*** | −0.948*** | MO | −3.750* | −0.454** |
| (0.113) | (0.207) | (2.165) | (0.232) | ||
| MB | −0.001** | −0.001* | MB | −0.001*** | −0.001** |
| (0.001) | (0.001) | (0.001) | (0.001) | ||
| LEV | −0.025 | 0.009** | LEV | 0.007 | 0.019** |
| (0.017) | (0.007) | (0.018) | (0.008) | ||
| LNA | −0.005* | −0.002** | LNA | −0.003 | −0.002** |
| (0.002) | (0.001) | (0.001) | (0.002) | ||
| INDUSTRY | YES | YES | INDUSTRY | YES | YES |
| YEAR | YES | YES | YEAR | YES | YES |
| Constant | 0.499*** | −1.563*** | Constant | 3.267 | 1.319** |
| (0.180) | (0.351) | (2.506) | (0.624) | ||
| Wald test (g.l.) | 879.78*** (21) | 2263.94*** (21) | Wald test (g.l.) | 341.58*** (21) | 828.64*** (21) |
| m1 | −2.17** | −3.83*** | m1 | −3.03*** | −2.57 |
| m2 | 0.01 | 1.48 | m2 | 1.58 | 0.72 |
| Hansen test (g.l.) | 36.87 (27) | 33.58 (27) | Hansen test (g.l.) | 30.32 (27) | 28.35 (27) |
*Significant at 90% confidence level; **Significant at 95%; ***Significant at 99%. See Table A1 for variable definitions.
We must note that, in the case of Islamic countries and those with an Eastern religious background, cultural variables are totally correlated among them, which causes a modelling specification problem (collinearity) when using GMM. To overcome this issue, and following prior literature we have orthogonalized22 cultural variables (Salmerón et al., 2016; Novales et al., 2015).
It is important to note that not all cultural variables are relevant when considering different religious backgrounds. Only in Catholic and Eastern countries all five considered cultural variables become statistically significant for corporate risk-taking. In Protestant ones, only Power distance PD and long-term orientation LTO are significant whereas in Islamic countries the only relevant cultural variable is uncertainty avoidance UAI. These different results are in line with the fundamentals of our hypothesis. On the one hand, we find that in Islamic countries what really determines risk-taking behaviour is religion, whereas in Catholic ones there is a joint effect of both religion and culture. On the other hand, in Eastern countries there is a relevant impact of cultural variables independently of the religious background. Lastly, in Protestant ones, corporate risk-taking is clearly influenced by two cultural variables.
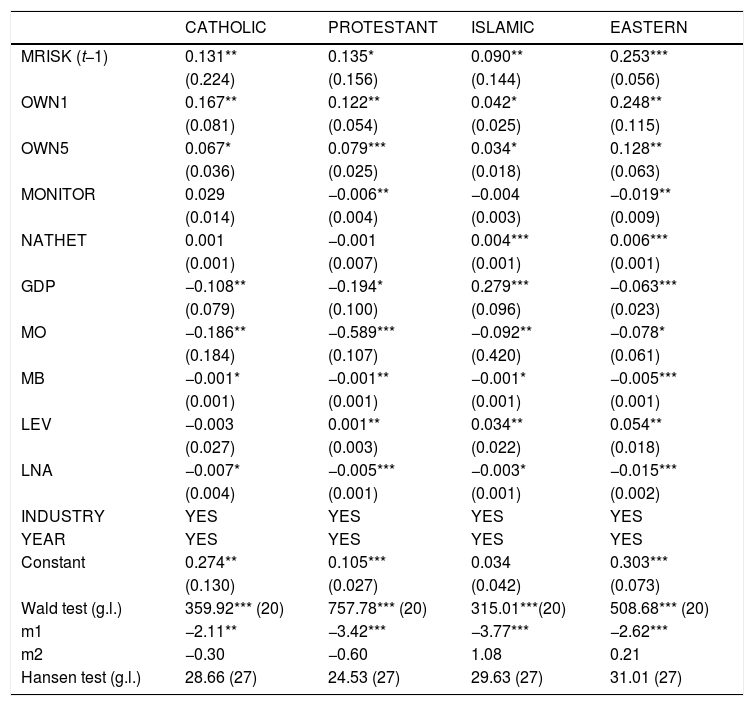
A similar analysis has been conducted to better explain the effect of national heterogeneity among the reference shareholders. Results are reported in Table 8.
Results of the estimation of model 1 for religious background and ownership structure (MRISK).
| CATHOLIC | PROTESTANT | ISLAMIC | EASTERN | |
|---|---|---|---|---|
| MRISK (t−1) | 0.131** | 0.135* | 0.090** | 0.253*** |
| (0.224) | (0.156) | (0.144) | (0.056) | |
| OWN1 | 0.167** | 0.122** | 0.042* | 0.248** |
| (0.081) | (0.054) | (0.025) | (0.115) | |
| OWN5 | 0.067* | 0.079*** | 0.034* | 0.128** |
| (0.036) | (0.025) | (0.018) | (0.063) | |
| MONITOR | 0.029 | −0.006** | −0.004 | −0.019** |
| (0.014) | (0.004) | (0.003) | (0.009) | |
| NATHET | 0.001 | −0.001 | 0.004*** | 0.006*** |
| (0.001) | (0.007) | (0.001) | (0.001) | |
| GDP | −0.108** | −0.194* | 0.279*** | −0.063*** |
| (0.079) | (0.100) | (0.096) | (0.023) | |
| MO | −0.186** | −0.589*** | −0.092** | −0.078* |
| (0.184) | (0.107) | (0.420) | (0.061) | |
| MB | −0.001* | −0.001** | −0.001* | −0.005*** |
| (0.001) | (0.001) | (0.001) | (0.001) | |
| LEV | −0.003 | 0.001** | 0.034** | 0.054** |
| (0.027) | (0.003) | (0.022) | (0.018) | |
| LNA | −0.007* | −0.005*** | −0.003* | −0.015*** |
| (0.004) | (0.001) | (0.001) | (0.002) | |
| INDUSTRY | YES | YES | YES | YES |
| YEAR | YES | YES | YES | YES |
| Constant | 0.274** | 0.105*** | 0.034 | 0.303*** |
| (0.130) | (0.027) | (0.042) | (0.073) | |
| Wald test (g.l.) | 359.92*** (20) | 757.78*** (20) | 315.01***(20) | 508.68*** (20) |
| m1 | −2.11** | −3.42*** | −3.77*** | −2.62*** |
| m2 | −0.30 | −0.60 | 1.08 | 0.21 |
| Hansen test (g.l.) | 28.66 (27) | 24.53 (27) | 29.63 (27) | 31.01 (27) |
*Significant at 90% confidence level; **Significant at 95%; ***Significant at 99%. See Table A1 for variable definitions.
Although ownership variables present the same pattern in all environments the effect of the monitoring role is only relevant in Protestant and Eastern countries. Moreover, the effect of national heterogeneity among the non-main reference shareholders is only significant in Islamic and Eastern countries, precisely due to the joint influence of both cultural and religious dimensions that may make reaching agreements more difficult.
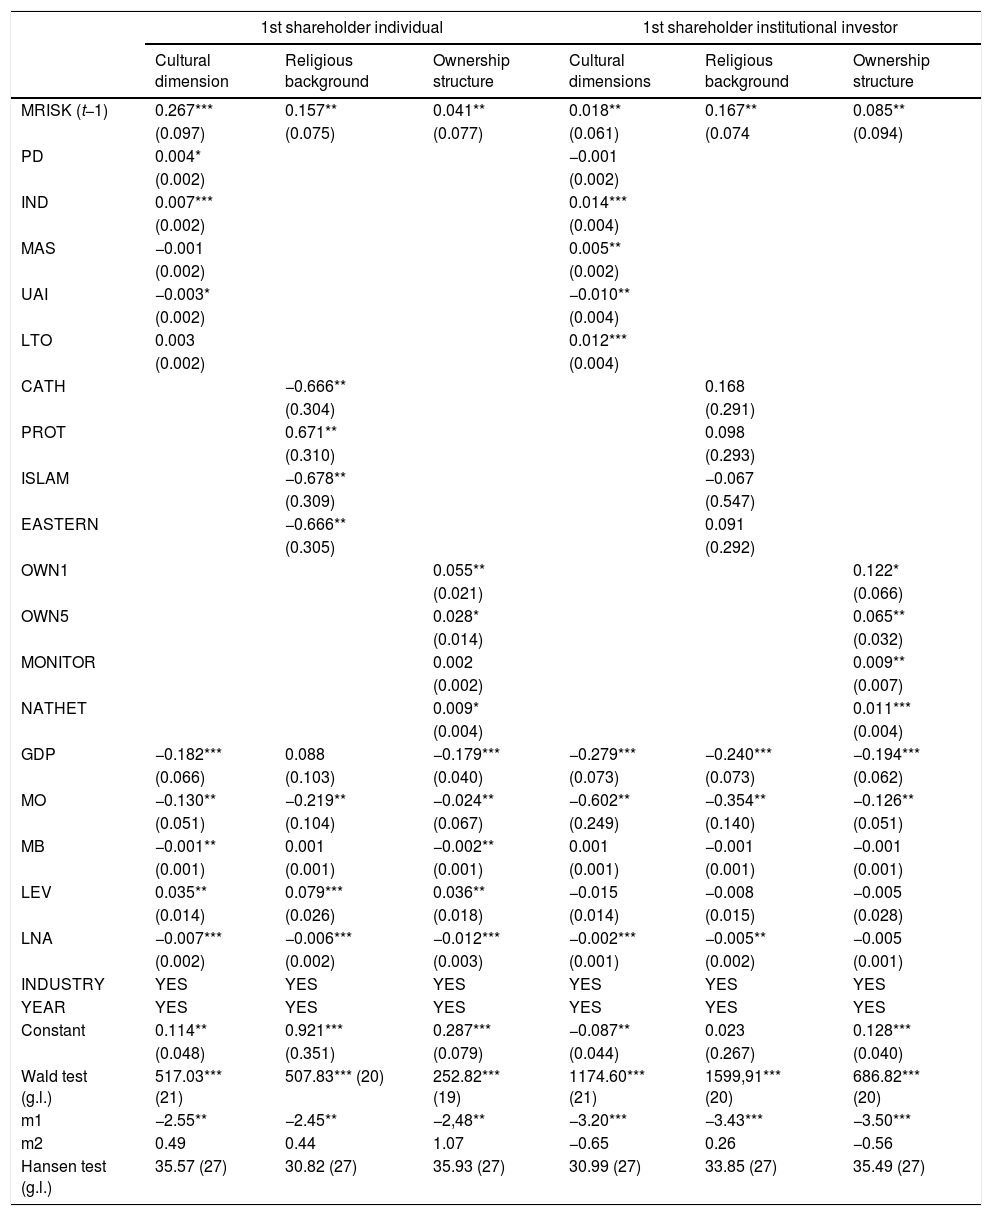
Lastly, we try to address a specific issue: Are all kinds of shareholders equally influenced by national culture and religion? To analyse this question, we identify the identity of the reference shareholder and split the sample into two groups: one with companies whose first main shareholder is an individual or a family and another with firms whose first main shareholder is an institutional investor. Results of the estimation are reported in Table 9.
Results of the estimation of model 1 by reference shareholder nature.
| 1st shareholder individual | 1st shareholder institutional investor | |||||
|---|---|---|---|---|---|---|
| Cultural dimension | Religious background | Ownership structure | Cultural dimensions | Religious background | Ownership structure | |
| MRISK (t−1) | 0.267*** | 0.157** | 0.041** | 0.018** | 0.167** | 0.085** |
| (0.097) | (0.075) | (0.077) | (0.061) | (0.074 | (0.094) | |
| PD | 0.004* | −0.001 | ||||
| (0.002) | (0.002) | |||||
| IND | 0.007*** | 0.014*** | ||||
| (0.002) | (0.004) | |||||
| MAS | −0.001 | 0.005** | ||||
| (0.002) | (0.002) | |||||
| UAI | −0.003* | −0.010** | ||||
| (0.002) | (0.004) | |||||
| LTO | 0.003 | 0.012*** | ||||
| (0.002) | (0.004) | |||||
| CATH | −0.666** | 0.168 | ||||
| (0.304) | (0.291) | |||||
| PROT | 0.671** | 0.098 | ||||
| (0.310) | (0.293) | |||||
| ISLAM | −0.678** | −0.067 | ||||
| (0.309) | (0.547) | |||||
| EASTERN | −0.666** | 0.091 | ||||
| (0.305) | (0.292) | |||||
| OWN1 | 0.055** | 0.122* | ||||
| (0.021) | (0.066) | |||||
| OWN5 | 0.028* | 0.065** | ||||
| (0.014) | (0.032) | |||||
| MONITOR | 0.002 | 0.009** | ||||
| (0.002) | (0.007) | |||||
| NATHET | 0.009* | 0.011*** | ||||
| (0.004) | (0.004) | |||||
| GDP | −0.182*** | 0.088 | −0.179*** | −0.279*** | −0.240*** | −0.194*** |
| (0.066) | (0.103) | (0.040) | (0.073) | (0.073) | (0.062) | |
| MO | −0.130** | −0.219** | −0.024** | −0.602** | −0.354** | −0.126** |
| (0.051) | (0.104) | (0.067) | (0.249) | (0.140) | (0.051) | |
| MB | −0.001** | 0.001 | −0.002** | 0.001 | −0.001 | −0.001 |
| (0.001) | (0.001) | (0.001) | (0.001) | (0.001) | (0.001) | |
| LEV | 0.035** | 0.079*** | 0.036** | −0.015 | −0.008 | −0.005 |
| (0.014) | (0.026) | (0.018) | (0.014) | (0.015) | (0.028) | |
| LNA | −0.007*** | −0.006*** | −0.012*** | −0.002*** | −0.005** | −0.005 |
| (0.002) | (0.002) | (0.003) | (0.001) | (0.002) | (0.001) | |
| INDUSTRY | YES | YES | YES | YES | YES | YES |
| YEAR | YES | YES | YES | YES | YES | YES |
| Constant | 0.114** | 0.921*** | 0.287*** | −0.087** | 0.023 | 0.128*** |
| (0.048) | (0.351) | (0.079) | (0.044) | (0.267) | (0.040) | |
| Wald test (g.l.) | 517.03*** (21) | 507.83*** (20) | 252.82*** (19) | 1174.60*** (21) | 1599,91*** (20) | 686.82*** (20) |
| m1 | −2.55** | −2.45** | −2,48** | −3.20*** | −3.43*** | −3.50*** |
| m2 | 0.49 | 0.44 | 1.07 | −0.65 | 0.26 | −0.56 |
| Hansen test (g.l.) | 35.57 (27) | 30.82 (27) | 35.93 (27) | 30.99 (27) | 33.85 (27) | 35.49 (27) |
*Significant at 90% confidence level; **Significant at 95%; ***Significant at 99%. See Table A1 for variable definitions.
Results are very relevant, as we find that the religious background is only relevant for individual shareholders, while cultural dimensions are more relevant for institutional investors, except for individualism IND and uncertainty avoidance UAI. In fact, institutional investors, due to their characteristics, usually do not ascribe to a certain religion (i.e., such investors in a sense are “agnostic”) but, when investing, may be influenced by the cultural environment in which was ``created’’.
We must mention that, as our sample includes countries of different sizes, as a robustness check we have redone all the analysis by excluding USA companies that represent 26% of the total. Moreover, we have also replaced the estimation in Tables 7–9 by the Z-score (ZS) risk measurement. The results are essentially analogous to those discussed above and are not presented for parsimony reasons.
ConclusionsWe analyse the relation between national culture, religion, ownership structure and corporate risk-taking for a sample of large quoted companies from 37 countries for the period 2007–2015. We specifically examine whether it is valid to consider national culture and religion as determinants of corporate decisions or, instead, if these are relevant factors only in certain environments.
Leaving cultural dimensions aside, and consistent with our initial hypothesis, our evidence suggests that certain religious environments seem to have either a negative (Catholic and Islamic) or positive (Protestant) impact on corporate-risk taking.
On the one hand, we find that national culture, proxied by Hofstede cultural dimensions, clearly also influences corporate risk-taking. While power distance, masculinity, individualism and long-term orientation exercise a positive effect, uncertainty avoidance reduces corporate risk-taking. The influence of these cultural dimensions is not relevant for all countries but are observed to be important especially in those countries where the religious understanding of business focuses more on the common good.
To try shedding some light on whether religion and culture are separable influences or not on risk taking, we analysed the impact of cultural dimensions for companies in each religion background. While for countries with Catholic and Eastern religions all the cultural traits have a relevant impact over and above the religion factor, in Protestant countries only the power distance and long-term orientation dimensions have an additional influence and in Islam-based countries the marginal relevance of cultural traits over the religion factor is only observable for the uncertainty avoidance trait.
Finally, we analyse if nationality heterogeneity among the non-main reference shareholders modifies the monitoring role under a type II agency perspective. We find that such heterogeneity is relevant to corporate risk-taking, but especially so in Islamic and Eastern countries.
Our research may have promising implications for practitioners, policy makers and academia. Our results are informative for practitioners about the way national culture and religion modulate corporate risk-taking. Considering this double perspective, policy makers may influence the adoption of less risky investment decisions by encouraging the formation of balanced ownership structures in countries where personal believes are relevant. In the perspective of investors, these should bear in mind that the presence of large reference shareholders will have an impact on risk-taking according to whether these are institutional shareholders and individuals/families and that in the latter case their type of religiosity will impact on the riskiness of the firm’s activities. Finally, our paper adds to the fertile field of academic research on the factors affecting corporate risk-taking, especially those which stress the importance of qualitative characteristics in explaining corporate decisions.
This research has been financed by Portuguese Public Funds through FCT (Fundação para a Ciência e a Tecnologia) in the framework of the project UID/ECO/04105/2013. The authors are grateful to Xosé H. Vazquez, Yama Temouri and two anonymous referees for their comments on previous versions of the paper. All the remaining errors are our responsibility.
See Tables A1 and A2.
Definition of variables.
| Abbreviations | Variable | Definition |
|---|---|---|
| MRISK | Corporate market risk | Standard deviation of return on assets |
| ZS | Z Score | ROA plus the capital asset ratio to the standard deviation of the ROA |
| PD | Power distance | Power distance index proposed by Hofstede (2001) |
| IND | Individualism | Individualism index proposed by Hofstede (2001) |
| MAS | Masculinity | Masculinity index proposed by Hofstede (2001) |
| UA | Uncertainty avoidance | Uncertainty avoidance index proposed by Hofstede (2001) |
| LTO | Long-term orientation | Long-term orientation index proposed by Hofstede (2001) |
| CATH | Catholic | Dummy variable that takes 1 for Catholic countries |
| PROT | Protestant | Dummy variable that takes 1 for Protestant countries |
| EASTERN | Eastern religion | Dummy variable that takes 1 for Eastern religion countries |
| ISLAM | Islamic | Dummy variable that takes 1 for Islamic countries |
| OWN1 | First shareholder | Proportion of shares owned by the first shareholder |
| OWN5 | First five shareholders | Proportion of shares owned the top five shareholders |
| MONITOR | Monitoring role | Sum of the percentage of shares held by the second to fifth shareholder divided by the percentage owned by the first |
| NATHET | Nationality heterogeneity | Number of different nationalities among the first five shareholders |
| GDP | GDP growth | GDP data from the World Bank database |
| MO | Market orientation | Ratio between domestic credit provided by financial sector and market capitalization |
| MB | Market to book | Equity market value/equity book value |
| LEV | Leverage | Total liabilities divided by total equity plus total liabilities |
| LNA | Size of the firm | Logarithm of total assets |
Industry dummy variables.
| Division | Standard industrial classification (SIC) description |
|---|---|
| A | Agriculture, Forestry and Fishing |
| B | Mining |
| C | Construction |
| D | Manufacturing |
| E | Transportation, Communication, Electric, Gas and Sanitary services |
| F | Wholesale Trade |
| G | Retail trade |
| H | Finance, Insurance and Real estate |
| I | Services |
| J | Public Administration |
Considering that religion is a key component of a system of beliefs, it has been previously used as a common proxy for national culture (Stulz and Williamson, 2003; La Porta et al., 1999).
By focusing on religion, we overcome the causality issue (from culture to economics and vice versa), as “religion is a cultural dimension inherited by individuals from previous generations rather than voluntarily accumulated” (Guiso et al., 2006).
The risk preference theory (Miller and Hoffman, 1995) supports these findings, as not belonging to a religion is an inherently risky choice.
The current trend in sociology of religion is toward a rational choice perspective of religious behavior, i.e., religious believes and behavior are viewed as the outcome rational calculations of perceived costs and rewards (Iyer, 2016; Stark and Bainbridge, 1987)
Catholic and Orthodox are treated equally as their differences lay more on theological aspects rather than economic ones.
For a deeper analysis on the importance of religion in the economic development of countries, see Stulz and Williamson (2003).
For a widely explanation of the Catholic social thought, we recommend reading the Pope Leo’s XII encyclical Rerum Novarum.
Consistent with this idea, Baxamusa and Jalal (2014) find that CEOs who identify themselves as Catholics tend to take less risk than those who consider themselves as Protestant.
The Calvinist idea of predestination is behind this thought. In fact, such kind of activities should be condemned for promoting idleness.
Although the analysis of the monitoring role of other reference shareholders is not one of our study focus, we have included a variable (MONITOR) in the empirical model to test the existence of that role in our sample.
Obviously, the influence of other reference shareholders in the decisions of the main shareholder will be conditioned by the power of the latter or, in other words, by their level of participation in the property. This issue has already been analyzed by Konishi and Yasuda (2004).
Following the social legitimation approach discussed by Davidson (1995), we consider that cultural dimensions should be addressed not from an aggregate psychological perspective.
Arosa et al (2014, p. 182) mention that “despite its pitfalls, Hofstede’s model is still the most accepted and broadly used measure of culture today and has been validated by a number of recent studies. No other researcher has been able to develop a model that equals or exceeds his in sample size, methodology, or acceptance among academics worldwide”.
Studies in this topic usually consider five or fewer of Hofstede’s dimensions. See for example Li et al. (2013), Anderson et al. (2011) and Ashraf et al. (2016).
Agency theory has traditionally defined two agency problems. Type I issue (shareholder vs. managers) is no longer relevant in most international companies, where type II problem (major vs. minor shareholders) has become more relevant (La Porta et al., 1999, 2000, 2002; Morck et al., 2005). The influence of national culture on different corporate shareholder’s structure is analyzed in a subsequent section of this paper.
Notwithstanding, as Anselmi and Law (1998) observe, biological and social factors can interact and so it is difficult in practice to separate both effects.
Chang and Noorbakhsh (2009) argue that managers in masculine societies “with little oversight from their shareholders, may disperse those cash balances on value-reducing and risky investment projects”, which is consistent with our hypothesis that masculinity traits are associated with higher risk taking.
We calculate the shareholder returns through the formula Ri = (Pt − Pi)/Pi, Pt being the share price at the end of the day and Pi the initial price. If a share was not listed on any given day, we exclude the data from that day to calculate risk.
We consider reference shareholder that owner who owns more than 5% of the capital, as this will allow him to influence the board of directors, appoint managers and intervene in key strategic decisions. Some databases such as Thomson Financial, Marketguide and WorldVest also make use of this ratio to identify the reference shareholders.
This index measures the effectiveness of the monitoring role: PP5 = (P2 + P3 + P4 + P5)/P1, being Pi the proportion of shares owned by each of the first five reference shareholders.
The monitoring role of other reference shareholders is not conclusive (Díez-Esteban et al., 2013). We expect a negative sign of (MONITOR) variable, given the post-crisis period of our sample (Hill and Snell, 1988; Smith and Watts, 1992; Jensen and Meckling, 1976; Campbell et al., 2001).