


Iron zircon coral pigments are very interesting from an industrial point of view because of their high colouring power and their stability at high temperatures. However, the pigment's synthesis is particularly troublesome due to its specific reaction mechanism. As an encapsulated pigment it becomes very important how the raw materials are distributed in the reaction mixture. To evaluate the effectiveness of the mixing process, it would be convenient to define a parameter, that is the mixing index, to estimate the degree of homogeneity of the system. In the current investigation, a mixing index is proposed derived from the power spectrum of Fourier transform of scanning electron microscope (SEM) images of the raw material mixture. Concretely, the number of pixels in a certain range of values in the image of the power spectrum, seems to behave relatively well as mixing index. This index allows us to distinguish between samples with different zirconia and iron oxide used as precursors. The proposed mixing index seems to be related to the colouring power of the final pigment when the synthesis generates enough zircon to encapsulate hematite particles.
Los pigmentos coral de hierro-circón son muy interesantes desde el punto de vista industrial ya que n un alto poder colorante y estabilidad a altas temperaturas. Sin embargo, la síntesis del pigmento es particularmente problemática debido a su mecanismo de reacción. Al tratarse de un pigmento encapsulado, resulta fundamental cómo se encuentran distribuidas las materias primas en la mezcla de reacción. Para evaluar la efectividad del proceso de mezclado, es conveniente definir un parámetro, que es el índice de mezclado, para estimar el grado de homogeneidad del sistema. En el presente trabajo de investigación se propone un índice de mezclado basado en el espectro de potencia de la transformada de Fourier de imágenes obtenidas con el microscopio electrónico de barrido de las mezclas de materias primas. Concretamente, el número de píxeles en un cierto rango de valores en la imagen del espectro de potencia parece funcionar relativamente bien como índice de mezcla. Este índice permite distinguir entre muestras con diferentes circonas y óxidos de hierro uitilizados como precursores. El índice de mezcla propuesto se relaciona con el poder colorante del pigmento final cuando durante la síntesis se genera suficiente cantidad de circón para encapsular las partículas de hematites.
The zirconium iron coral pigment (Colour Pigments Manufacturers Association number code 14-44-5) is one of the most important zircon-based pigments (together with the zircon-vanadium blue and the zircon-praseodymium yellow) due to its colour intensity and thermal stability up to 1380°C in all types of glazes [1–4]. Many authors suggest that the presence of hematite inclusions in the zircon matrix is the main responsible for the pigment's colour [3,5–8].
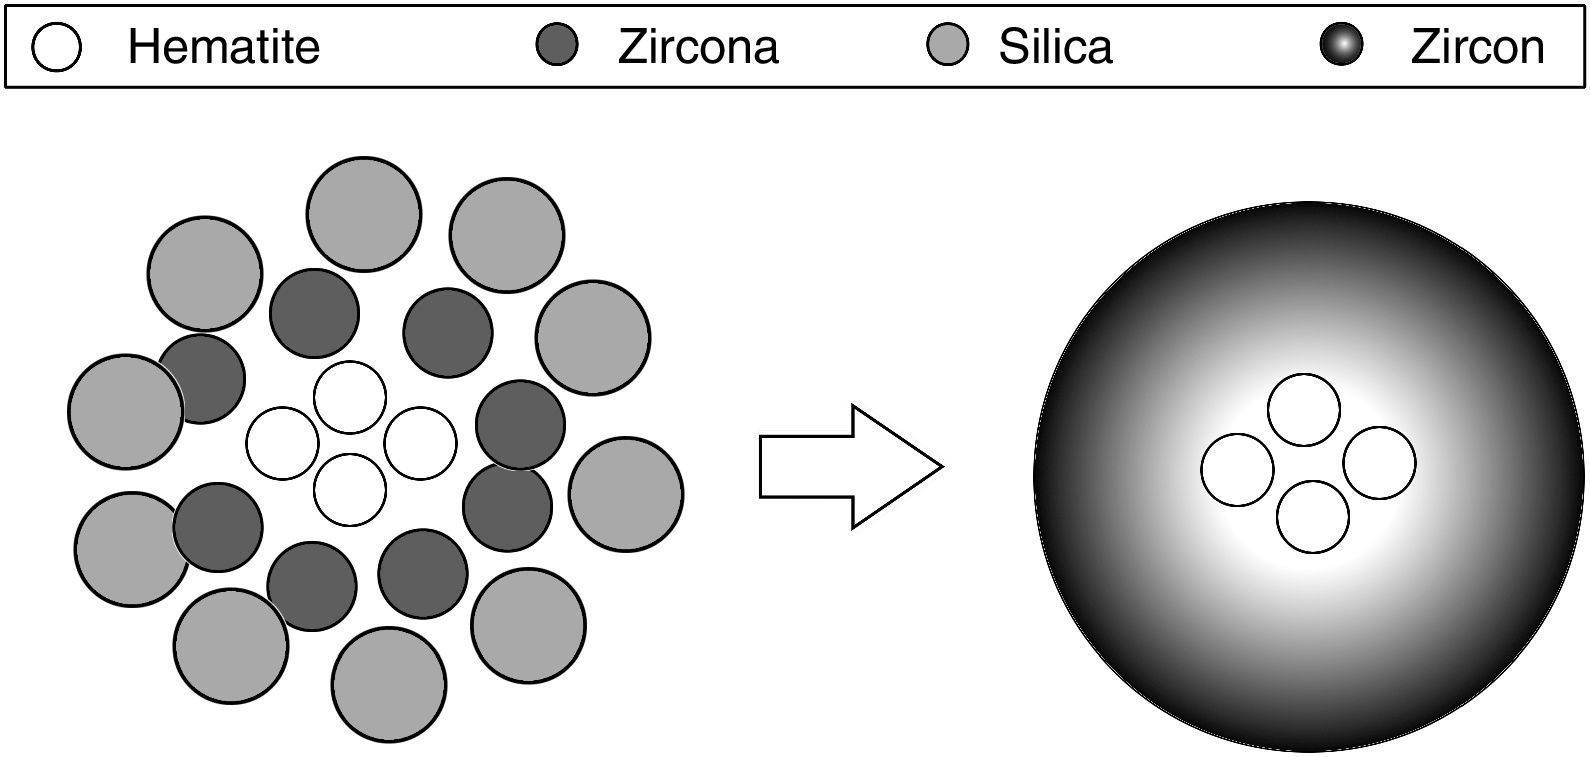
The traditional ceramic synthesis of iron coral pigment starts with a mixture of an appropriate hematite precursor with zirconia, silica and different mineralizers [9]. The stoichiometry of zircon synthesis is very simple, but the presence of mineralizers and the chromophore in the industrial synthesis of coral pigment implies a complex mechanism. It has been proposed that silica can be transported in both liquid phase and gas phase to the zirconia particles’ surface, depending on the operating conditions, where it reacts. However, no transport mechanism has been described for hematite. Considering that the zircon synthesis and the hematite encapsulation must be simultaneous processes, the iron coral manufacture is particularly difficult due to many variables that affect the formation process of the protective zircon shell around hematite particles [10–13]. Obviously, the spatial distribution of raw material's particles is very important and it is related to the pigment's colouring power. Fig. 1 schematizes the hypothetical recommendable spatial distribution of the raw material's particles.

Numerous studies propose that the iron coral formation is influenced by factors such as the synthesis method, the precursors used in the composition and the mixing or milling process [6,13–19]. Additionally, particle's properties of the raw materials as size, density, shape, morphology and resilience are related to the homogeneity and reactivity of the system [20].
To evaluate the effectiveness of the mixing process, it would be convenient to define an easily measurable parameter as a mixing index, to estimate the degree of homogeneity of the raw material's mixture. Most mixing indexes proposed in the literature [21] were developed for binary mixtures and were based on statistical parameters, mostly the standard deviation or variance among samples drawn from a mixture. However, such indexes depend largely on the size as well as on the number of samples taken from the mixture. Indeed, many authors as Lacey or Poole [22,23] tried to establish a relation between the coefficient of variation and the sample size in a mixture. Their results demonstrate the dependence of homogeneity and the degree of randomness of the mixture on sample size, as well as the effect of the sample size on the mixing index.
Furthermore, the study of systems with several components with different particle size distribution is a complicated task because the mathematics involved are often quite complex and, on the practical side, the calculations are very tedious and require matrix manipulation and computer-based methods [21,24–27].
In a different approach, Shin and Fan [28] published a paper describing the applicability of the signal processing for the characterization of solid's mixtures. Concretely, the Fourier transform of the images obtained from a mixture of components could be employed to define a mixing index, evaluating some characteristics of the power spectrum of the transform (power spectrum is defined as a representation of the magnitude of the various frequency components of a 2D image that has been transformed with the Fourier transform algorithm from the spatial domain into the frequency domain [29]). In addition, the power spectrum obtained from the Fourier transform has a more interesting physical meaning that some statistical parameters listed above such as the standard deviation. The results obtained demonstrated how power spectrum of an image could be used as mixing index and studied the relationship between the homogeneity of a solids mixture and its power spectrum. Furthermore, this index allowed distinguishing between mixtures whose components were randomly distributed and ordered mixtures, that is, with segregated components. Nevertheless, this research was based on mathematical models and theoretical cases, without reference to real systems.
As it has been stated, the Fourier transform is one of the image-processing tools that can help to interpret homogeneity in a solids mixture, and when digital images are used, the Discrete Fourier Transform (DFT) can be applied. This method decomposes an image into its sine and cosine components, where the number of frequencies corresponds to the number of pixels in the spatial domain image. In addition, the Fourier transform can also be applied to multicomponent particle systems [30,31].
The main objective of mixing processes in the pigment synthesis is to achieve an adequate distribution of the raw materials, trying to reduce the heterogeneity of the mixture before the thermal treatment. In addition, one of the most important aspects that must be taken into account when developing a mixing index is that it has to be implemented before the calcination step in the synthesis of the pigment. In consequence, the methodology proposed in this study is based on Fourier transform of SEM images of the raw material's mixture [28].
The aim of this paper is to propose a mixing index to evaluate the homogeneity of a solids mixture based on experimental data and evaluate its applicability to the synthesis of iron coral pigment.
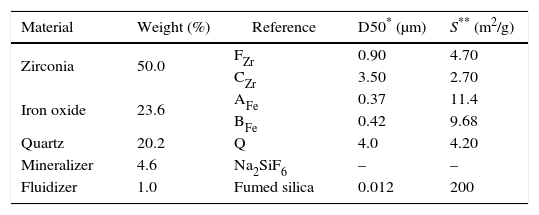
Material and methodsCompositions have been prepared by mixing different precursors in a fixed proportion. The raw materials used are usually employed in the Spanish ceramic pigments industry: two ferric oxides, one from Huntsman Corporation (AFe) and the other one from Huaman Chemical Industry (BFe), two zirconium dioxides (FZr and CZr from Saint-Gobain), quartz (Sibelco), sodium hexafluorosilicate (Sigma Aldrich) as a mineralizer and hydrophilic fumed silica (Aerosil©200 from Evonik) as a fluidizer. The precursor's references, the weight percentage of each one used in the compositions, and some of their technical characteristics (specific surface area and average particle size) are shown in Table 1.
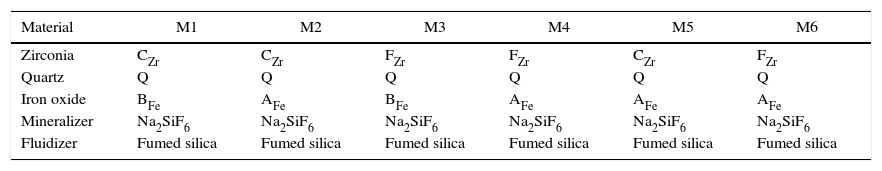
Six compositions were prepared using the selected raw materials. Four of them were dry mixed in a homemade horizontal rotary ball mill (M1, M2, M3 and M4) and the other two compositions were prepared by a wet process with a planetary mill (Pulverisette 5, Fritsch GmbH, Idar-Oberstein, Germany) using acetone as liquid medium (M5 and M6). The homemade mill consists of a cylindrical shell rotating about its horizontal axis made from a porcelain jar partly filled with rounded cylindrical alumina balls. It works on the principle of impact and attrition and the mixing process is done by impact as the balls drop from near the top of the shell. The raw materials used in every mixture are given in Table 2.
Components of the prepared mixtures.
| Material | M1 | M2 | M3 | M4 | M5 | M6 |
|---|---|---|---|---|---|---|
| Zirconia | CZr | CZr | FZr | FZr | CZr | FZr |
| Quartz | Q | Q | Q | Q | Q | Q |
| Iron oxide | BFe | AFe | BFe | AFe | AFe | AFe |
| Mineralizer | Na2SiF6 | Na2SiF6 | Na2SiF6 | Na2SiF6 | Na2SiF6 | Na2SiF6 |
| Fluidizer | Fumed silica | Fumed silica | Fumed silica | Fumed silica | Fumed silica | Fumed silica |
To improve the contact between iron oxide and zirconia in dry-processed mixtures, in a first step, they were dry milled together before adding quartz to ensure that the two materials were in intimate contact. In a second step, quartz was added to the mill jar to complete the mixture [13].
Fourier transform requires images with very good resolution. For this reason, scanning electron microscopy (SEM) was used to obtain mixtures’ images. This technique incorporates an excellent definition of the particles’ contours (thanks to the characteristic depth of field of SEM micrographs), together with the fact that, in backscattered mode, variations in grey level are due to differences in chemical composition (zirconia and silica mostly). In consequence, the whitest areas correspond to the heaviest elements (composition contrast due to the backscattered electron detector) [32].
To obtain the SEM pictures, a fraction of each powdery mixture was slightly compacted using a manual press to shape small cylindrical specimens of 8mm diameter. In a second step, they were pre-sintered at 600°C in a laboratory furnace in order to increase their mechanical resistance. All the prepared samples were observed and photographed with the backscattered electron and secondary electron signal of a field-emission environmental scanning electron microscope (FEG-ESEM, model Quanta 200F, FEI, Oregon, USA), equipped with EDX analysis (Genesis 7000 SUTW, EDAX, Mahwah, USA). Eighteen pictures were obtained from each sample.
To analyze the homogeneity of the samples, the power spectrum of greyscale SEM pictures was obtained using the Fast Fourier Transform (FFT), a function implemented in MicroImage image analysis software (version 4.0, Olympus Optical CO. GmbH, Ballerup, Germany). The power spectrum or spectrum density of a digital image will appear as a roughly circular cloud that is brighter and denser near its centre, so that images containing a regular pattern will reflect pattern-like effects in their spectrum. A parameter commonly used in image analysis is the number of pixels in a specific range of values, so this concept was selected to evaluate the obtained power spectra and define a mixing index. The number of pixels in every selected range of values was obtained from the histogram of the power spectrum, where X-axis represents the grey level (0–255 in a 8-bit greyscale image, where a pixel with a value of 0 is completely black and a value of 255 corresponds to a pixel completely white). Histogram's Y-axis measures the number of pixels in the image possessing every grey level, that is to say, the pixel histogram displays the number of pixels for each tonal value of the image.
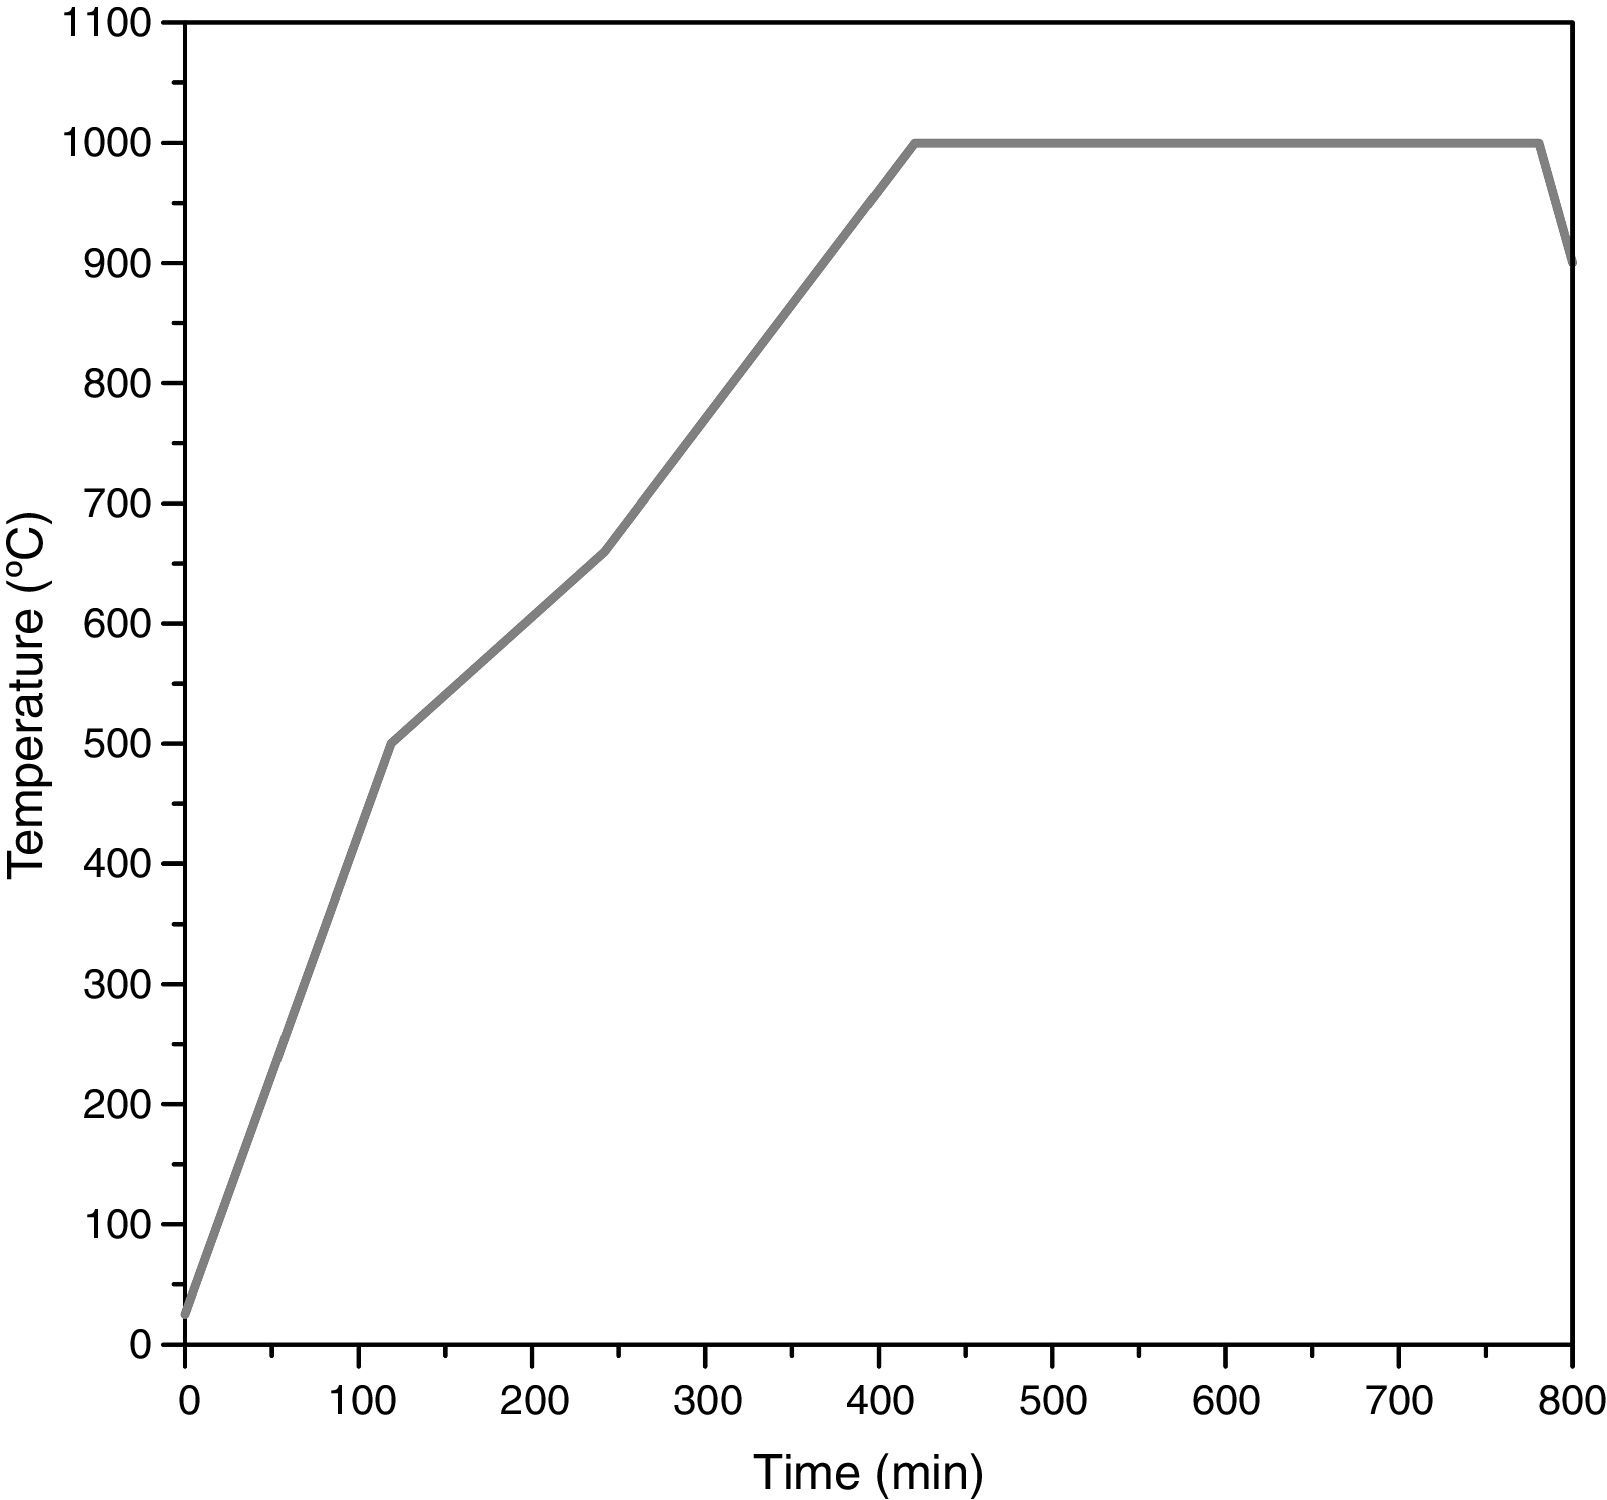
The remainder of the prepared mixtures were calcined in closed mullite crucibles at 1000°C with a soaking time of 6h to synthesize the pigment (thermal cycle in Fig. 2). Every pigment was wet milled and dried under infrared lamps for 24h. Finally, the obtained powder was homogenized in an agate mortar.

The mineralogical characterization of each pigment was carried out using a D8 Advance diffractometer (Bruker AXS GmbH, Karlsruhe, Germany) with CuKα radiation, with a PSD (VÅNTEC-1) solid-state detector. Generator tension and current settings were 40kV and 30mA respectively, and measurements were conducted between 5 and 90° (2θ), with a step size of 0.02° at 0.5s per step. The crystalline phases present in each pigment were identified using ICDD (International Centre for Diffraction Data) powder diffraction files as a reference [33].
Pigments were added (3wt%) to a white and to a transparent ceramic glaze composition in order to test the colouring power [34,35]. The glaze slips were deposited by a roller blade onto a green ceramic tile covered with a white engobe layer. Finally, tiles were fired using typical industrial cycles in an electric laboratory kiln. Tiles with transparent glaze were fired at a peak temperature of 1120°C for 10min and tiles with white glaze were fired at 1040°C for 10min. CIELab chromatic coordinates of the obtained glazed tiles were measured with a spectrophotometer (Colour-Eye 7000A, X-RITE Inc., Grand Rapids, USA), using a standard CIE D65 illuminant and a standard CIE 10° observer.
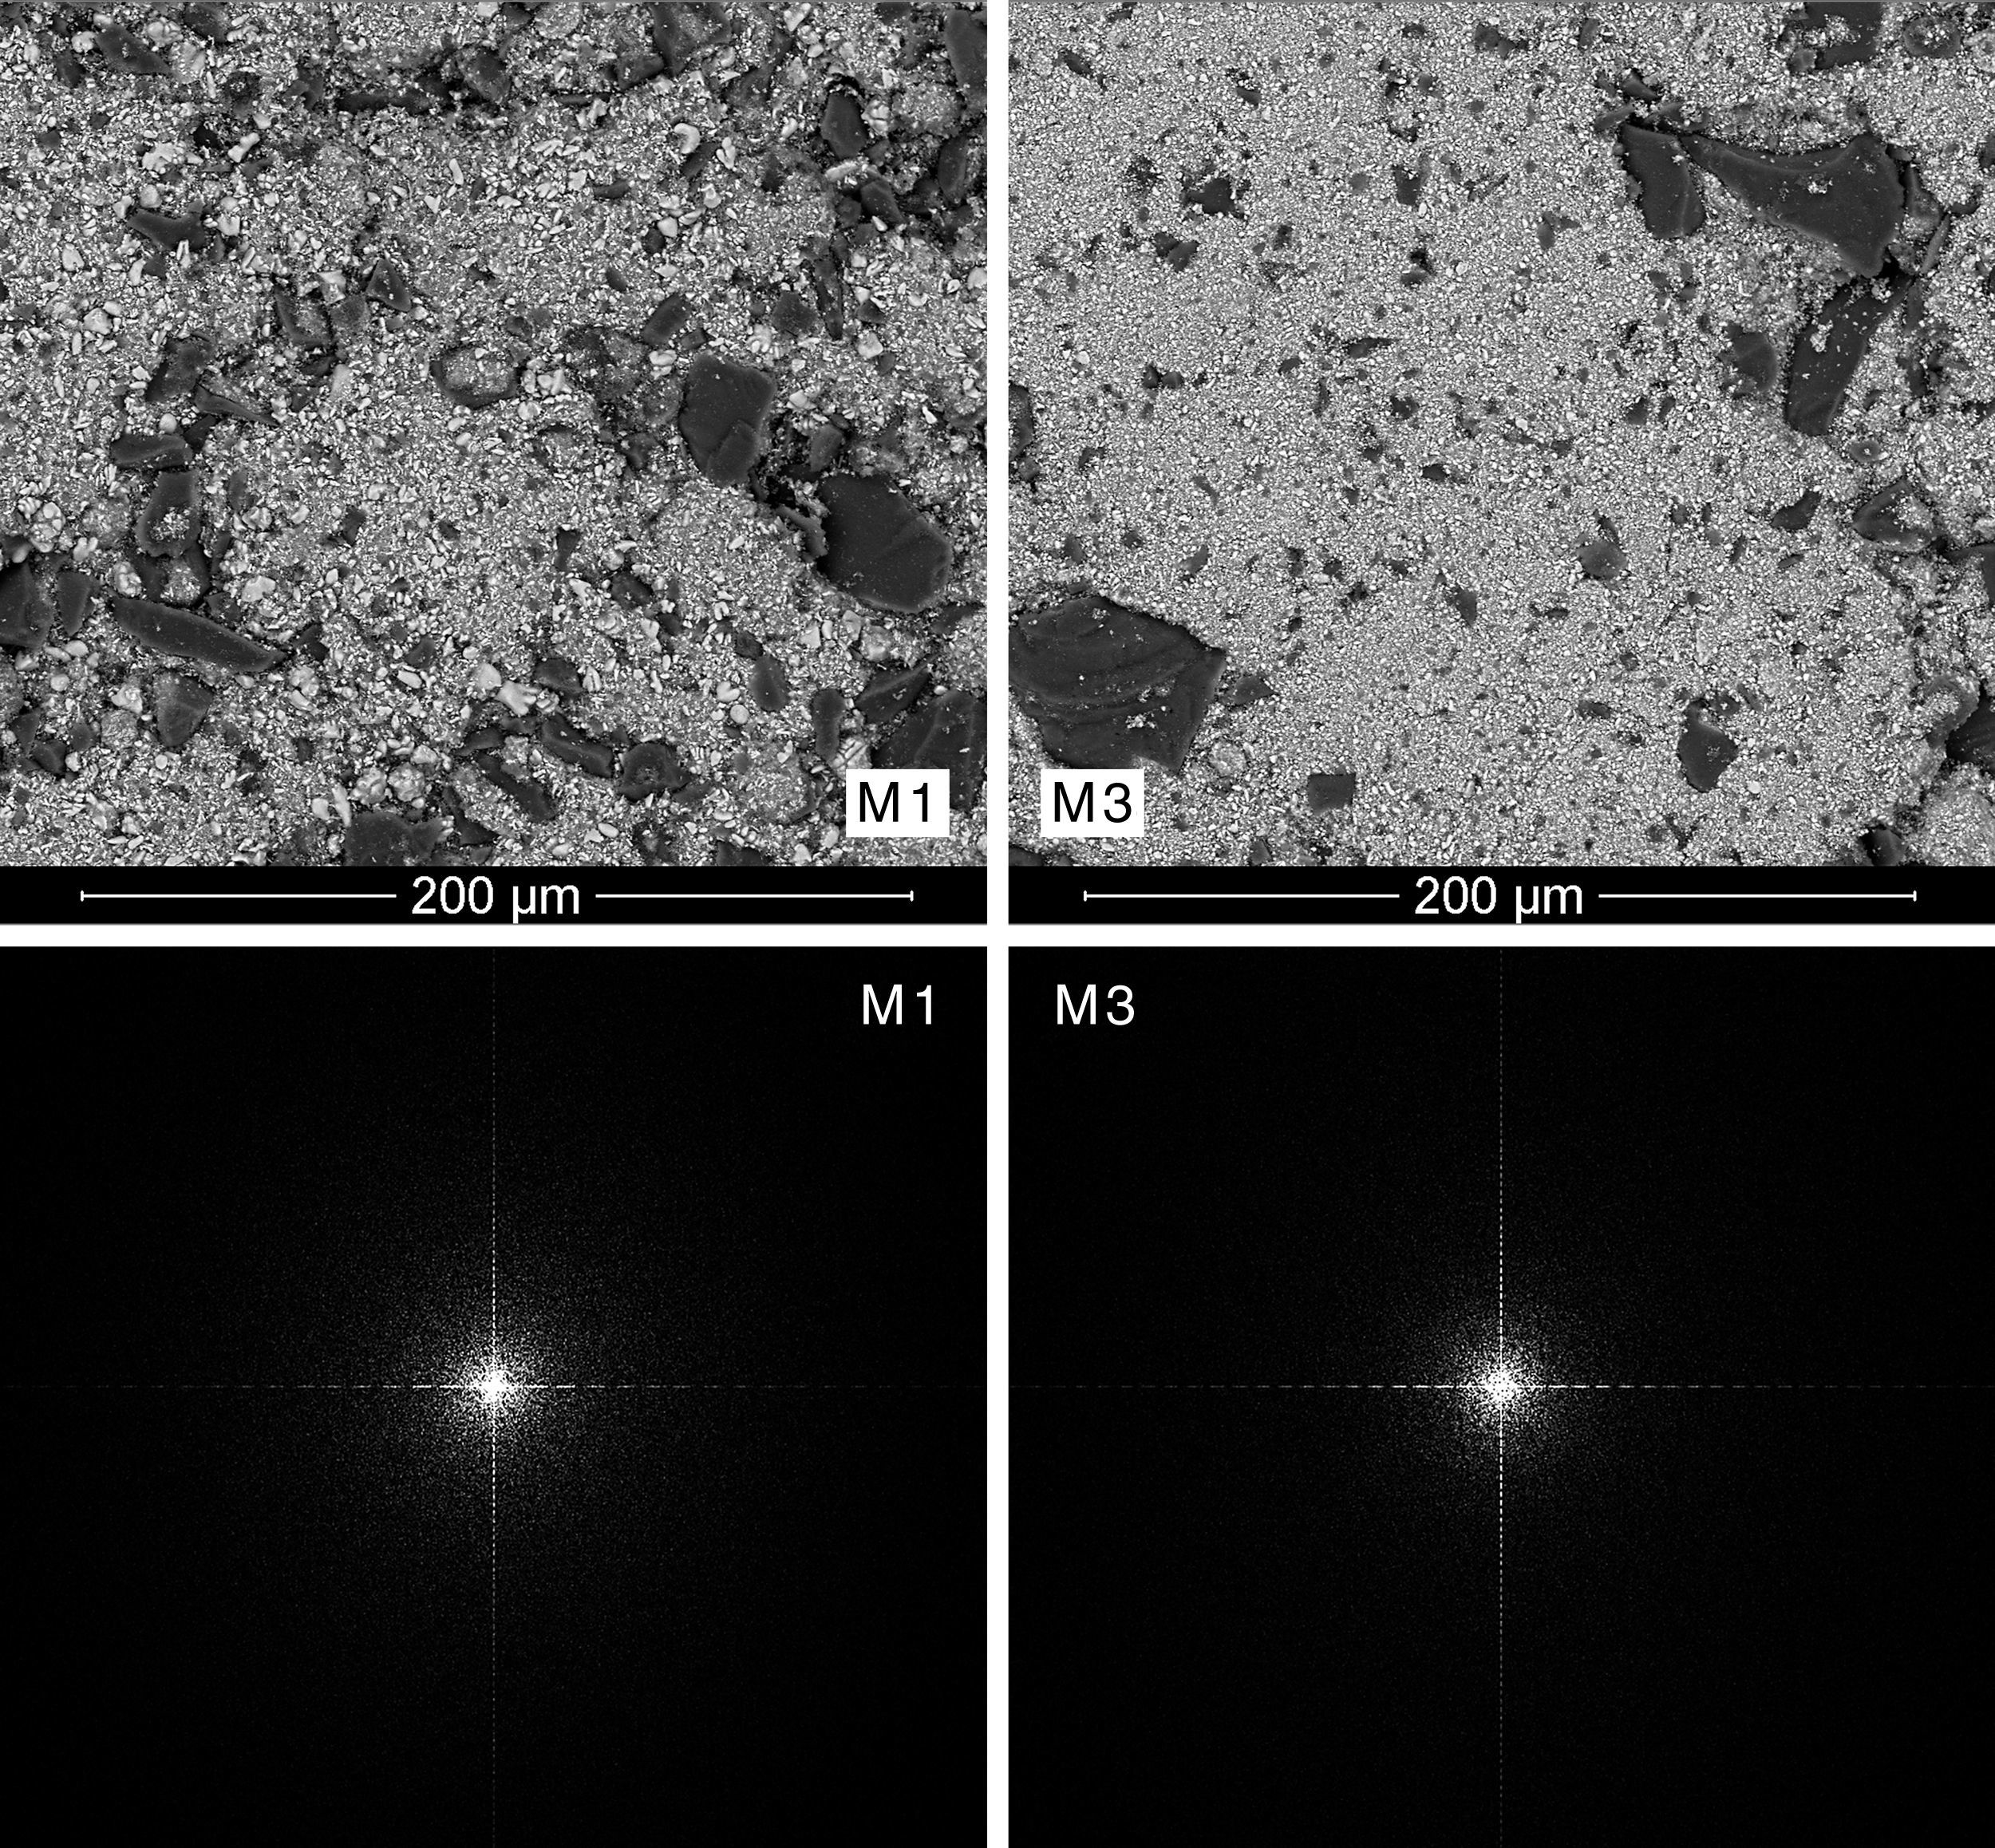
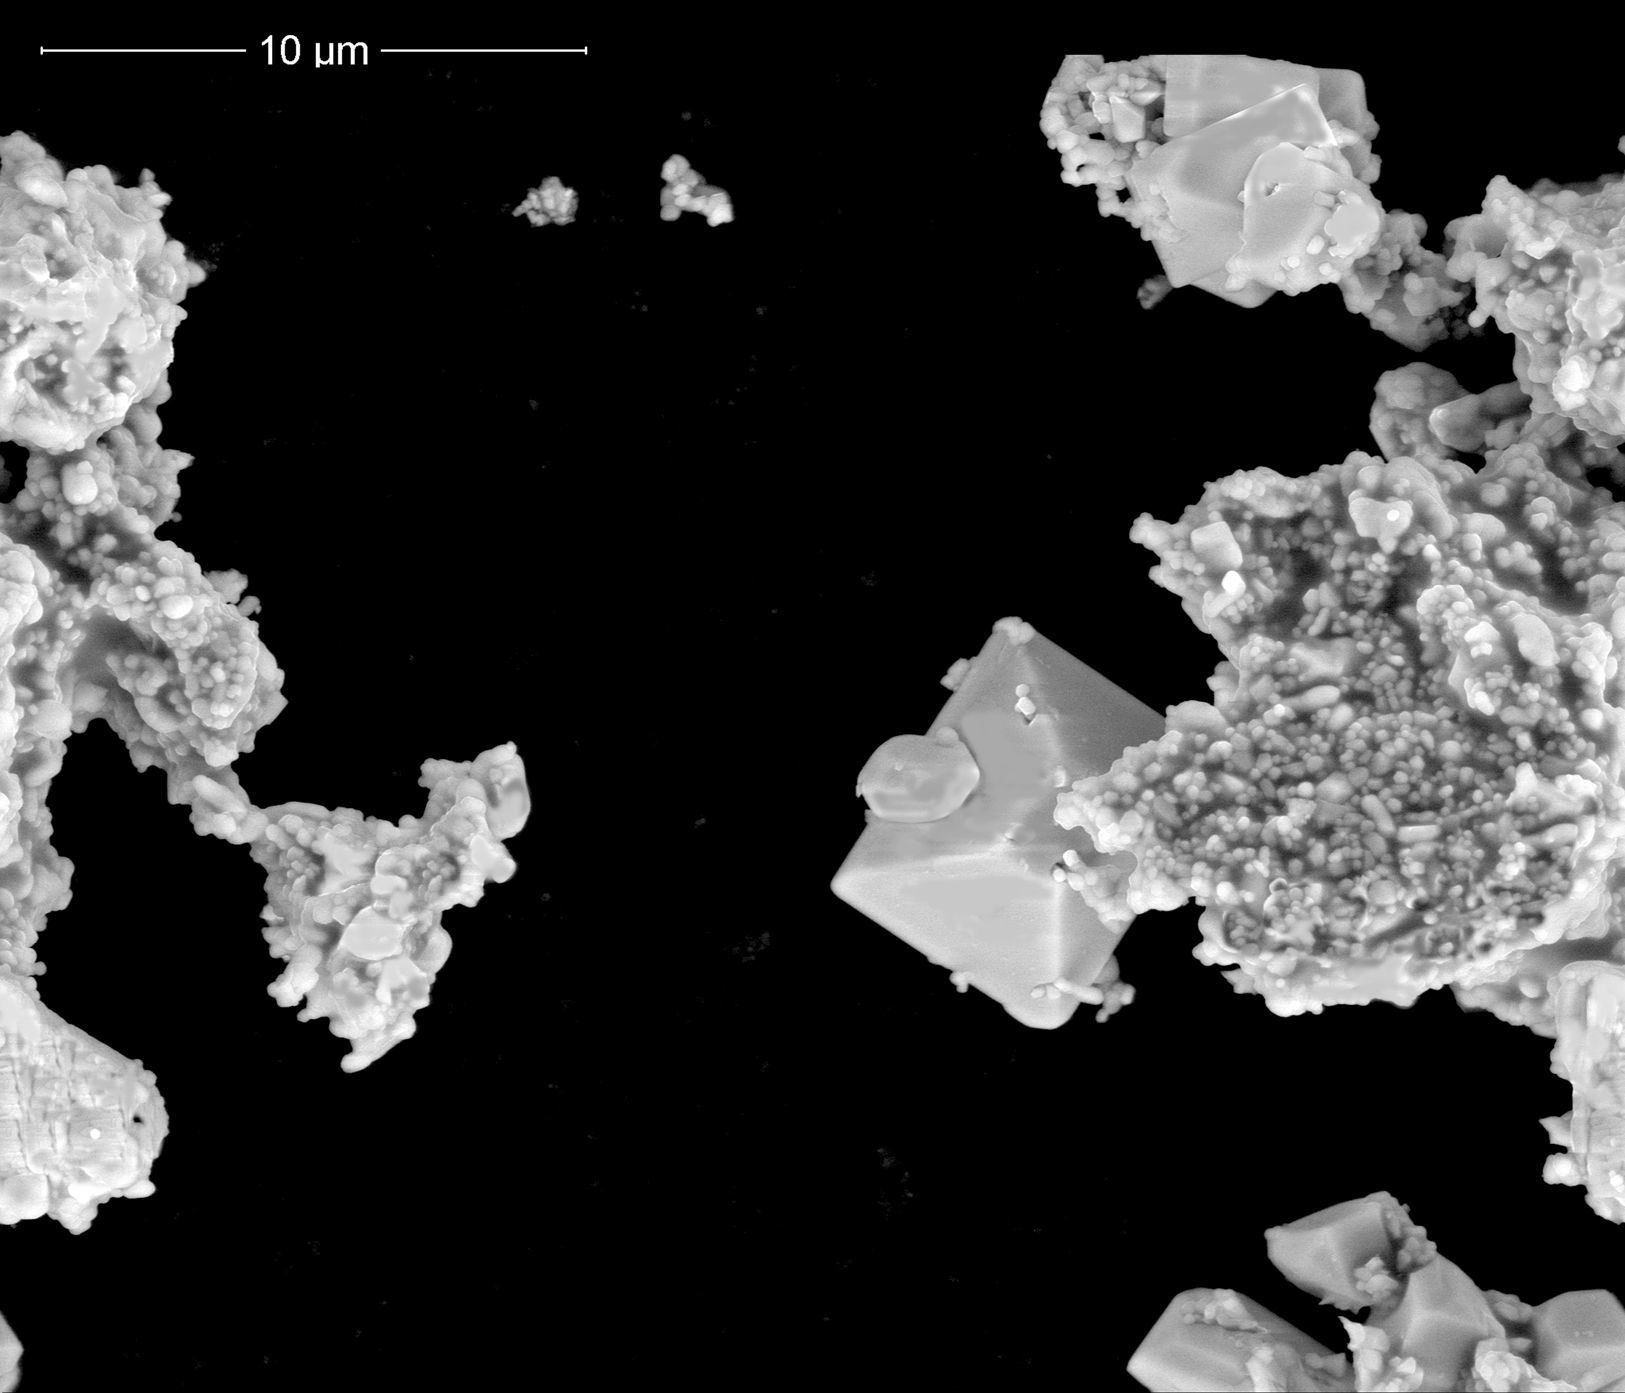
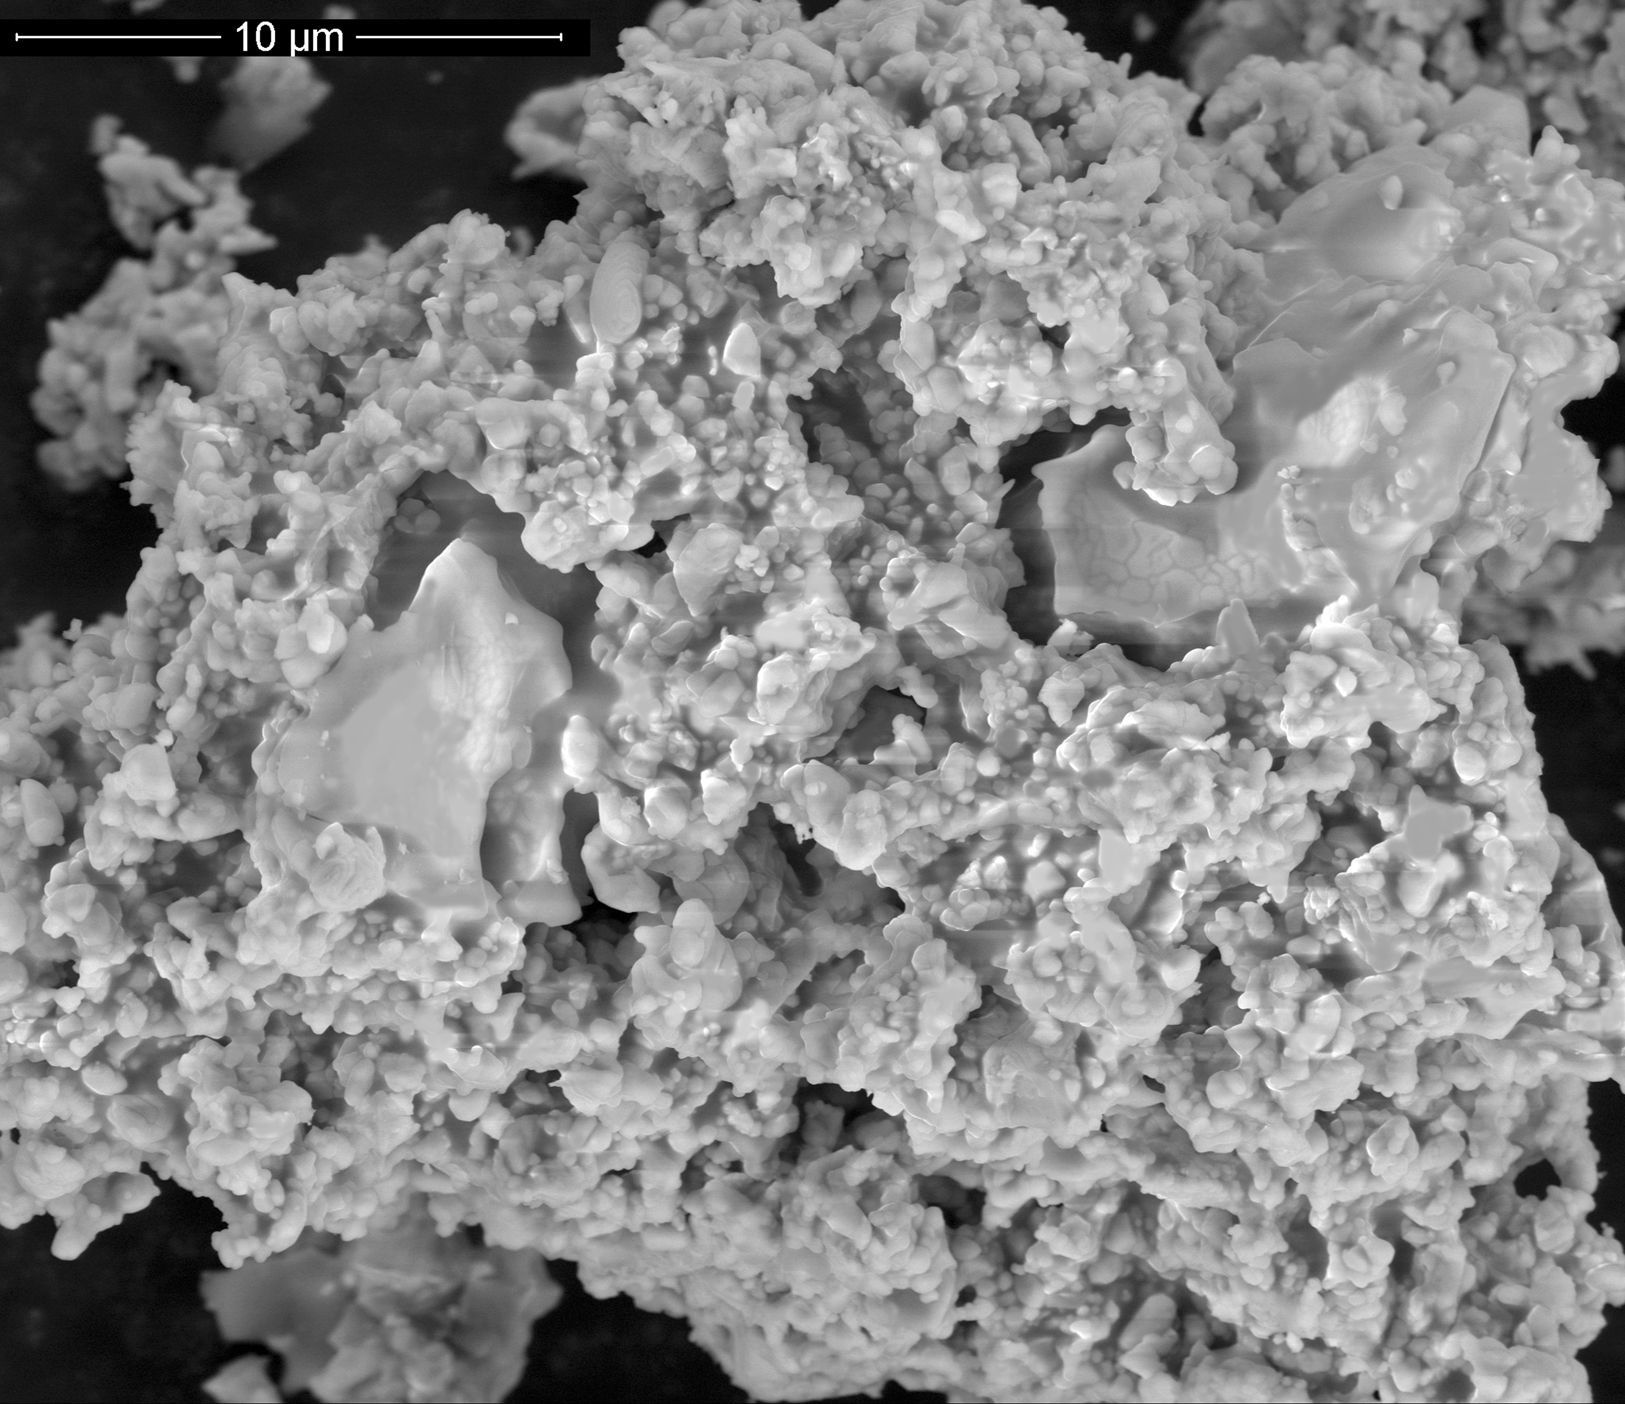
Results and discussionMorphological characterization of the raw materials mixturesExamination by SEM and EDX of the pre-sintered compacts revealed different types of particles: dark, big and angular particles that corresponded to quartz, smaller white and brilliant ones corresponding to zirconia, and very small and numerous elongated particles distributed throughout the matrix that corresponded to iron oxide (Figs. 3 and 4).
 and M3 (FZr-dry mill-BFe).")
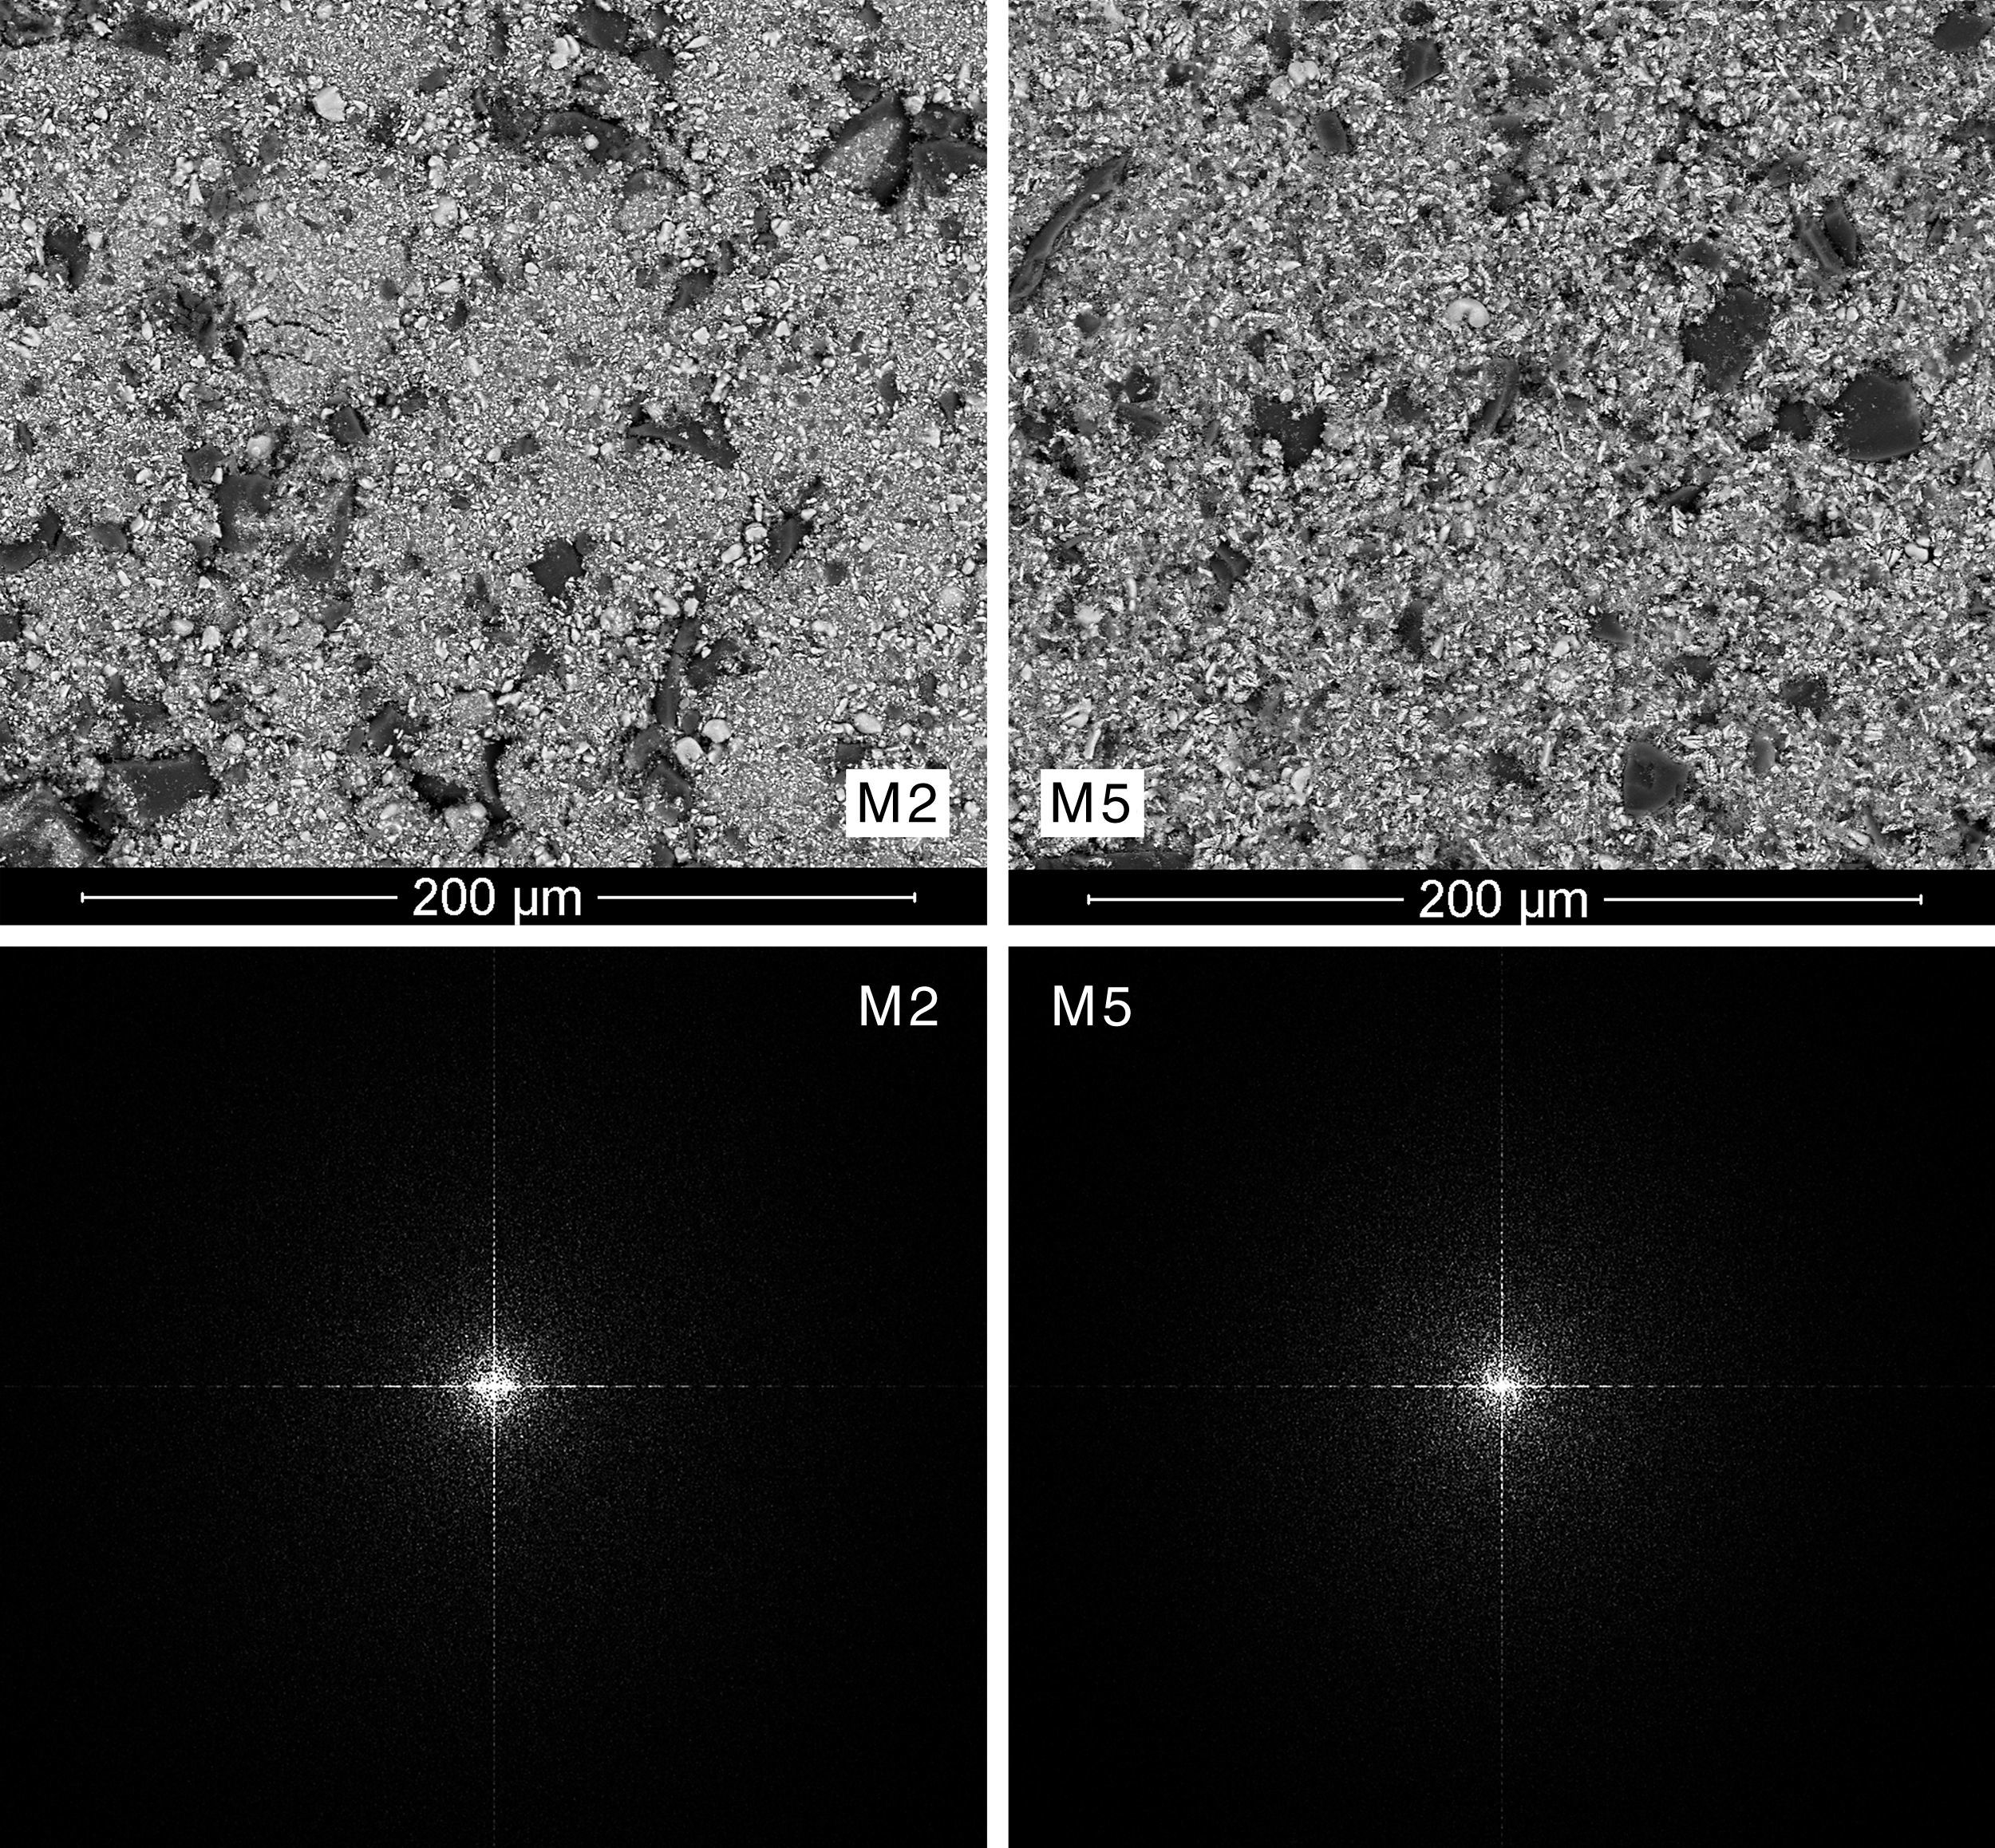
 and M5 (CZr-wet mill-AFe).")
A qualitative trend was deducted by visual analysis of the pictures. The compositions containing the coarsest zirconia (CZr) presented a more heterogeneous appearance, while those compositions prepared with the finer zirconia (FZr) had a homogeneous appearance (Fig. 3). In addition, it was noted that wet-processed compositions seemed to be more intimately mixed than those prepared by dry-mixing (Fig. 4). It should be mentioned that these differences were much more important when coarse zirconia was used in the mixture.
Mixing index proposalThe power spectrum of Discrete Fourier Transform of SEM pictures was star-shaped in all cases (Figs. 3 and 4). However, spectra from the most heterogeneous samples seemed to have a larger star area, that is to say, they had higher number of white pixels around the centre of the star and those pixels were more scattered. On the other hand, the most homogeneous mixtures had a higher periodicity, therefore its Fourier transform needed less significant points, and so the star was formed by a smaller number of white pixels that were less scattered. In fact, the power spectra with smaller star area were obtained from M5 and M6 mixtures, which corresponded to wet-mixed compositions and, in principle, they should be more homogeneous.
Fig. 4 shows power spectra of samples M2 and M5, which had the same raw materials in their composition, the coarsest zirconia and iron oxide AFe, differing only by the mixing process. It can be observed that wet mixing conducts to a power spectrum with more white pixels in the centre of the image, while dry mixing process results in a more scattered image.
Additionally, comparing the power spectra of dry-mixed samples M1 and M3, Fig. 3 shows that power spectrum of the sample with a coarser zirconia (M1) provided the most highly scattered spectrum, while the sample with the finer zirconia (M3) showed a higher concentration of white pixels in the centre of the star and also their number seemed to be smaller.
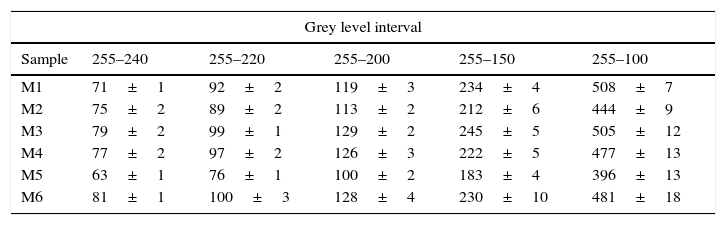
Thus, it was found that with a most effective mixing process, the power spectrum of DFT exhibited lower dispersion of white pixels. Given that pixels with higher value in the power spectrum (maximum is 255 for white colour), include most of the information of the original SEM picture, five ranges of grey levels were defined, in order to identify the range that could be correlated with homogeneity in the mixtures. Then the number of pixels of each spectrum in every selected range was measured. The defined ranges of grey level and the results for the averaged values (X) and standard deviation (σ) for the DFT of eighteen pictures of each one of the compositions are shown in Table 3.
Number of pixels of the power spectrum of DFT of the SEM-micrographs of the mixtures.
| Grey level interval | |||||
|---|---|---|---|---|---|
| Sample | 255–240 | 255–220 | 255–200 | 255–150 | 255–100 |
| M1 | 71±1 | 92±2 | 119±3 | 234±4 | 508±7 |
| M2 | 75±2 | 89±2 | 113±2 | 212±6 | 444±9 |
| M3 | 79±2 | 99±1 | 129±2 | 245±5 | 505±12 |
| M4 | 77±2 | 97±2 | 126±3 | 222±5 | 477±13 |
| M5 | 63±1 | 76±1 | 100±2 | 183±4 | 396±13 |
| M6 | 81±1 | 100±3 | 128±4 | 230±10 | 481±18 |
Differences between the number of pixels of the five selected ranges were relatively small and followed approximately the same trend, but they did not lead to the same results when used to order the samples. Consequently, a strategy was adopted to average the ordering. The deviation with respect to the mean value was calculated for every range, and was expressed as a percentage of the mean value. Then, the average deviation for every sample in the five ranges was obtained. This average value led to the same ordering of the samples that the range 255–200. In consequence, the number of pixels in this range was taken as a tentative “mixing index” (named as Ψ), because its calculation is simpler than the average deviation of the five ranges.
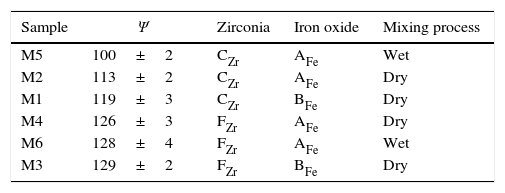
The proposed “mixing index” reflects the influence of the precursors like zirconia and iron oxide used in the compositions, as well as the effect of the mixing process, that is to say wet or dry mixing. As it can be seen in Table 4, M4, M6 and M3 mixtures, which were prepared with the finer zirconia, had a higher Ψ value, and this may be due to the fact that smaller particle sizes generates more complex images. Moreover, comparing wet-mixed samples, M5 and M6, M5 had a smaller Ψ value, due to the use of a coarser zirconia. Therefore, this mixing index could distinguish mixtures based on the particle size of the zirconia present in the composition.
On the other hand, differences could be observed depending on the iron oxide included in the compositions. For a given zirconia, iron oxide BFe generated a higher Ψ value than iron oxide AFe. In consequence, the Ψ parameter allows us to distinguish between the mixtures according to the iron oxide employed, if the other parameters of the mixing process are fixed.
Nevertheless, the proposed “mixing index” does not discriminate the effects of all the variables included in the study. Specifically, Ψ parameter does not allow to classify compositions according to the mixing process because the differences between the obtained Ψ values were of the same order of magnitude than their standard deviation, according to the measurements carried out.
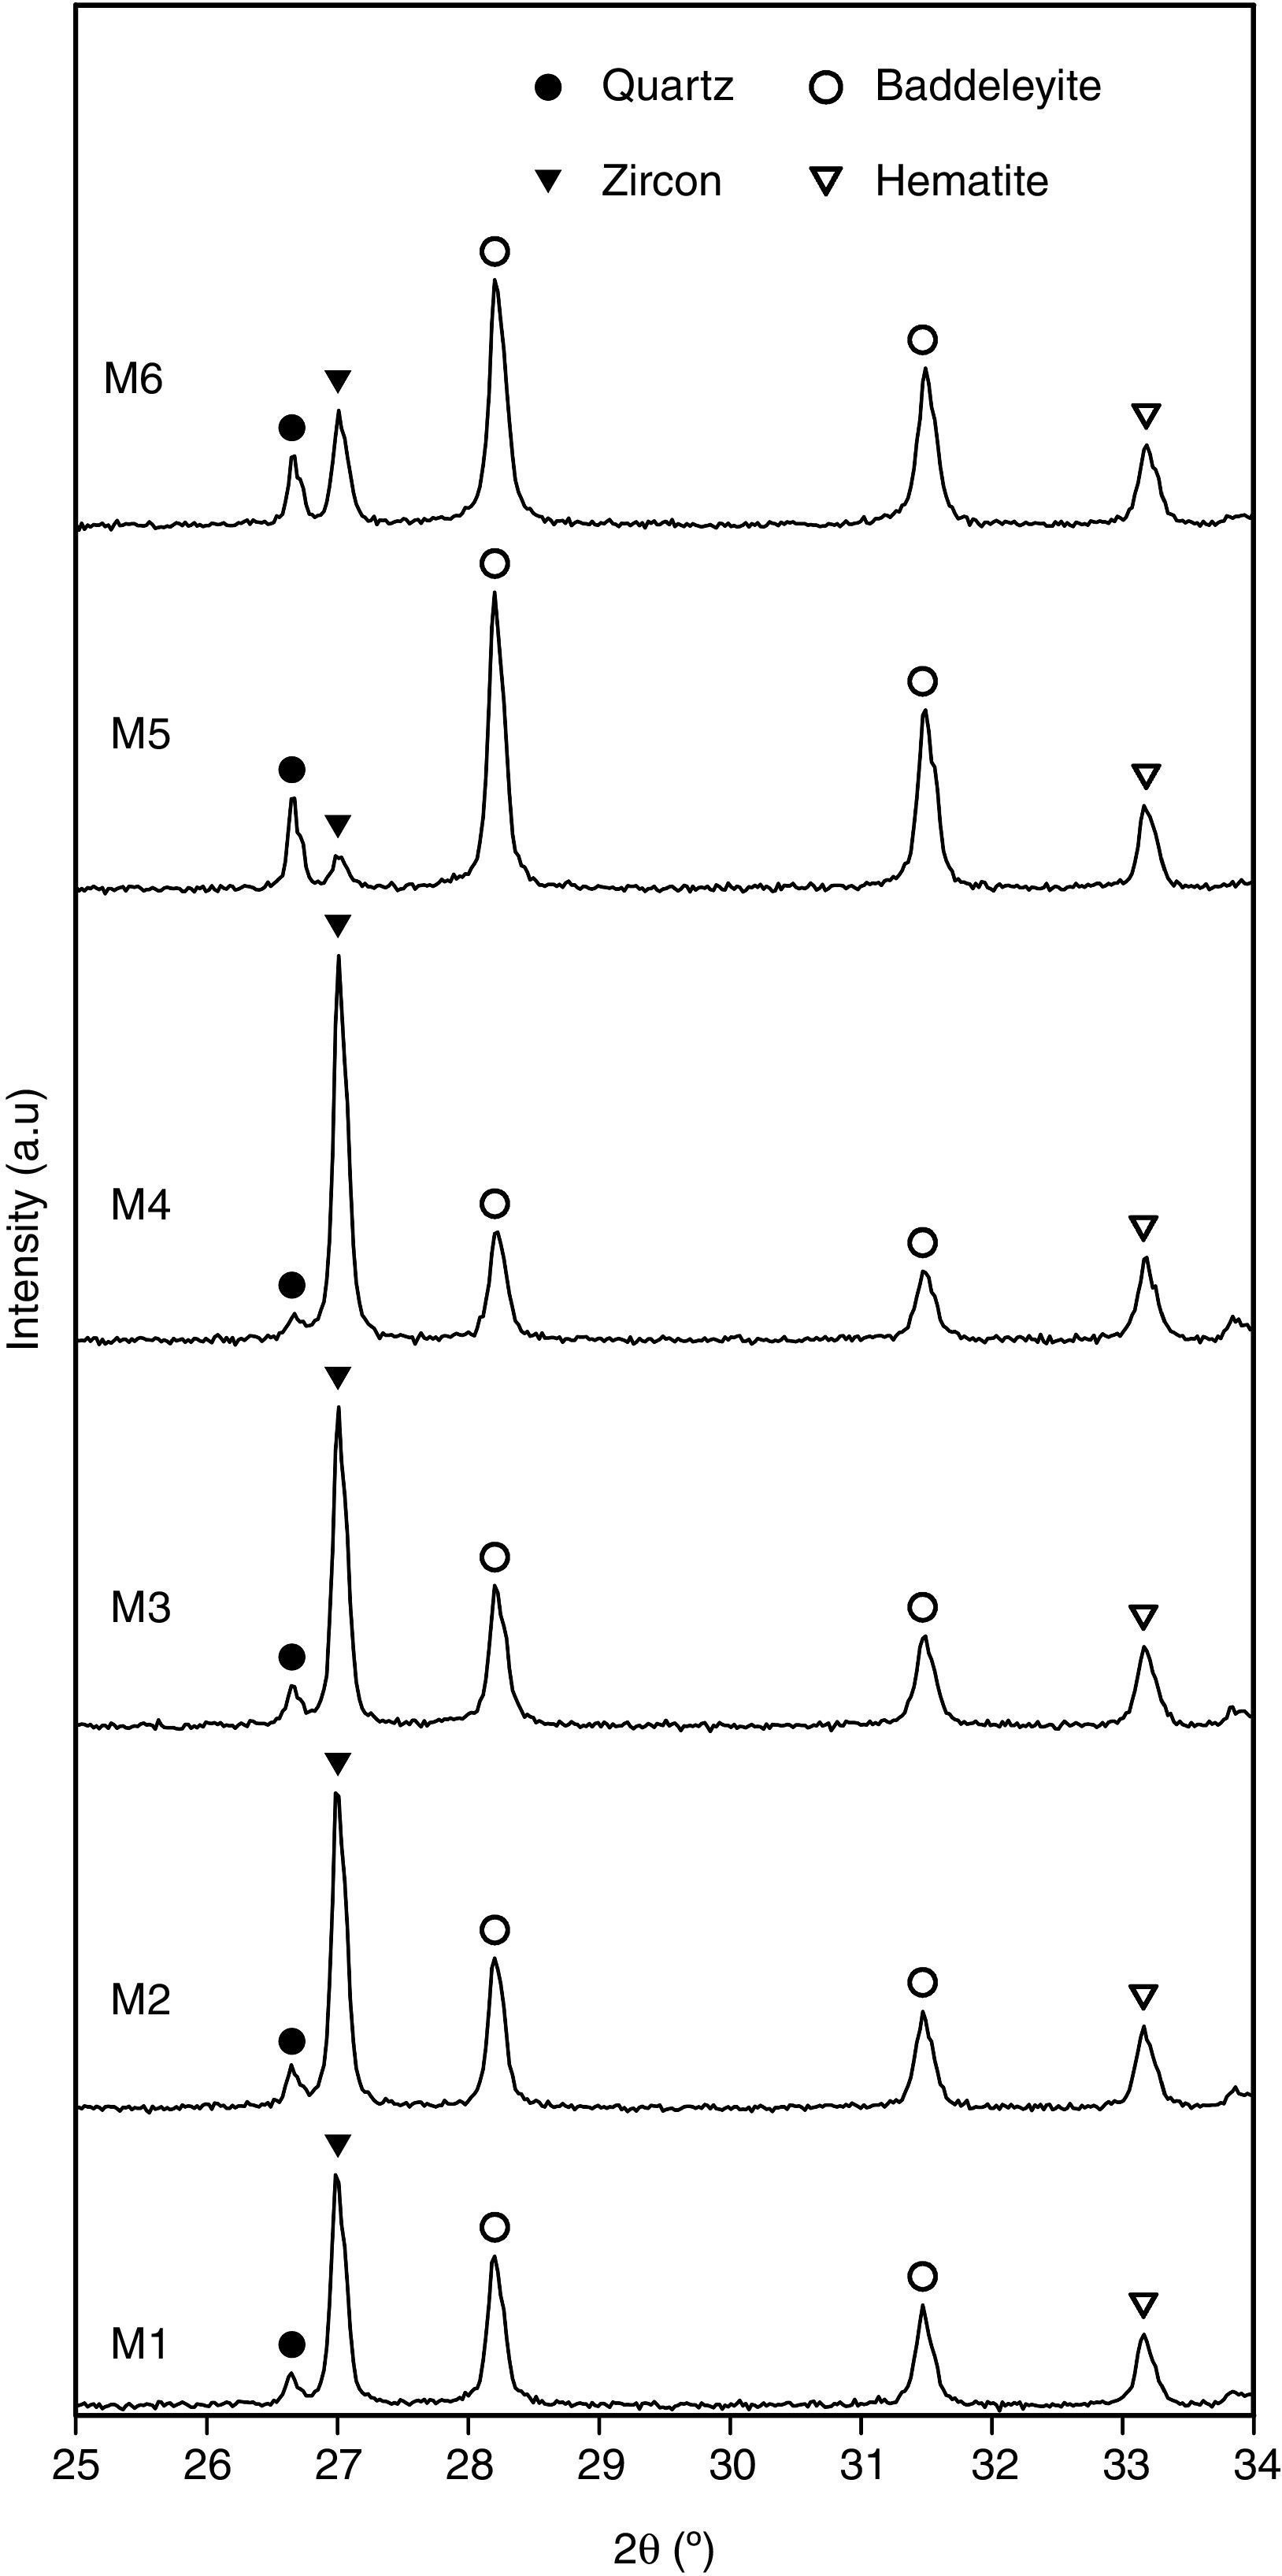
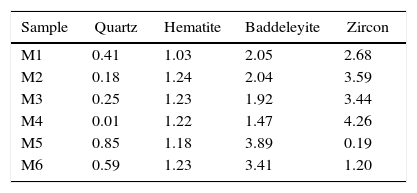
Characterization of the pigmentsIn order to compare the mineralogy of the synthesized pigments, XRD patterns and the X-ray diffraction integrated intensities (cps·2θ) of the strongest reflection of each crystalline phase are shown in Table 5 and Fig. 5. It could be observed that hematite signal was quite similar in the six pigments, indicating that the iron oxide does not react or form a solid solution, or that the solid solution is formed in a similar extent. Regarding the zircon synthesis, pigments obtained from wet-processed mixtures contained the lowest quantities of zircon, and the highest ones of baddeleyite and quartz, which indicates that the reaction has not reached a high degree of conversion. In the case of dry-processed mixtures (M1 to M4), the zircon signal is clearly higher while quartz and baddeleyite signals are lower. In addition, it seems that zirconia FZr and iron oxide AFe (M4) facilitate zircon synthesis (the same trend was detected in wet processed mixtures with FZr zirconia (M6)). The effect of zirconia FZr could be attributed to its low particle size, which increases reactivity. By contrast, it was difficult to explain the favourable effect of iron oxide AFe, as theoretically Fe2O3 does not intervene in zircon synthesis. It can be proposed that iron oxide particles have some steric effect over silica transport in the reacting mixture.

The mineralogical composition of the pigments was not directly correlated with the proposed “mixing index”, as mixtures with similar values of Ψ generated pigments whose zircon content was very different. This fact points to a complex interaction of the reaction mechanism with the spatial distribution of every substance in the raw materials’ mixture. This could be justified by the existence of two transport mechanisms for silica, which could compensate or magnify the effect of the differences in homogeneity over the zircon generation, but no with the hematite encapsulation, as there is no transport mechanism for ferric oxide.
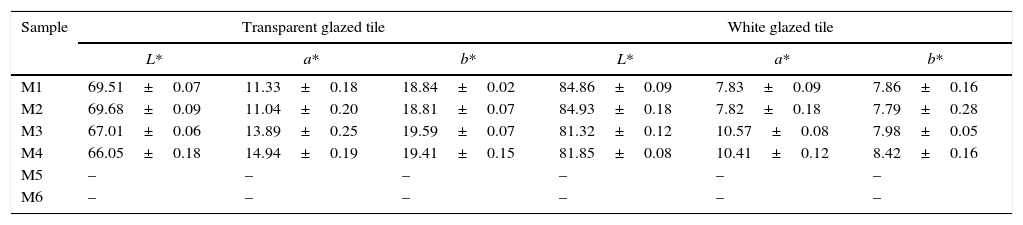
It was found that mixtures prepared by wet-mixing process (M5 and M6) had no colouring power when they were incorporated to transparent and white glazes, so chromatic coordinates were not measured. By contrast, the other four pigments synthesized trough the dry-mixing process generated a significant colouration in the selected glazes, with a pink-coral tone (Table 6). These results agree with the low proportion of zircon formed during the thermal treatment of M5 and M6 mixtures. Probably no zircon enough was formed to encapsulate the hematite and prevent its dissolution in the molten glaze during glaze's firing.
L*a*b* values of iron coral pigment in transparent and white glazed tile.
| Sample | Transparent glazed tile | White glazed tile | ||||
|---|---|---|---|---|---|---|
| L* | a* | b* | L* | a* | b* | |
| M1 | 69.51±0.07 | 11.33±0.18 | 18.84±0.02 | 84.86±0.09 | 7.83±0.09 | 7.86±0.16 |
| M2 | 69.68±0.09 | 11.04±0.20 | 18.81±0.07 | 84.93±0.18 | 7.82±0.18 | 7.79±0.28 |
| M3 | 67.01±0.06 | 13.89±0.25 | 19.59±0.07 | 81.32±0.12 | 10.57±0.08 | 7.98±0.05 |
| M4 | 66.05±0.18 | 14.94±0.19 | 19.41±0.15 | 81.85±0.08 | 10.41±0.12 | 8.42±0.16 |
| M5 | – | – | – | – | – | – |
| M6 | – | – | – | – | – | – |
Furthermore, it should be noted that lightness (L*) measured in white and transparent glazes was greater when the coarse zirconia was incorporated to the composition (M1, M2), while this parameter was not influenced by the iron oxide used in the synthesis. On the other hand, red component (a*) had greater values when the finer zirconia was introduced (M3, M4) in the composition and it was observed that the effect of the iron oxide depends on the glaze to which the pigment is incorporated. These effects were not observed with coarse zirconia.
The analysis of the chromatic coordinates clearly indicated that the finer zirconia was the most suitable to synthesize the pigment from the mixtures prepared according to the dry-mixing process, although in this case the colouring power depended on the type of iron oxide incorporated as chromophore. By contrast, the coarser zirconia allowed synthesizing pigments with lower colouring power but it was less sensitive to the characteristics of the chromophore.
There was a linear relation between the L* and a* coordinates generated in every glaze, but b* was nearly constant and showed a low correlation with the other chromatic coordinates. The obvious interpretation is that the more hematite is encapsulated, the more saturated the red component is and, as a consequence, the lower the lightness of the pigment colour. A slight trend between the chromatic coordinates of the glazes and the proposed “mixing index” has been found. As the Ψ value of the raw materials’ mixture increased, the glazes that incorporate the generated pigments were darker and redder. Probably, the higher values of “mixing index” facilitates the encapsulation of hematite particles, but only if the reaction can produce enough zircon to generate the protective shell. This condition was probably the reason for the low colouring power of M6 pigment despite the high value for the “mixing index” of their raw materials’ mixture.
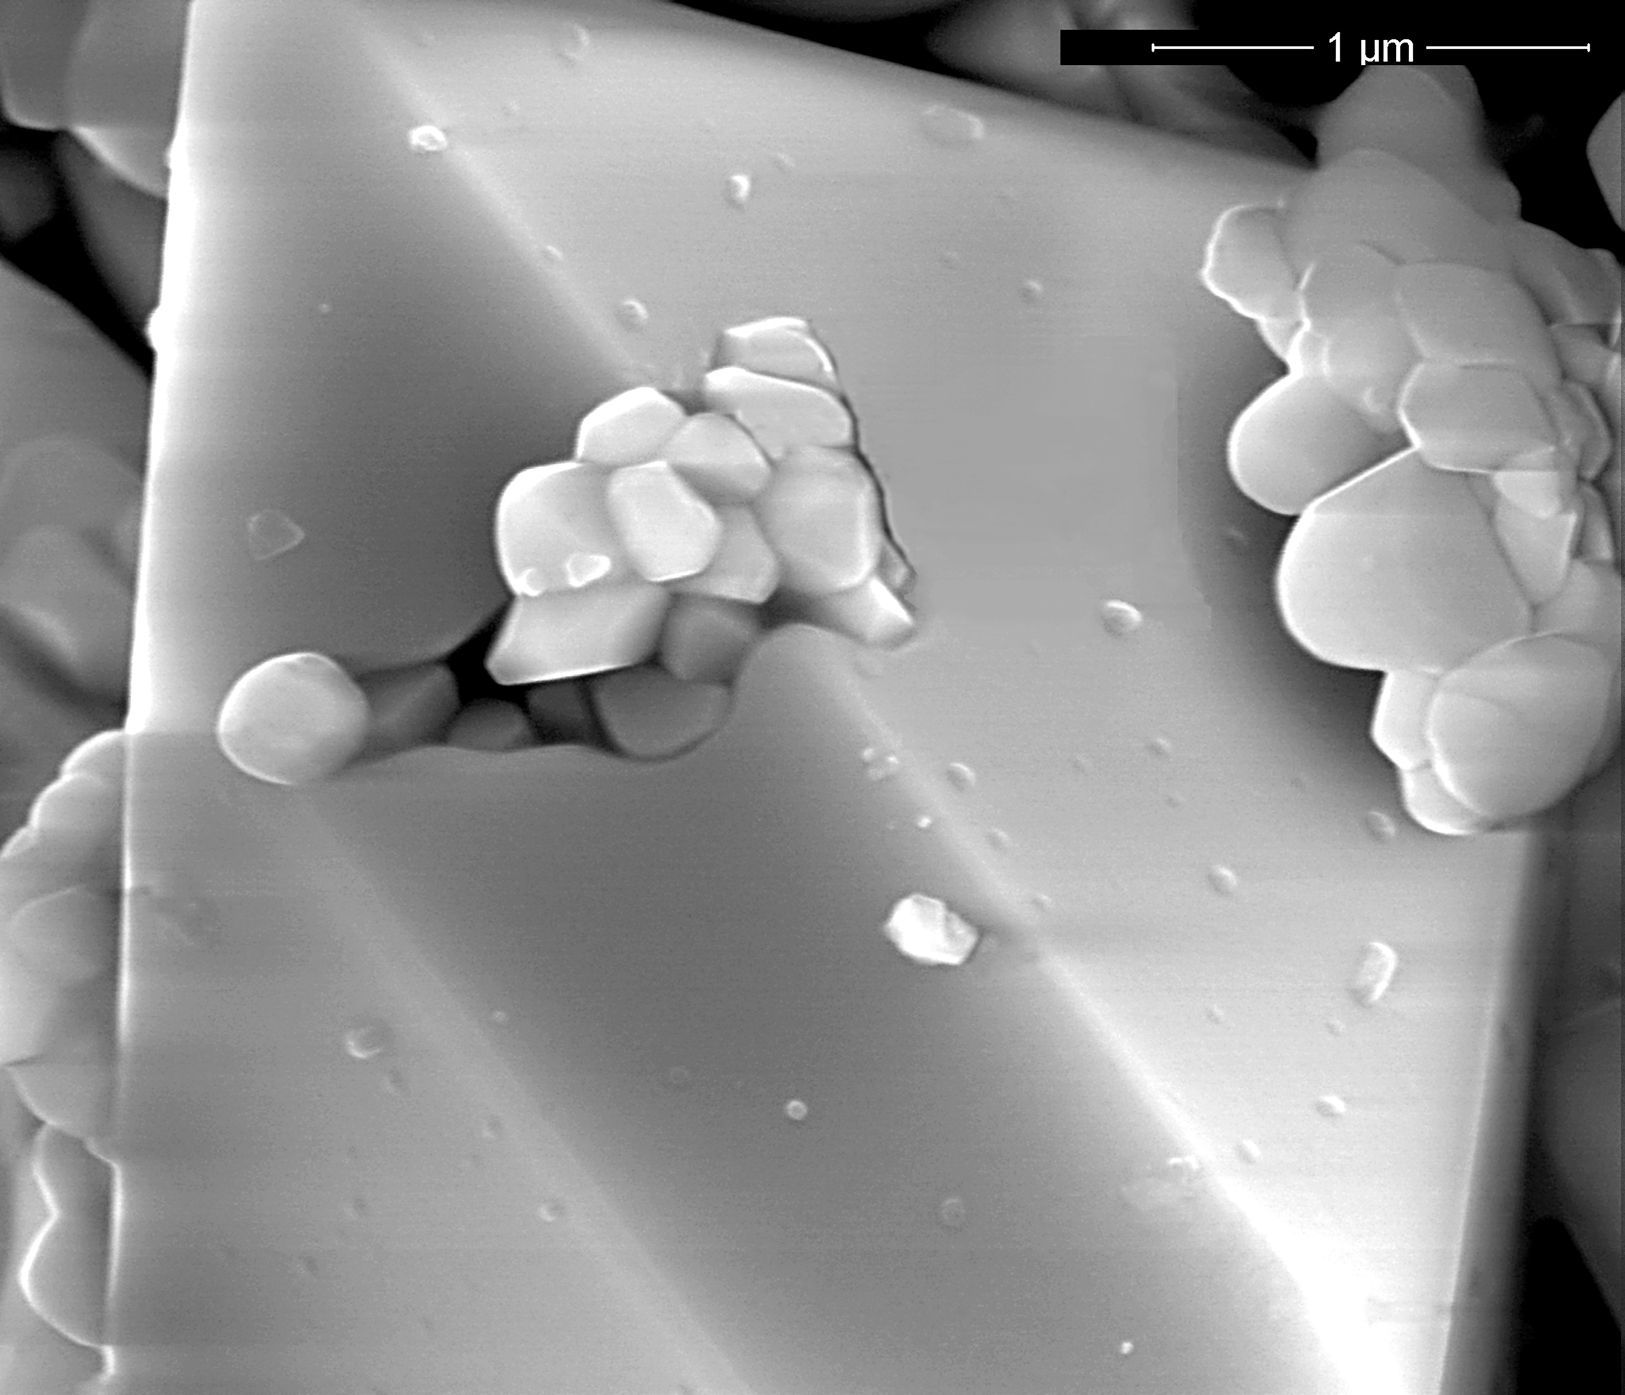
In order to justify the differences in colour development between pigments synthetized by wet or dry mixing that have similar values of Ψ, it was decided to analyze the microstructure of the pigments with SEM. SEM-images showed that the type of processing also influenced the microstructure of the pigments. The microstructure of the wet-processed pigments consisted of irregular zircon crystals and vitreous phase, while in the dry-processed samples well-formed zircon crystals were also detected (Figs. 6–8). It could be considered that the best homogeneity achieved by wet mixing facilitates the formation of a viscous liquid phase from the silica and mineralizer, which reacts slowly with zirconia. This mechanism would complicate the growth of zircon crystals, and consequently the encapsulation of hematite particles. In the case of dry-processed mixtures, the reduced homogeneity could facilitate the transport of silica through the gas phase. This mechanism would be responsible of the growth of large crystals of zircon, which encapsulate hematite particles during the process and this shell would be probably a better protection to hematite than the small zircon particles generated simultaneously by the liquid phase transport of silica [3,5,6,36,37]. So as to ascertain the validity of Ψ as “mixing index” this parameter must be determined for raw materials mixtures of pigments whose reaction mechanism of synthesis is not so complex as for the iron zircon coral.
Conclusions.")
.")
.")
A mixing index has been proposed for the iron zircon coral pigment's raw materials mixture derived from SEM-micrographs of the mixture. This index is defined as the number of pixels in the range 255–200 of the power spectrum of the Discrete Fourier Transform of the SEM-micrographs. The index allows the classification of the mixtures depending on the raw materials used in their preparation (zirconia and iron oxide), but not by the mixing method (dry or wet).
The mineralogy of the pigment does not directly relate with the mixing index, a fact that points to a complex interaction between the mass transport mechanisms during pigment's synthesis and the spatial distribution of the reactants. By contrast, a slight positive relation between mixing index and chromatic coordinates L* and a* generated by the pigment in glazes has been detected when the reaction generates enough zircon to encapsulate the hematite. This encapsulation is better if zircon grows as crystals big enough to surround completely hematite particles.
The proposed mixing index is not entirely successful in the present study due to the complexity of this pigment, therefore it could be interesting to apply this mixing index in pigments whose reaction mechanism of synthesis was easier than the observed in the iron zircon coral.
