


This work aims to discuss on the characterization of Algerian dune sand named Boussaâda sand (SB) and its suitability for glass industry. Based on chemical and mineralogical analyses of SB by XRF and XRD, quartz, kaolinite, calcium carbonates and albite are the main mineralogical phases found. However, Fe2O3 content is relatively low (<0.24wt%). Optical properties of the elaborated glass determined by UV-Visible Spectroscopy reveal that SB based glass (GB) presents better light transmission than industrial used sand (ST) based glass (GT). The CIE L*a*b* color measurements show that the sample is colorless. Knoop Hardness measurements indicate that GT is more hard than GB. Chemical durability tests reveal that in an acid solution, GB is more resistant, whereas it is more vulnerable in the presence of alkaline and HF solution. Furthermore, TiO2 additions in SB-based glass improve the clarity and transparency of the glasses (from L*=87.67 to L*=91.05 with 1wt% of TiO2). Thus, when TiO2 content increased, Knoop microhardness enhance (from 451 to 469 HK with 0.1wt% of TiO2). An increase in the glass chemical durability of the samples in acidic and alkaline solutions is noticed when trace amounts of TiO2 are added to the glass.
Este trabajo tiene como objetivo la caracterización de arena de duna Argelina llamada arena Boussaâda (SB) y su idoneidad para la industria del vidrio. Basado en análisis químicos y mineralógicos de SB por XRF y XRD, cuarzo, caolinita, carbonatos de calcio y albita fueron las principales fases mineralógicas encontradas. Sin embargo, el contenido de Fe2O3 es relativamente bajo (<0.24% en peso). Las propiedades ópticas del vidrio elaborado determinadas por espectroscopia UV-Visible. Este parámetro revela que el vidrio a base de SB (GB) presenta una mejor transmisión de luz que el vidrio industrial a base de arena (ST) y de vidrio (GT). Las mediciones de color CIE L*a*b* muestran que la muestra es incolora. Las mediciones de dureza Knoop indican que GT es más duro que GB. Las pruebas de durabilidad química revelan que en solución ácida, GB es más resistente, mientras que es más vulnerable en presencia de soluciones alcalinas y de HF. Las adiciones de TiO2 al vidrio a base de SB mejoran la claridad y transparencia de los vidrios (de L*=87.67 a L*=91.05 con 1% en peso de TiO2). Además, se observó un aumento de la durabilidad química de las muestras en solución ácida y alcalina cuando se añadieron cantidades de TiO2.
Algeria possesses large deposits of siliceous raw materials, particularly in the west of the country, where they are linked to the deposits of wind sands. It is mainly these deposits that are exploited for the glass production. These potential resources of siliceous materials are very important because of their distribution, extension and diversity [1].
The Tebessa-treated silica sand, East of Algeria, is exploited as raw material in flat glass industry. However, the demand for this raw material is important that the glass companies are forced to import it from abroad, especially from France (Fontainebleau) to satisfy the demand.
Several research projects valuing Algerian dune sands in the field of construction are carried out in the recent years. Therefore, the development of insulating materials based on Ouargla's sand [2] and the valorization of Djelfa and Boussaâda sands in Cement industry to improve the performance of concrete were the only applications of these sands [3–5]. However, investments in these siliceous natural resources are below expected levels due to the lack of detailed studies on their physicochemical characterization [6], which limits developers to focus on the exploitation of these siliceous sands in glass industry and to provide solutions to the problems of sand supply.
The silica content and the particle size distribution are not the only criteria for the suitability of sands for the glass industry. Most of the time, silica contains trace metallic impurities which affect the process of production as well as the properties of the elaborated glasses [7–9]. One of the most common and undesirable impurity is iron either in ferrous (Fe2+) or ferric (Fe3+) state. This impurity dramatically influences the optical, colorimetric and mechanical properties of glasses [10,11]. Besides, the presence of alumina (clay fraction) yields devitrification phenomena in the glasses. Innumerable researches have been carried out to optimize and improve processes for purification and treatment of sands such as attrition, flotation, washing and magnetic separation [12–14]. Another alternative or complementary operation to these purification processes is carried out at the level of the glass formulations and this by adding small amounts of transitions metal oxides which influence the red/ox state of the iron impurity thus eliminating their undesirable effects on the glasses colorimetric and optical properties [15]. For example, TiO2 addition in small amounts to the glass composition influences the equilibrium of the Fe3+/Fe2+, leading to an improvement in the colorimetric and optical properties of glasses [10,16]. This addition also influences the mechanical and thermo-mechanical properties of glasses by reinforcing the vitreous matrix [10,17,18]. TiO2 containing glasses also possess good chemical durability to acid attack [19].
From this perspective, this work deals with the characterization of the dune sand of Boussaâda located in South East of Algeria. Its valorization in the development of soda-lime-silica glasses is the first objective of this work. An attempt to improve the colorimetric, optical and chemical durability of the glasses produced by adding TiO2 at variable amounts to the glass compositions is the second objective of this work. For these purposes six glass compositions with and without TiO2 addition are prepared. They are denoted GBx, with x=1, 2, 4, 6 and 10 corresponding to 0.1, 0.2, 0.4, 0.6 and 1wt% of TiO2 added, respectively. One sample (GT) with Tebessa sand, used in local glass industry, is also prepared for comparison.
Experimental partRaw materialsThe local materials used in this work are: The dune sand of Boussaâda (SB), Tebessa sand (ST) usually used in the glass industry and natural dolomite (D) [MgCa(CO3)2].
The SB sand is a sample taken in the area situated in the Boussaâda dune cordon. This area is part of the Zahrez Gharbi basin in the high south of Algeria [20]. The dune cordon is a recent geological formation which appears in the end of tertiary and the beginning of the quaternary. It is coming from the soft rocks (marlstone and red clay) which have been extracted by the erosion of the mountain as well as the presence of the salt Limestone, Gypsum and soluble salts [20].
Treatment of Boussaâda sandBefore the preparation of the samples (glass), SB sand is washed several times with distilled water for removing the fine fraction. Then it is dried in ambient air, sieved to a particle size greater than 100μm and ground.
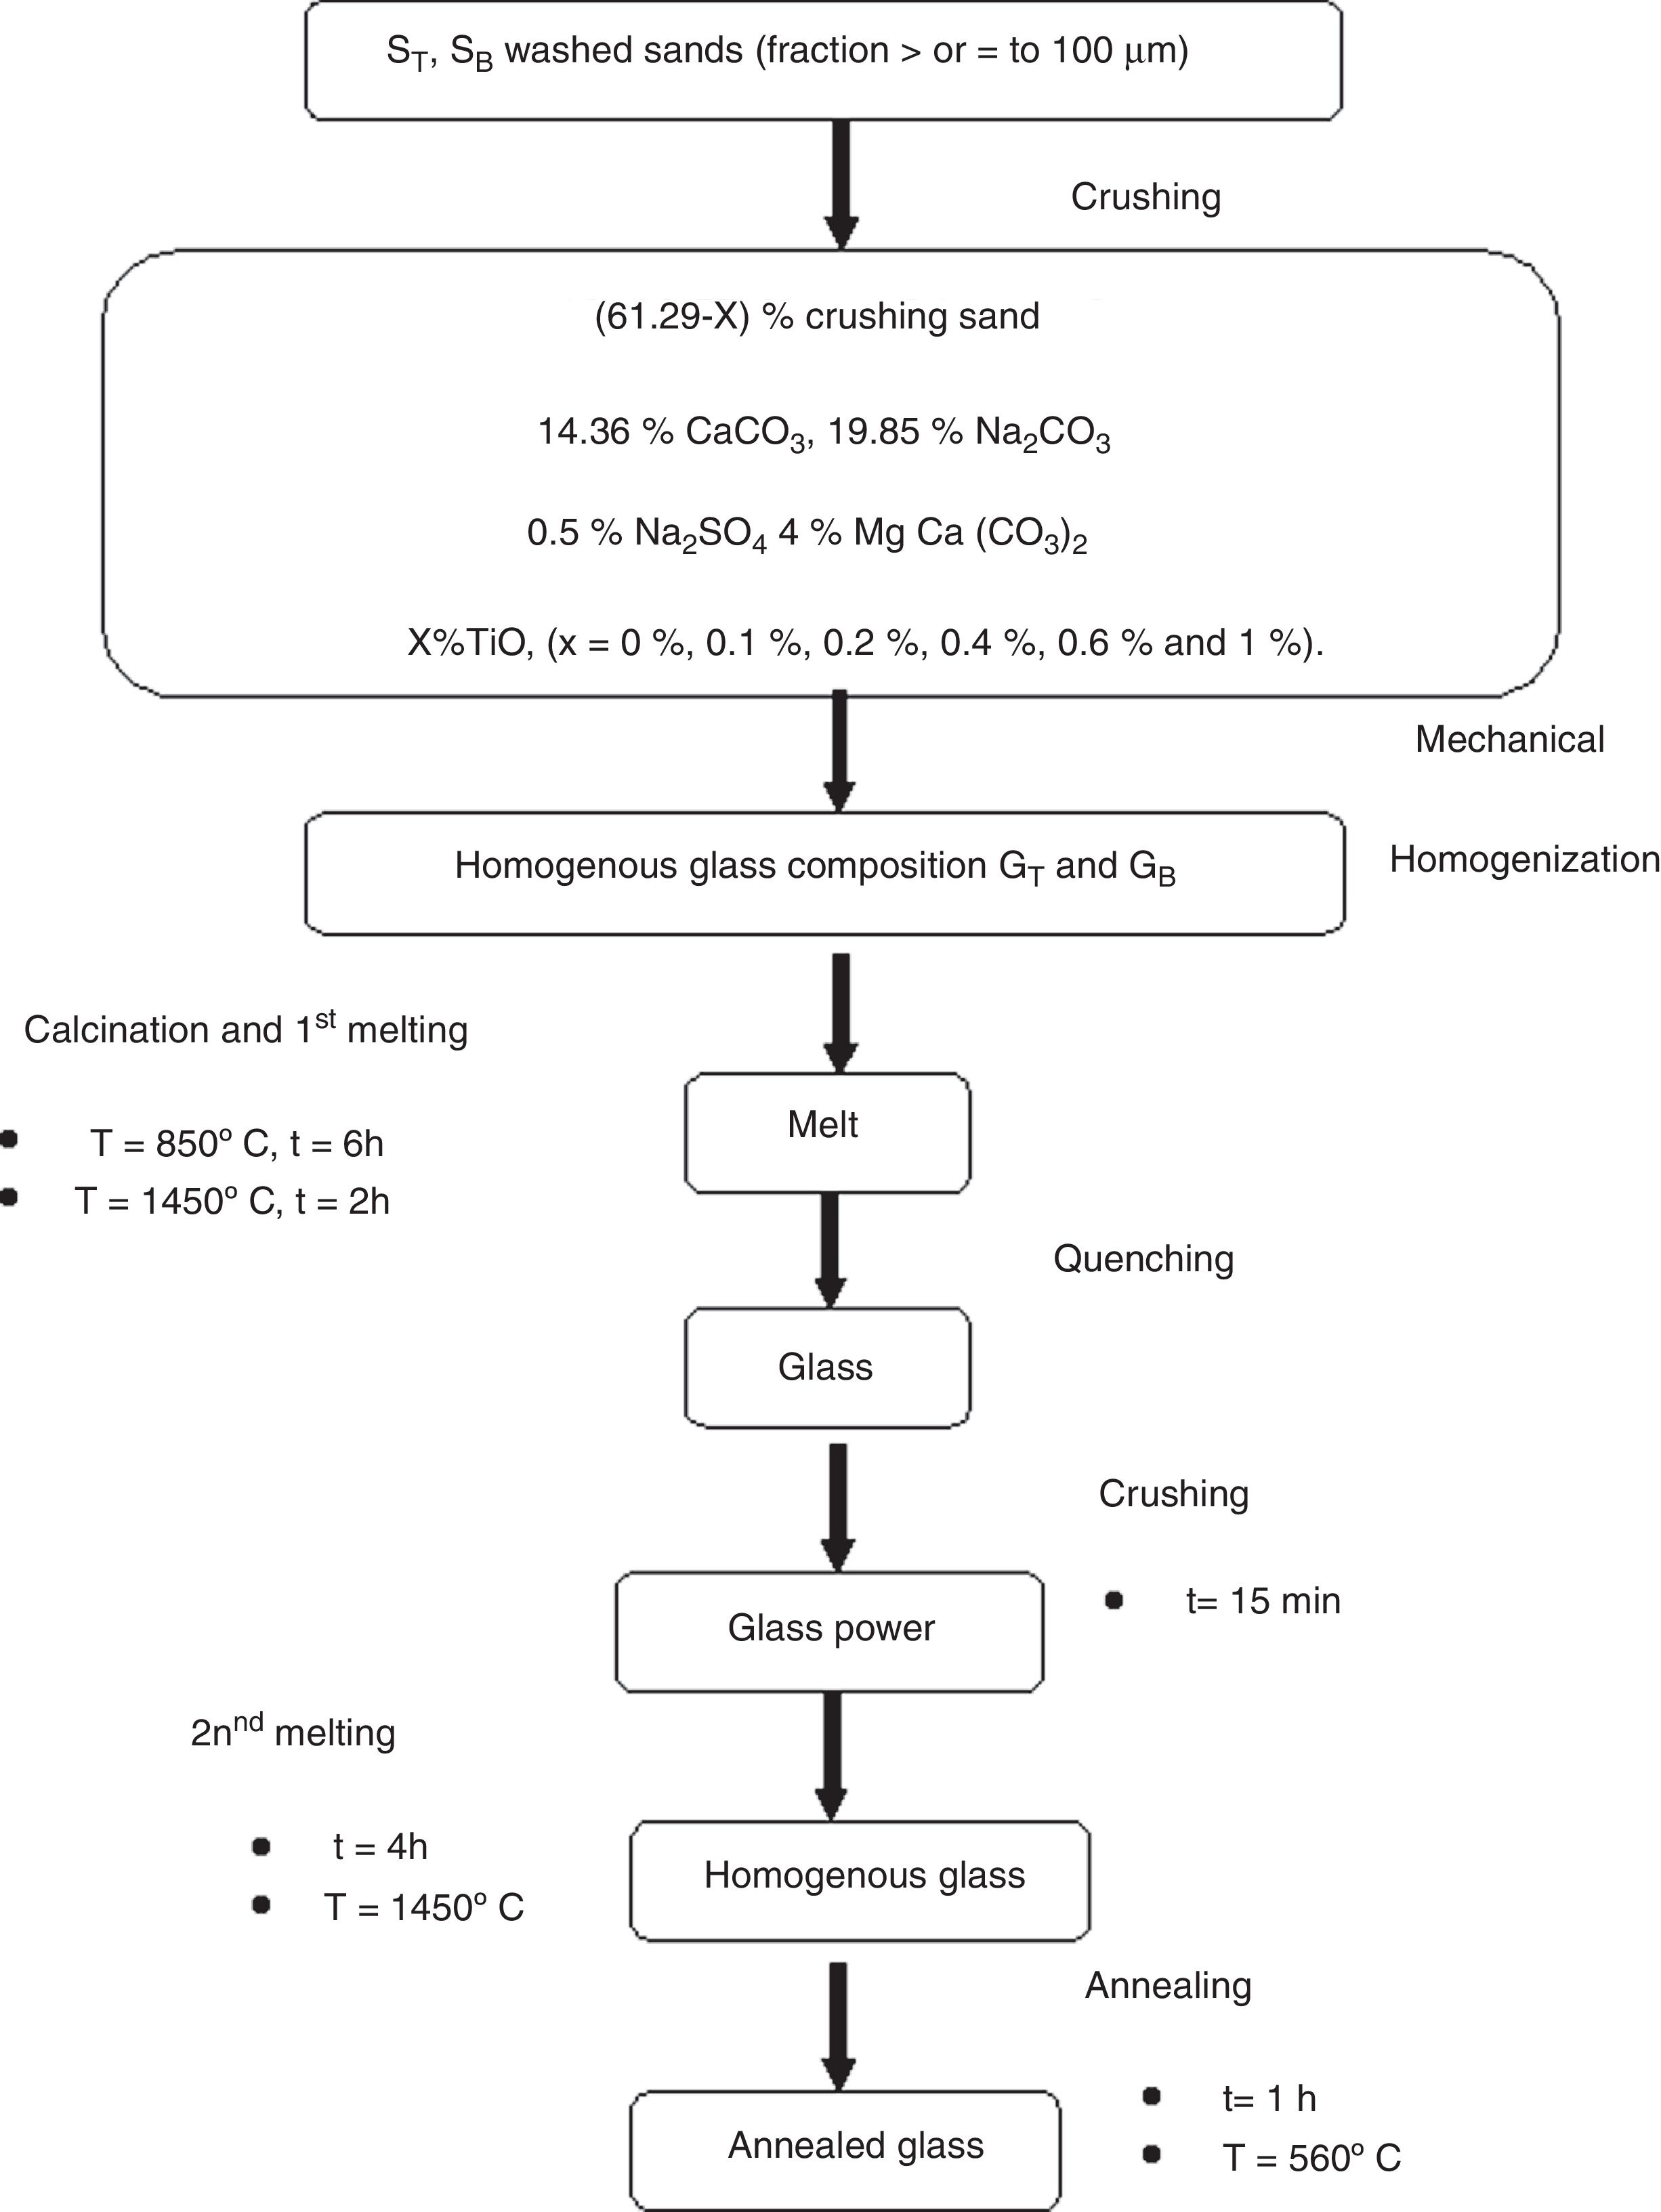
Glasses ElaborationThe basic glass compositions are summarized in Table 1. A homogenized mixture of 40g of raw materials: sand, dolomite and chemical reagents (Na2CO3, CaCO3 and Na2SO4 from Cheminova International, Spain with a chemical purity of 99wt%) is placed in a platinum crucible in an electric furnace for a calcination step at 850°C for 6h, followed by a first melting step for 2h at 1450°C. The glass obtained by quenching is ground to increase homogeneity. This stage is followed by a second melting step at 1450°C for 4h, followed by annealing at 560°C for a period of one hour. The samples are cut into test tubes, polishing (P400, P600, P1200, P2500, P40000 and with diamond paste) and grinding until obtaining a powder with a particle size ≤ 0.63mm. The experimental procedure of the obtained materials is presented in Fig. 1.

With the aim to improving the color and chemical durability of SB glasses, several glasses were elaborated based on TiO2 addition. They are elaborated using the same procedure: two melting steps and in the same conditions of temperature and time (Table 1 and Fig. 1).
Characterization of the raw materials and the elaborated glassesThe mineralogical compositions of the two sands were determined used an X-ray PANalytical X’ Pert PRO diffractometer (Cu Kα, λ=1.540598Å, 2θ range 0–80°, 0.025 2θ step). The collected data are processed by PANalytical X’ Pert Highscore software.
The Thermo gravimetric and Differential Thermal sand analyses were carried out using a NETZSCH STA 409C/CD thermo balance allowing the two analyzes to be coupled during the same thermal cycle. The TGA/DTA curves are obtained using a rate of 10°C/min from room temperature to 1000°C. The samples, about 300mg, are placed in alumina crucible under argon atmosphere.
The SB Sand particle size distribution was realized using a MASTERSIZER 2000 Laser granulometer.
The chemical composition of SB, ST Sands and dolomite (Table 2) were carried out by X-ray fluorescence (PANalytical Perl’X 3). The samples were prepared in the pellets from 8g of crushed sand with 4.5ml of a compacted Elvacite resin.
Chemical composition of raw materials.
| Sand | Oxides | SiO2 | Al2O3 | CaO | Fe2O3 | MgO | Na2O | K2O | TiO2 | L.O.I |
|---|---|---|---|---|---|---|---|---|---|---|
| SB | wt% | 95.21±0.01 | 0.97±0.03 | 1.32±0.02 | 0.23±0.02 | 0.01±0.03 | 0.27±0.02 | 0.40±0.04 | 0.01±0.004 | 1.52±0.01 |
| ST | wt% | 98.20±0.01 | 0.88±0.03 | 0.20±0.02 | 0.12±0.02 | 0.05±0.03 | 0.05±0.02 | 0.34±0.04 | 0.07±0.004 | 0.09±0.01 |
| D | wt% | 0.48±0.01 | 0.36±0.02 | 30.77±0.01 | 0.06±0.02 | 21.00±0.03 | n.d | n.d | n.d | 47.42±0.01 |
L.O.I: Loss On Ignition, n.d: not determined.
The grain morphologies of ST and SB sands and the elaborated glasses are determined by means of a Scanning Electron Microscope ME03, SEM: Merlin, Zeiss, Cist. It allows maximum resolution of the secondary electron (SE) image from 0.8nm at 15 KV, from 1.4nm at 1kV and from 2.4nm at 0.2kV. It also allows backscattered electron (BSE) imaging. The range of potential acceleration is between 0.02V and 30kV. SEM is coupled to the Energy Dispersive X-ray Spectroscopy (EDX) which provides information on the chemical compositions of sands and elaborate glasses.
The chemical composition of the glasses is determined by Electron Probe Micro-Analyzer (EPMA, CAMPARIS, Paris, France) with a CAMECA SX-Five apparatus equipped with five Wavelength- Dispersive X-ray Spectrometers (WDSs), driven by the Peak Sight software under Windows environment. Analyses are made with 15kV accelerating voltage and a 10nA sample current a 4μm spot size. The standards for calibration were albite for Na, diopside for Mg, Si and Ca, Orthoclase for Al and K, MnTiO3 for Ti, Cr2O3 for Cr, Fe2O3 for Fe and Cu for Cu. 20 points were taken and obtained compositions were averaged. Glasses Composition of glasses was homogeneous according EPMA. The samples were immobilized in an MECA PREX acrylic resin. The shots containing the glasses are then polished, cleaned and metalized.
The optical absorption spectra of the obtained glasses were realized with a double beam Perkin-Elmer 1050 spectrometer, in transmission mode. It scans a range of wavelengths between 300 and 4000nm. The samples were previously polished with diamond paste. The optical absorption spectra were normalized by the samples thickness.
The color measurements of the samples were carried out by an X-Rite spectrometer, model 962 S/N 000967 (USA), X-Rite ink formulation software Pinter Pro 5.11 operating with D65 light source, camera viewing angle 10°. The measurements were repeated three times for each composition and an average value was taken. The samples thickness was 2mm.
Knoop hardness measurements were carried out using a Zwick/Roel (ZHV) micro hardness tester. The load used in the hardness tests was 0.2 KP (1.9613N) and the dwell time of the indenter in contact with the sample was 20s.
Chemical resistance to acids and alkaline solutions of the samples were determined using chemical durability tests [21]. The samples are immersed in beakers filled with 1N HCl or 1N NaOH sample and then boiled for 6h for HCl and 3h for NaOH. The glasses are then washed with distilled water and dried at 105°C for 24h and their losses in weight are calculated. The glasses were also subjected to HF attack. A drop of HF (10N) is disposed on the glasses surface for 10min. The glasses were washed, with distilled water and then dried at 105° C during 24h. The losses in weight of the samples were determined [22].
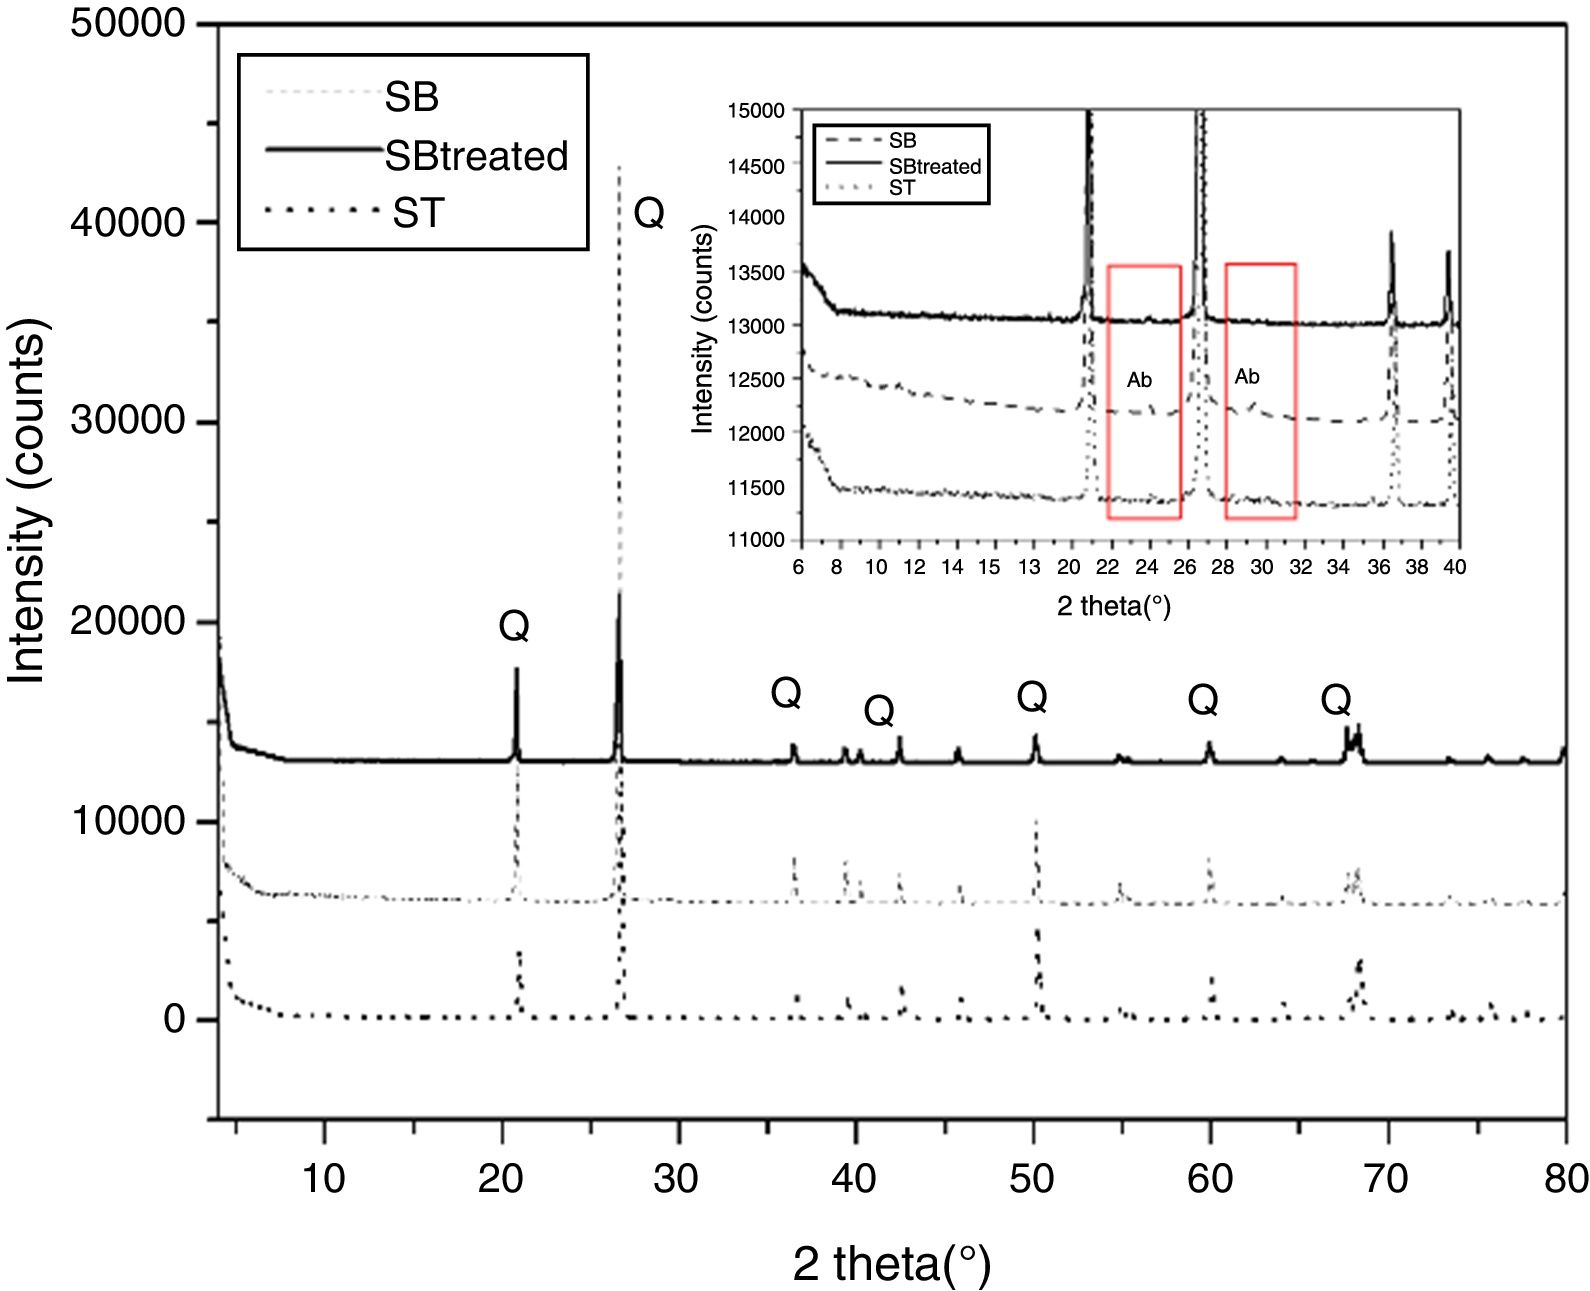
Results and discussionCharacterization of sandMineralogical analysisMineralogical analysis using X-ray diffraction of SB sand shows presence of quartz. Albite is also determined in the X-ray diffraction pattern (Fig. 2).
TGA/TDA.")
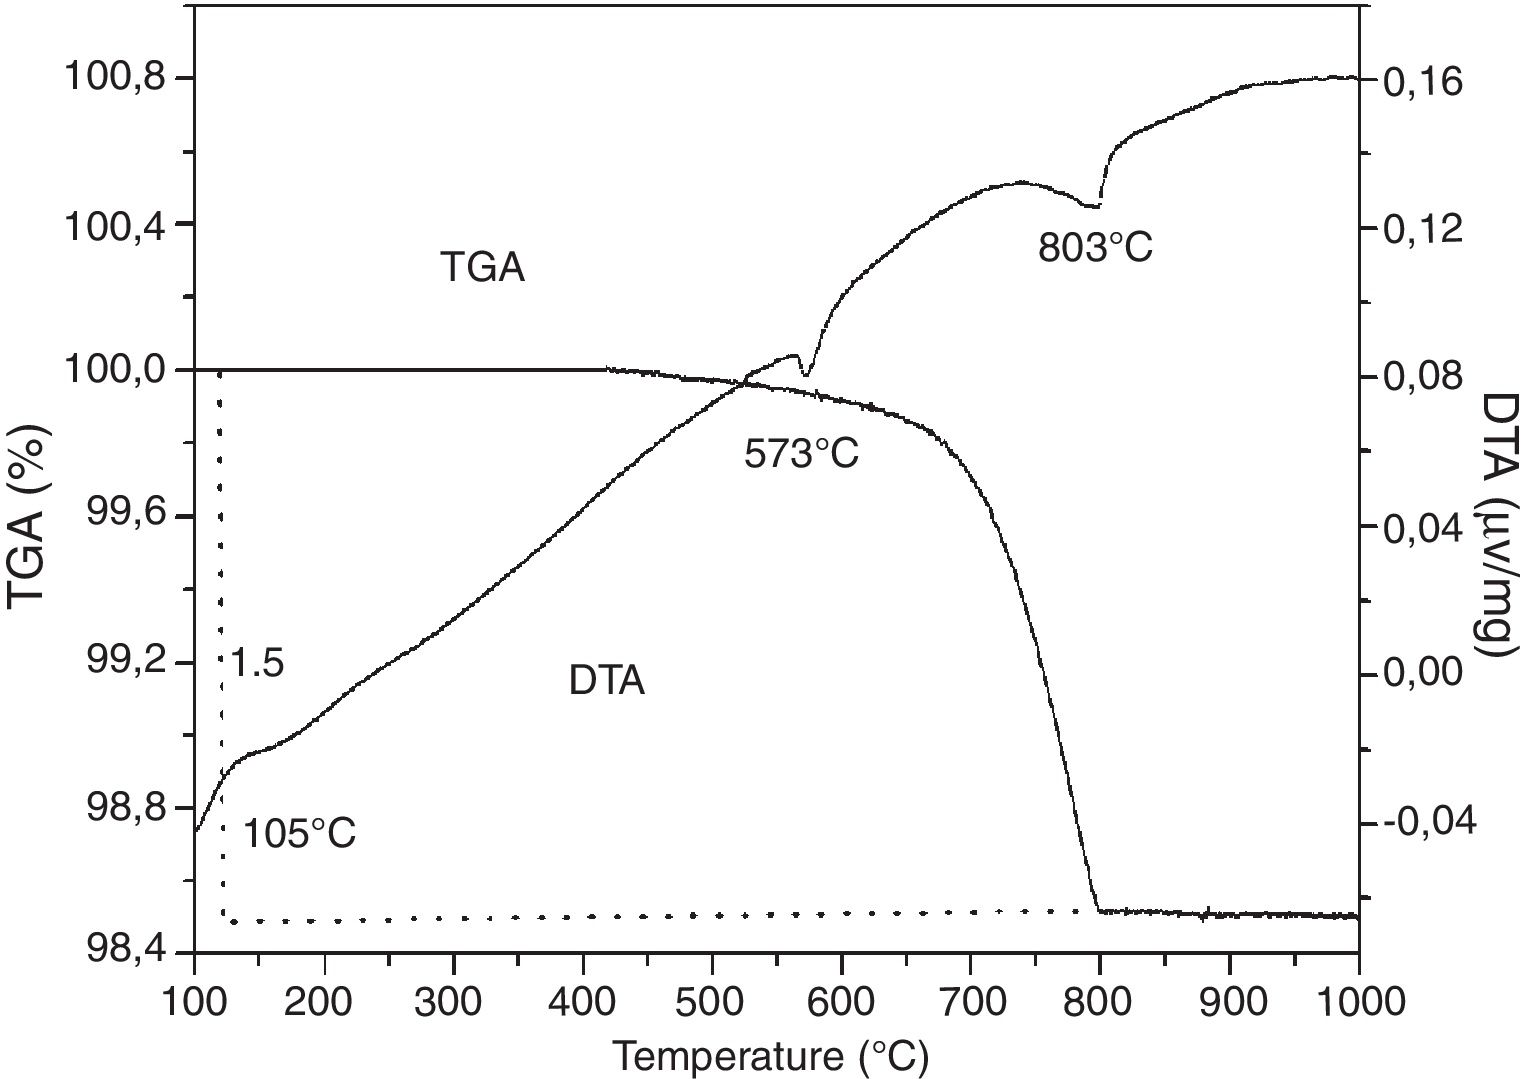
According to the TGA/DTA thermogram of SB sand (Fig. 3), three endothermic peaks are observed. The first peak at 105°C corresponds to dehydration or release of free water. The second peak at 573°C corresponds to the polymorphic thermal transformation of quartz (quartz α to quartz β). A third peak at 803°C corresponds to the decarbonation of calcite. Moreover, a large mass loss (1.5%) is noticed on the TGA diagram which corresponds to the decarbonation and the loss of CO2.
Particle size distribution analysis
Sand with very fine grains is more likely to contain iron oxide and refractory minerals, while a large particle size causes fused inclusions in the final products, a phenomenon resulting from the slower melting of coarse grains in comparison with the finest [8]. Hence, the granulometric content of sands is a major requirement for glass manufacturers.
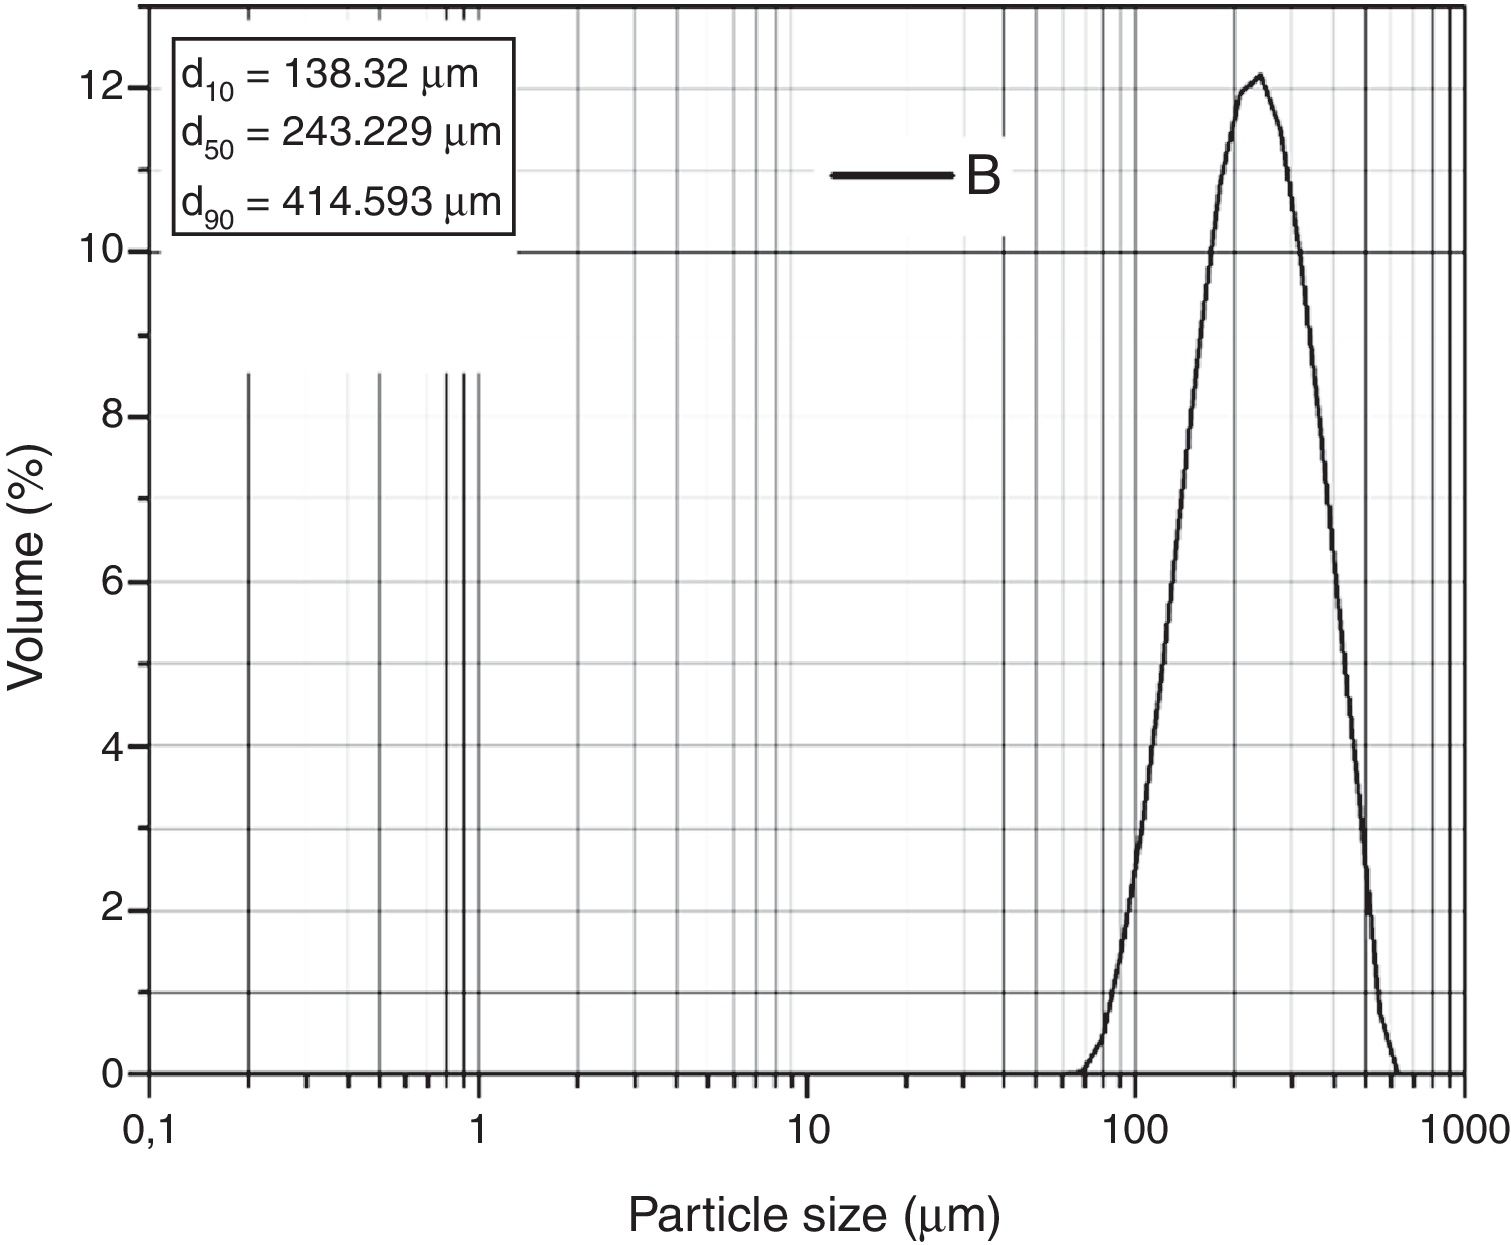
The laser granulometric analysis carried out by Coulter (Fig. 4) reveals that grains are formed by populations composed of 40 and 1000μm sizes. It is also noticed that 50% of the grains in the sand are 243μm in size. The particle sand size is fine but SB sand meets the requirements of the glass industry (0.1–0.5mm) [23]. Nevertheless, washing and sieving are necessary for the removal of the clay fraction.
Chemical composition
SB is mainly composed of 95wt% of SiO2 (Table 2), Fe2O3 is present in a small amount (0.23wt%), besides Al2O3 and TiO2 (Table 2). In another hand, SB contains clay fractions since its loss on ignition is 1.59%. These results are in concordance with the mineralogical and TGA/DTA analysis. In comparison with the chemical composition of ST, SB contains more of Fe2O3 and less of SiO2 and TiO2 oxides (Table 2). The few amount of Fe2O3 content of the dolomite is additionally noticed.
Characterization of the treated sandMineralogical analysisAccording to the X-ray diffraction patterns shown in Fig. 2, the samples of the two sands treated SB and ST have the same mineralogical composition, which consist of quartz. The disappearance of albite characteristic peak is also observed in the SB treated sand.
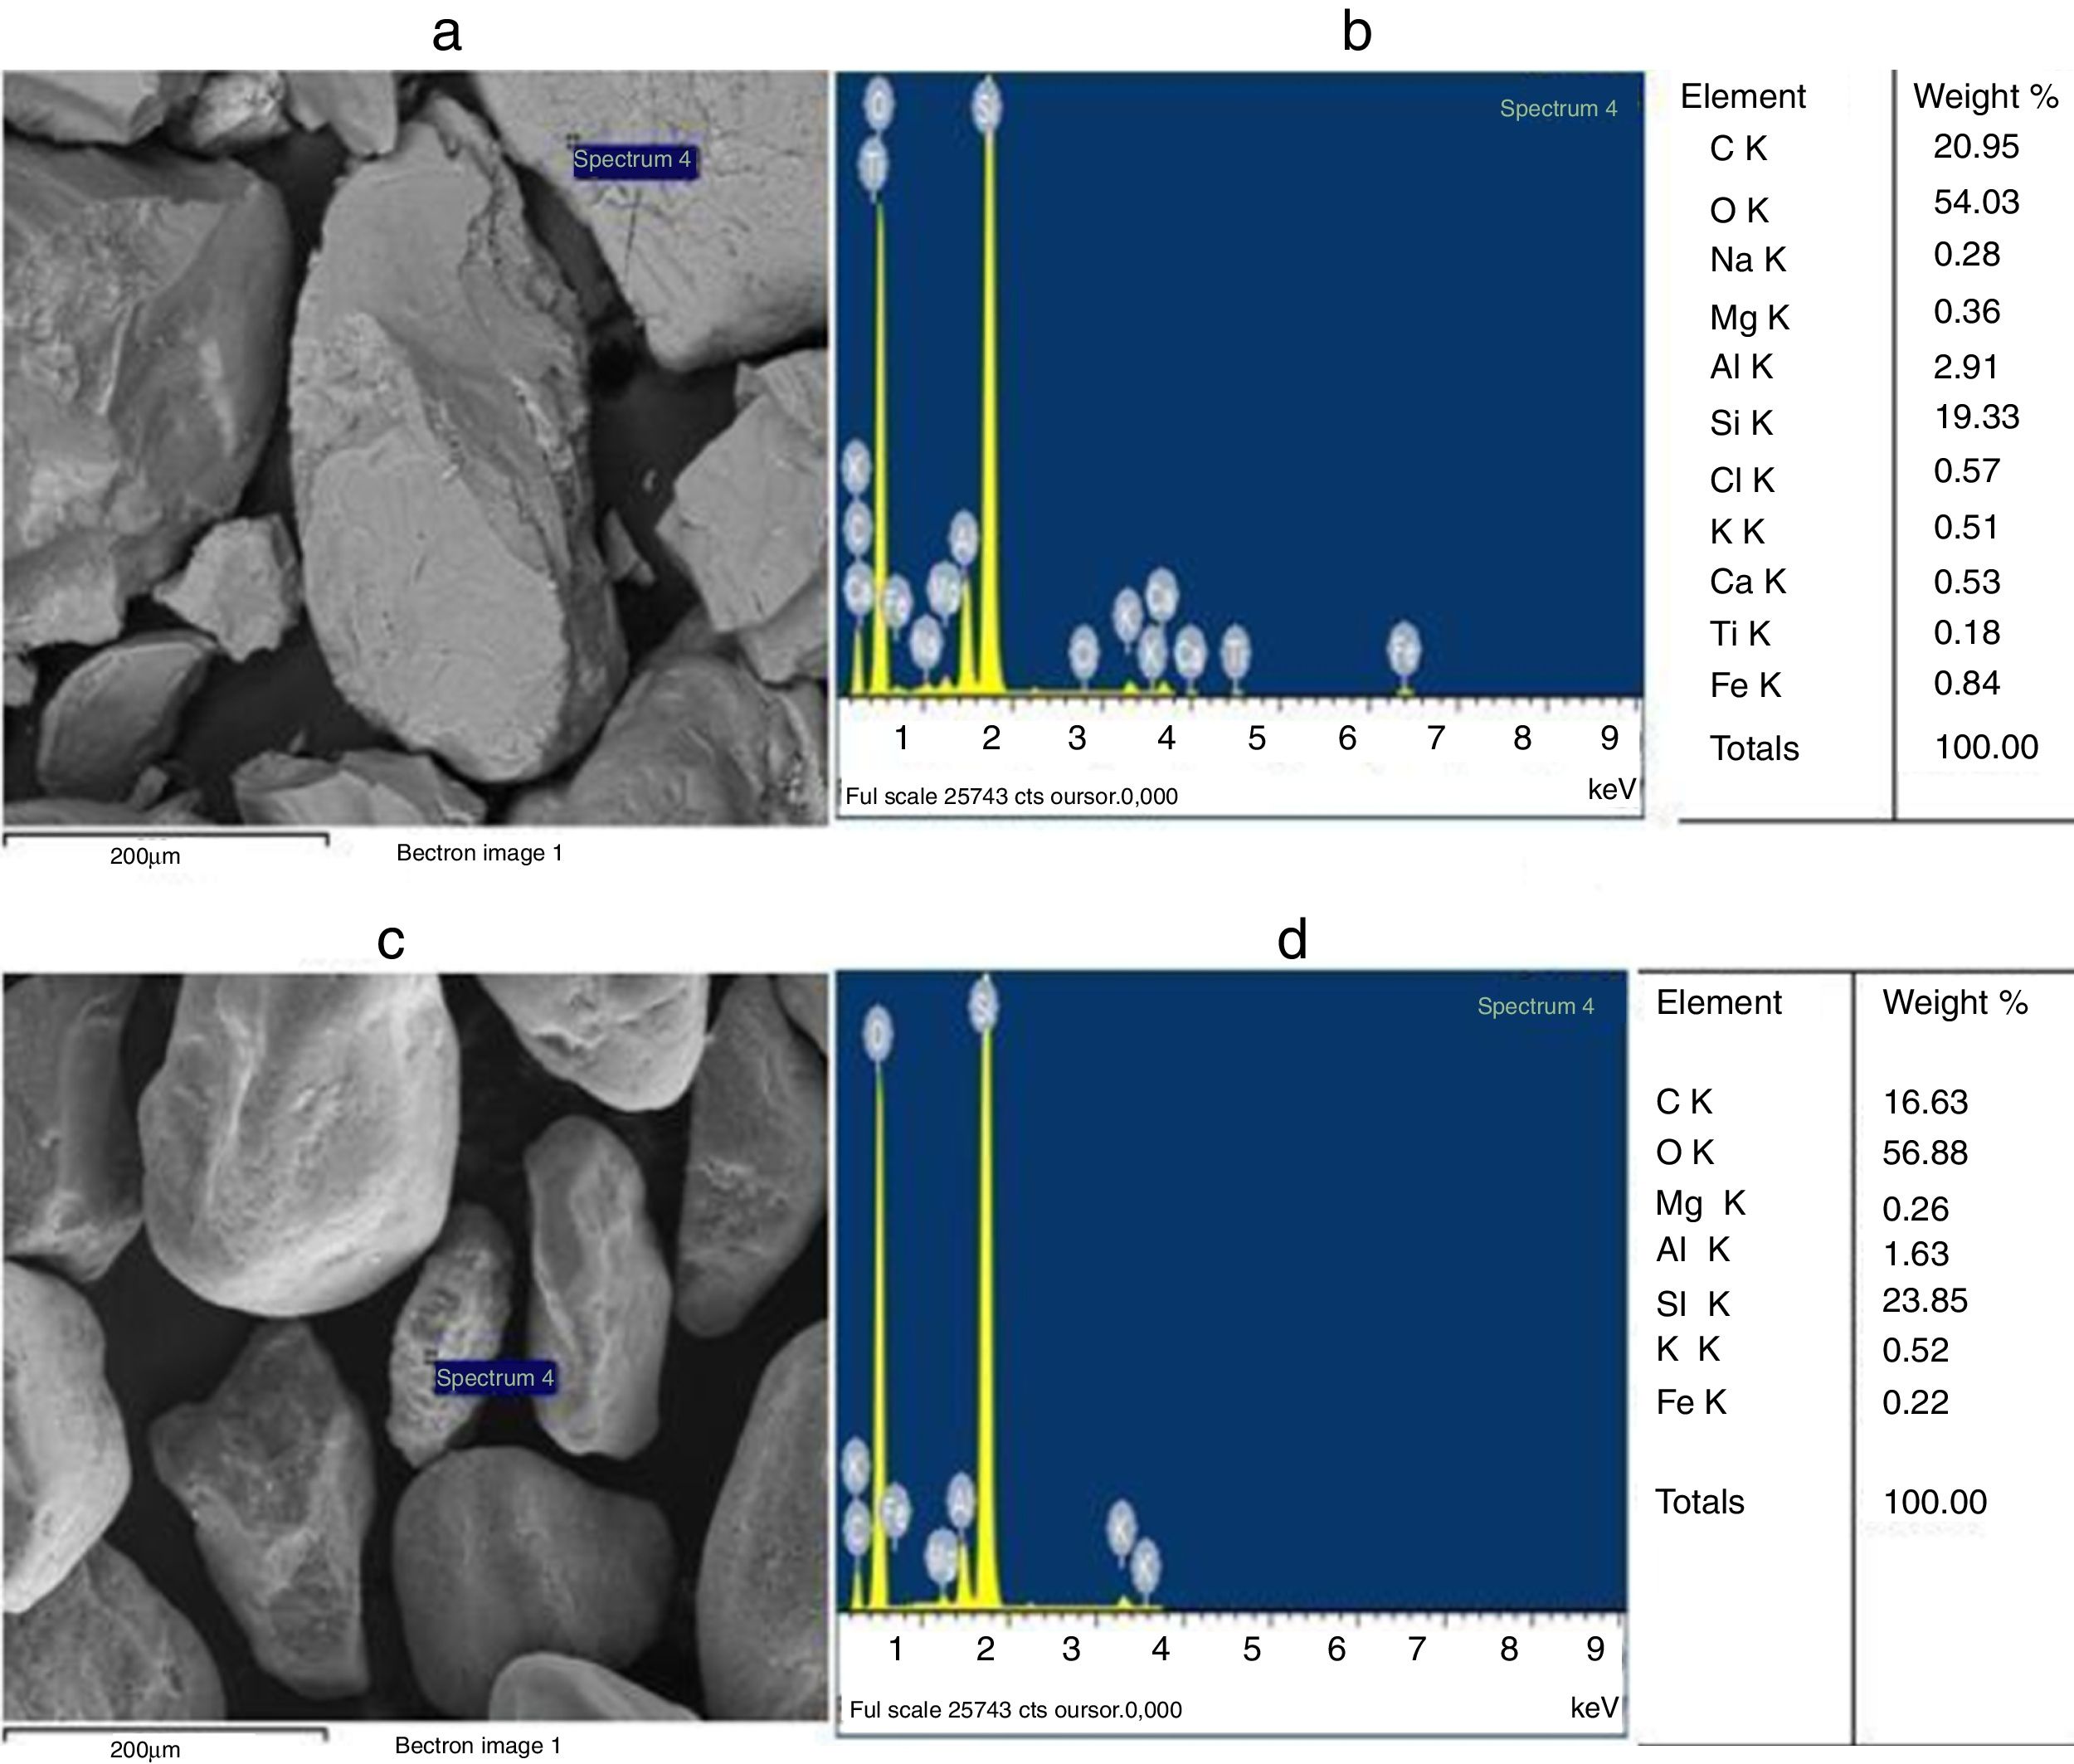
SEM and EDX analysisThe SEM micrographs shown in Fig. 5 reveal that the quartz grains of the ST Sand are ovoid in shape with marked surface asperities (i.e., roughness) indicating its belonging to fluvial origin. On the other hand, the quartz grains of SB sand have a spherical and rounder form which characterizes the dune aeolian grains sand [24,25]. The Energy Dispersive X-ray Spectroscopy (EDX) attached to the SEM supports the XRF results concerning the same chemical elements contained in the two sands (Table 2).
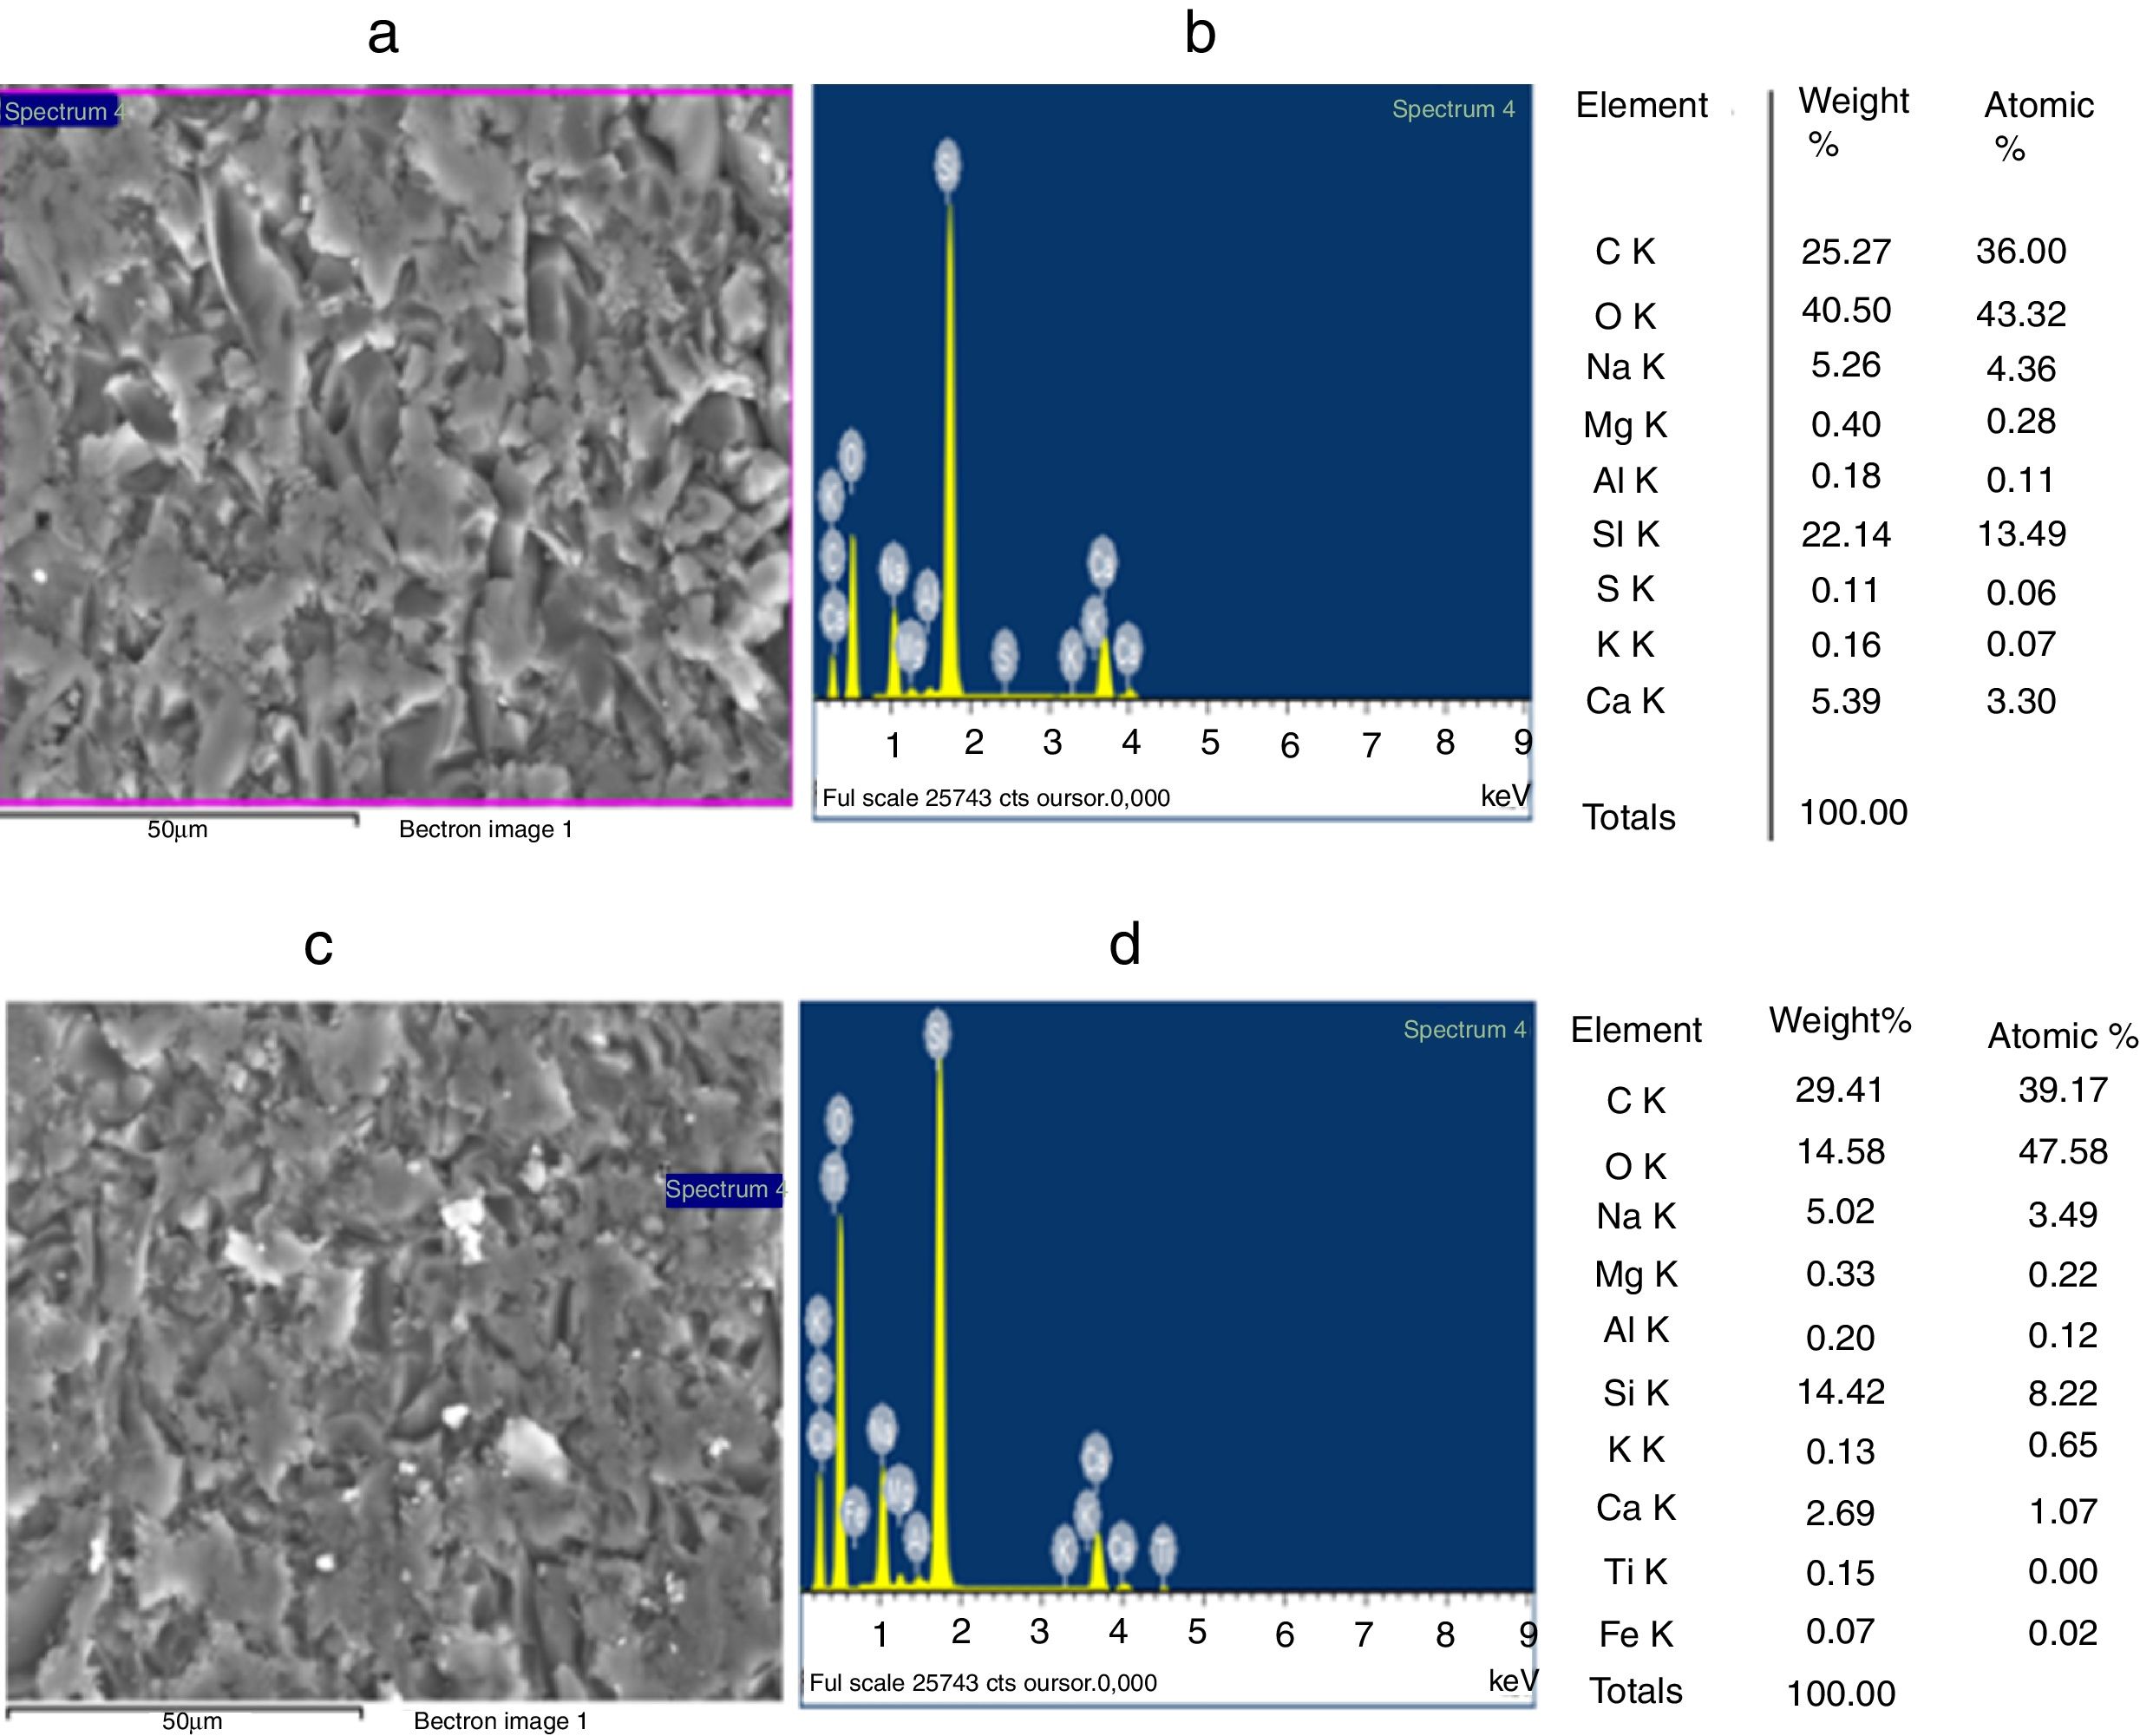
Characterization and properties of the elaborated glassesChemical composition SEM-SEI image of Tebessa sand particles, (b) EDX spectrum of Tebessa sand particle indicated in (a), (c) SEM-SEI image of Boussaâda sand particle, and (d) EDX spectrum of Boussaâda sand particle indicated in (c).")
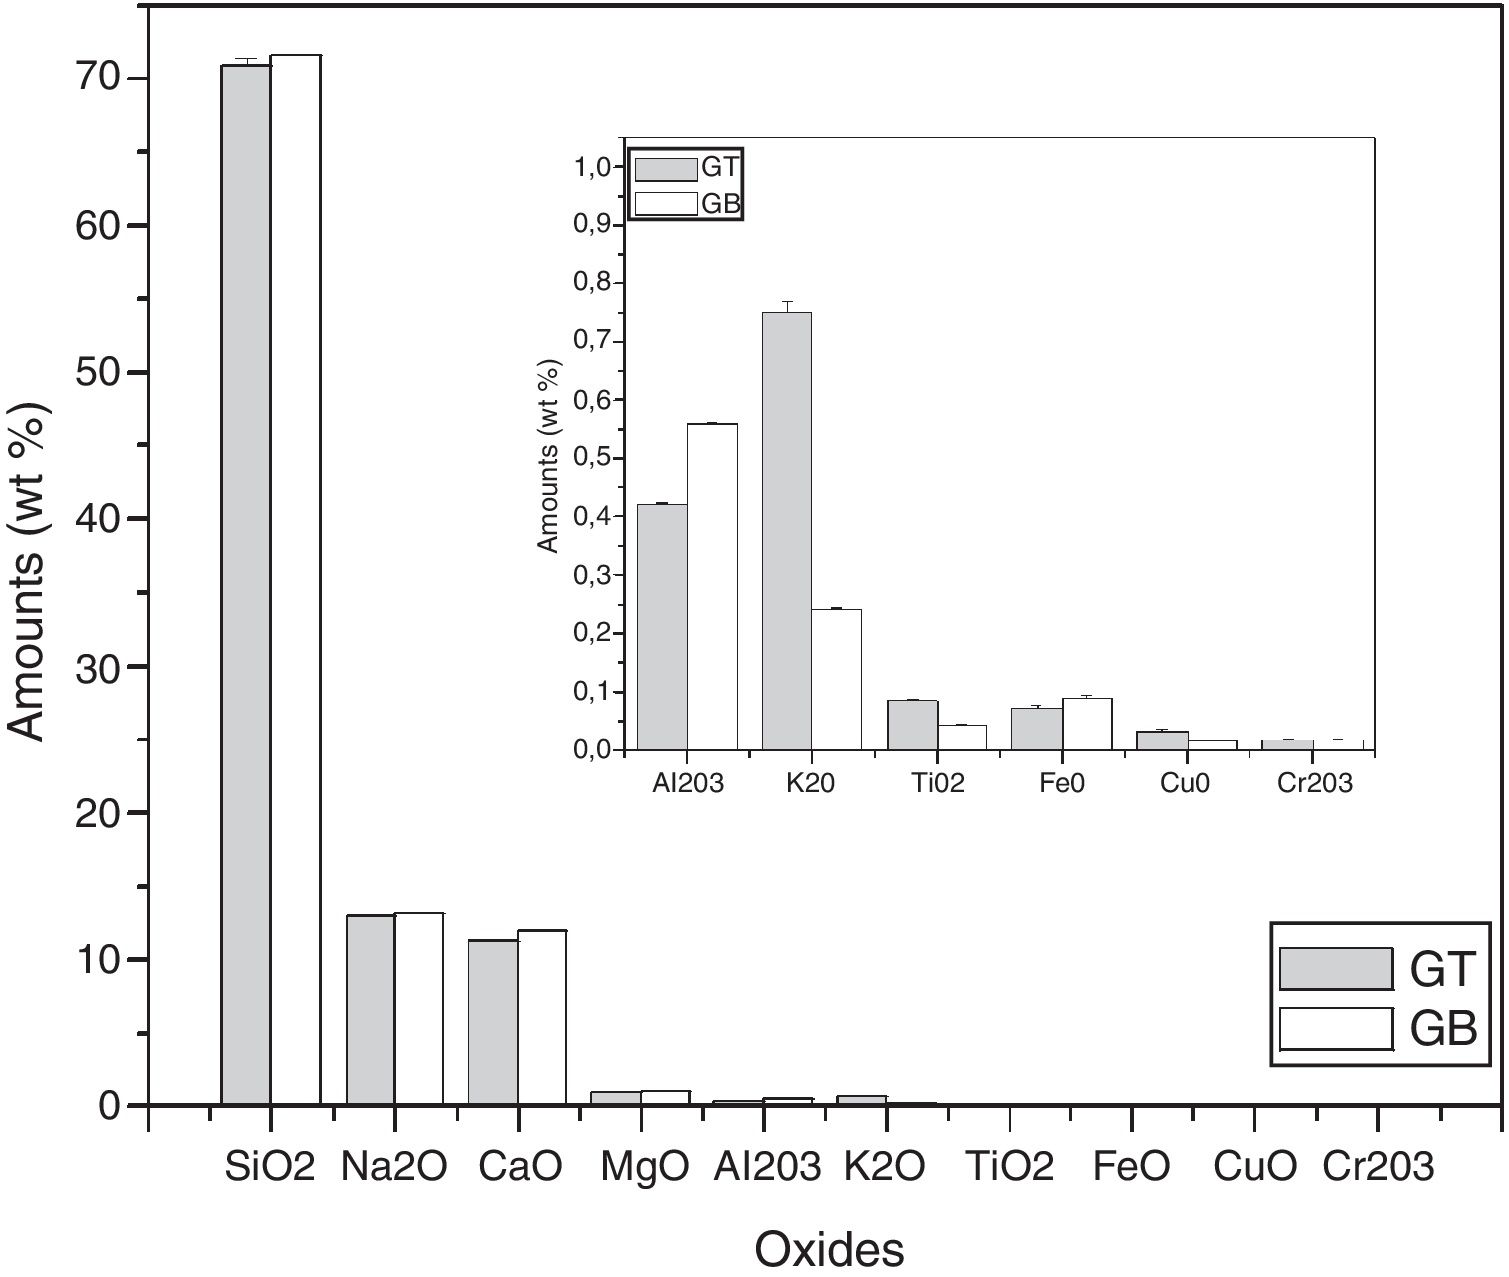
Chemical analysis by electron microprobe (Fig. 6) shows that GB glass presents the highest level of SiO2, Na2O, CaO, MgO, Al2O3 and Fe O, while GT glass contains the highest level of K2O and TiO2. The high SiO2 content in the GB sample as compared to GT is an indicator of the improvement in ST quality. This improvement results from the treatment that it has undergone (washes and granulometric selection).
UV-Visible –IR Spectroscopy
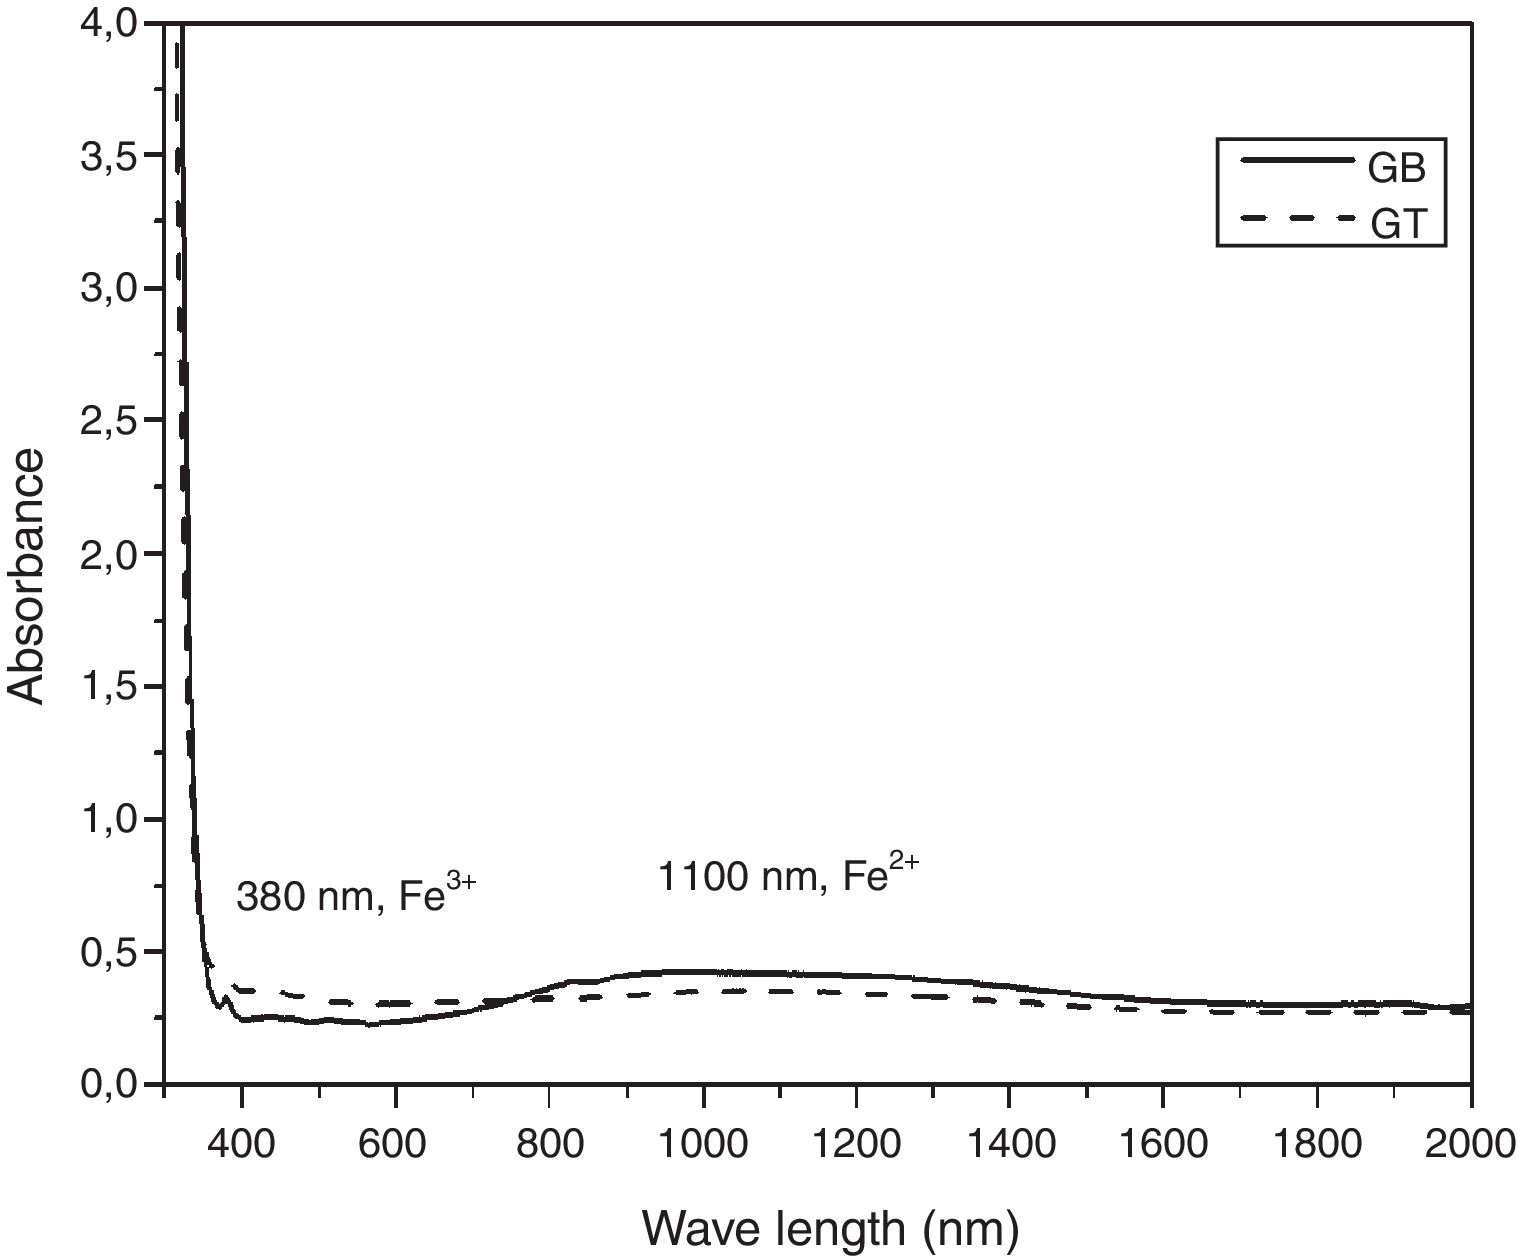
As is shown in Fig. 7, the samples exhibit ordinary absorbance values for glasses. The UV cut-off in the absorption spectra was shifted to a higher wavelength from 325nm to 350nm for GT and GB samples, respectively. In the visible range (400–800nm), GB has better transmission of light, compared with GT. The spectra of two glasses present a peak at 380nm characteristic of the Fe3+ ions charge transfer [11]. Beyond 800nm, GT has the best transmission. The appearance of a broad band centered at 1100nm characteristic of Fe2+ ions in the GB spectrum is also observed [11].
L*a*b* Color measures
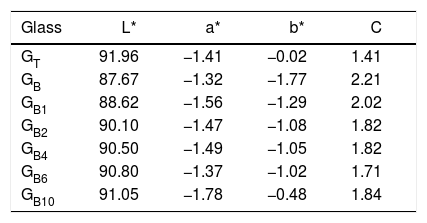
According to Table 3, it is noticed that GT is brighter and clearer than GB with L* values 91.96 and 87.67, respectively. GB is also the most chromatic glass with C=2.21. This is due to its higher contents of FeO and TiO2 than GT (0.09, 0.07wt% of Fe O and 0.07, 0.04wt% of TiO2 for GB and GT, respectively).
The negative value of a* parameter indicates a slight green color, which is mainly due to the presence of a mixture of Fe2+ and Fe3+ ions in the glass matrix. This value is negative as this mixture is high (case of GB comparatively with GT). However, the b* parameter is influenced by TiO2 and Fe2+/Fe3+ glasses amounts. The b* parameter of GT present a value close to the characteristic of slight yellowish color. This result is due to the high proportion of Fe3+ in GT glass than in GB glass, this is in agreement with UV-Visible spectroscopy analysis. On the other hand, GT contains more TiO2 than GB; this induces yellowish hue [26].
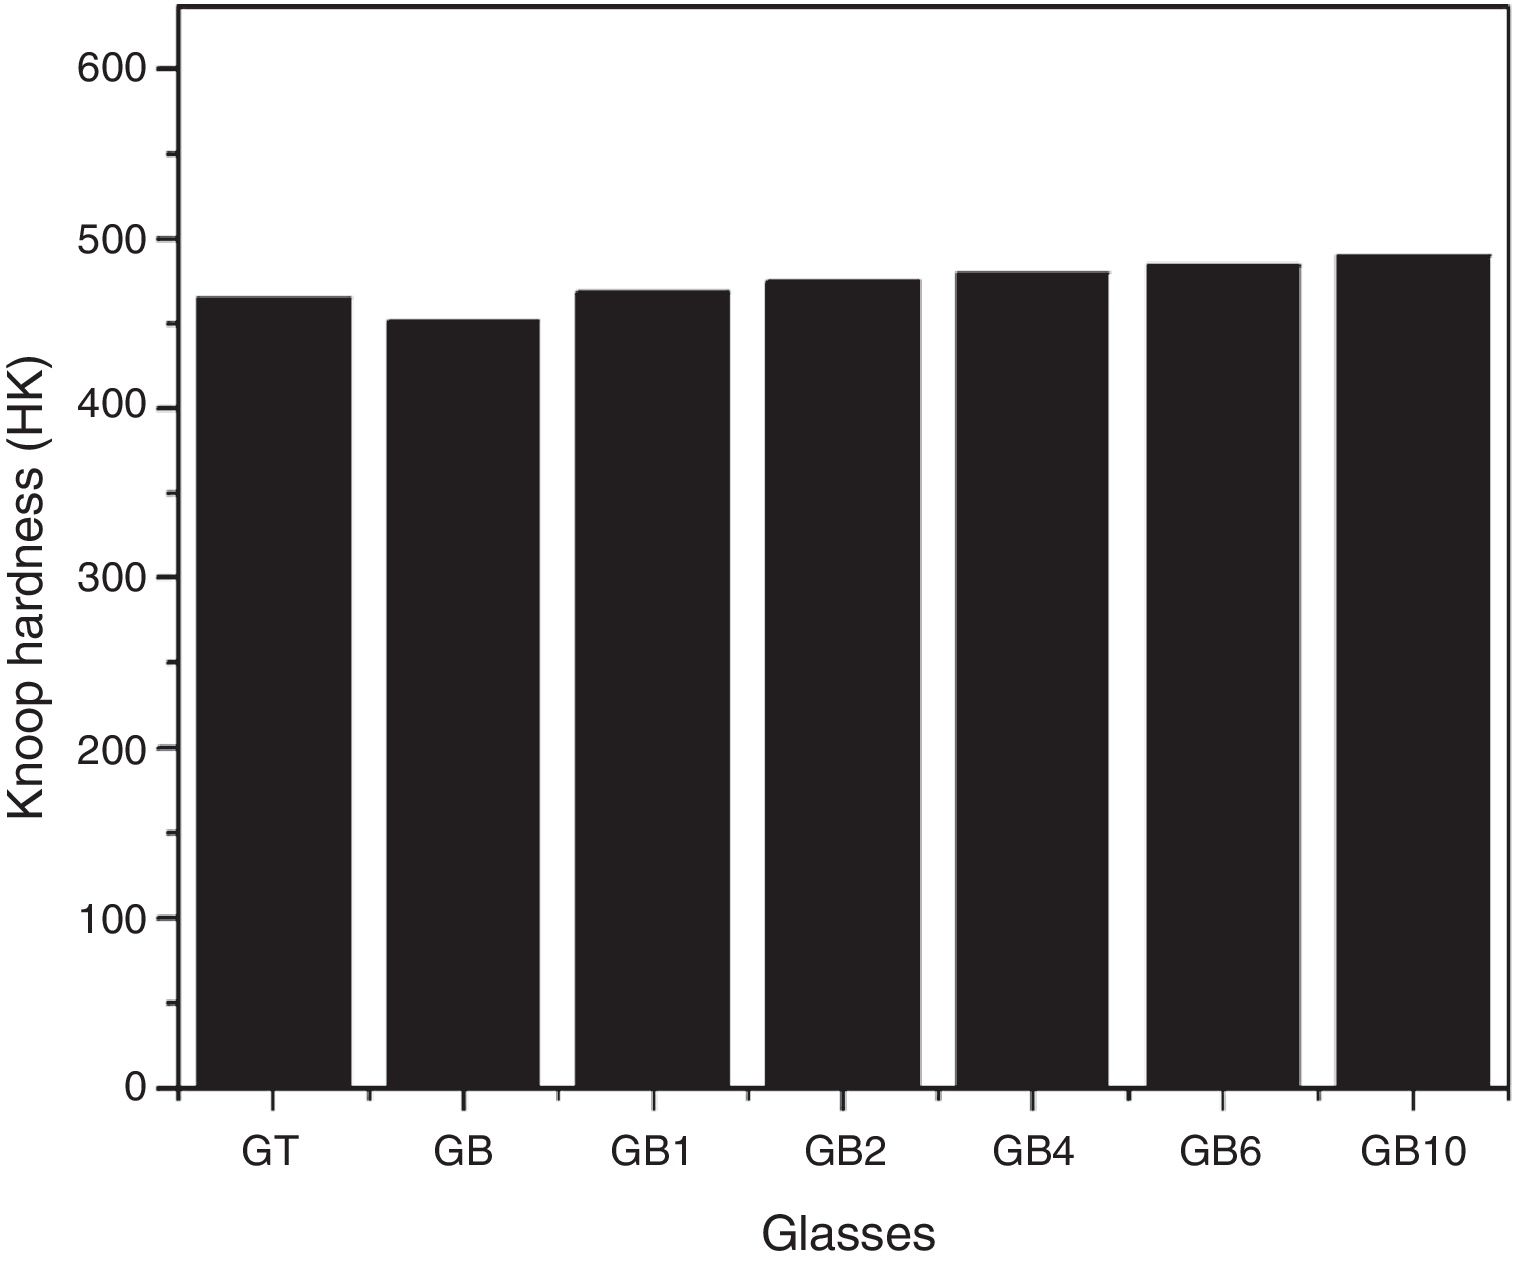
Knoop microhardnessAs shown in Fig. 8, the Knoop microhardness values of the samples GT and GB are 465 and 451 HK respectively. The indentation hardness depends on the chemical composition of the glass, according to Scholze [27], addition of alkalis decreases hardness in silicate glasses. In fact, the content of Na2O of GB and GT glasses are 13.24 and 13.03wt% respectively whereas K2O amounts are 0.24 and 0.75wt% respectively. The highest microhardness value of GT can be attributed to the highest amount of TiO2 present in this glass comparatively with GB glass (0.08wt% and 0.04wt% respectively) [10].
Improvement of the glasses propertiesSEM and EDX analysis
The SEM observations illustrated in Fig. 9, reveals that GB0 and GB2 present a vitreous matrix free of bubbles and inclusions. Without TiO2 addition, the glass exhibits a homogeneous morphology with a more or less compact vitreous network. In contrast, the glass resulted from 0.2wt% of TiO2 addition is more compact. The EDX Spectroscopy attached to the SEM report the presence of Ti and Fe in GB2 sample.
UV-Visible-IR Spectroscopy SEM-SEI image GB0 glass, (b) EDX spectrum of GB0 glass indicated in (a), (c) SEM-SEI image of GB2 glass and (d) EDX spectrum of GB2 glass indicated in (c).")
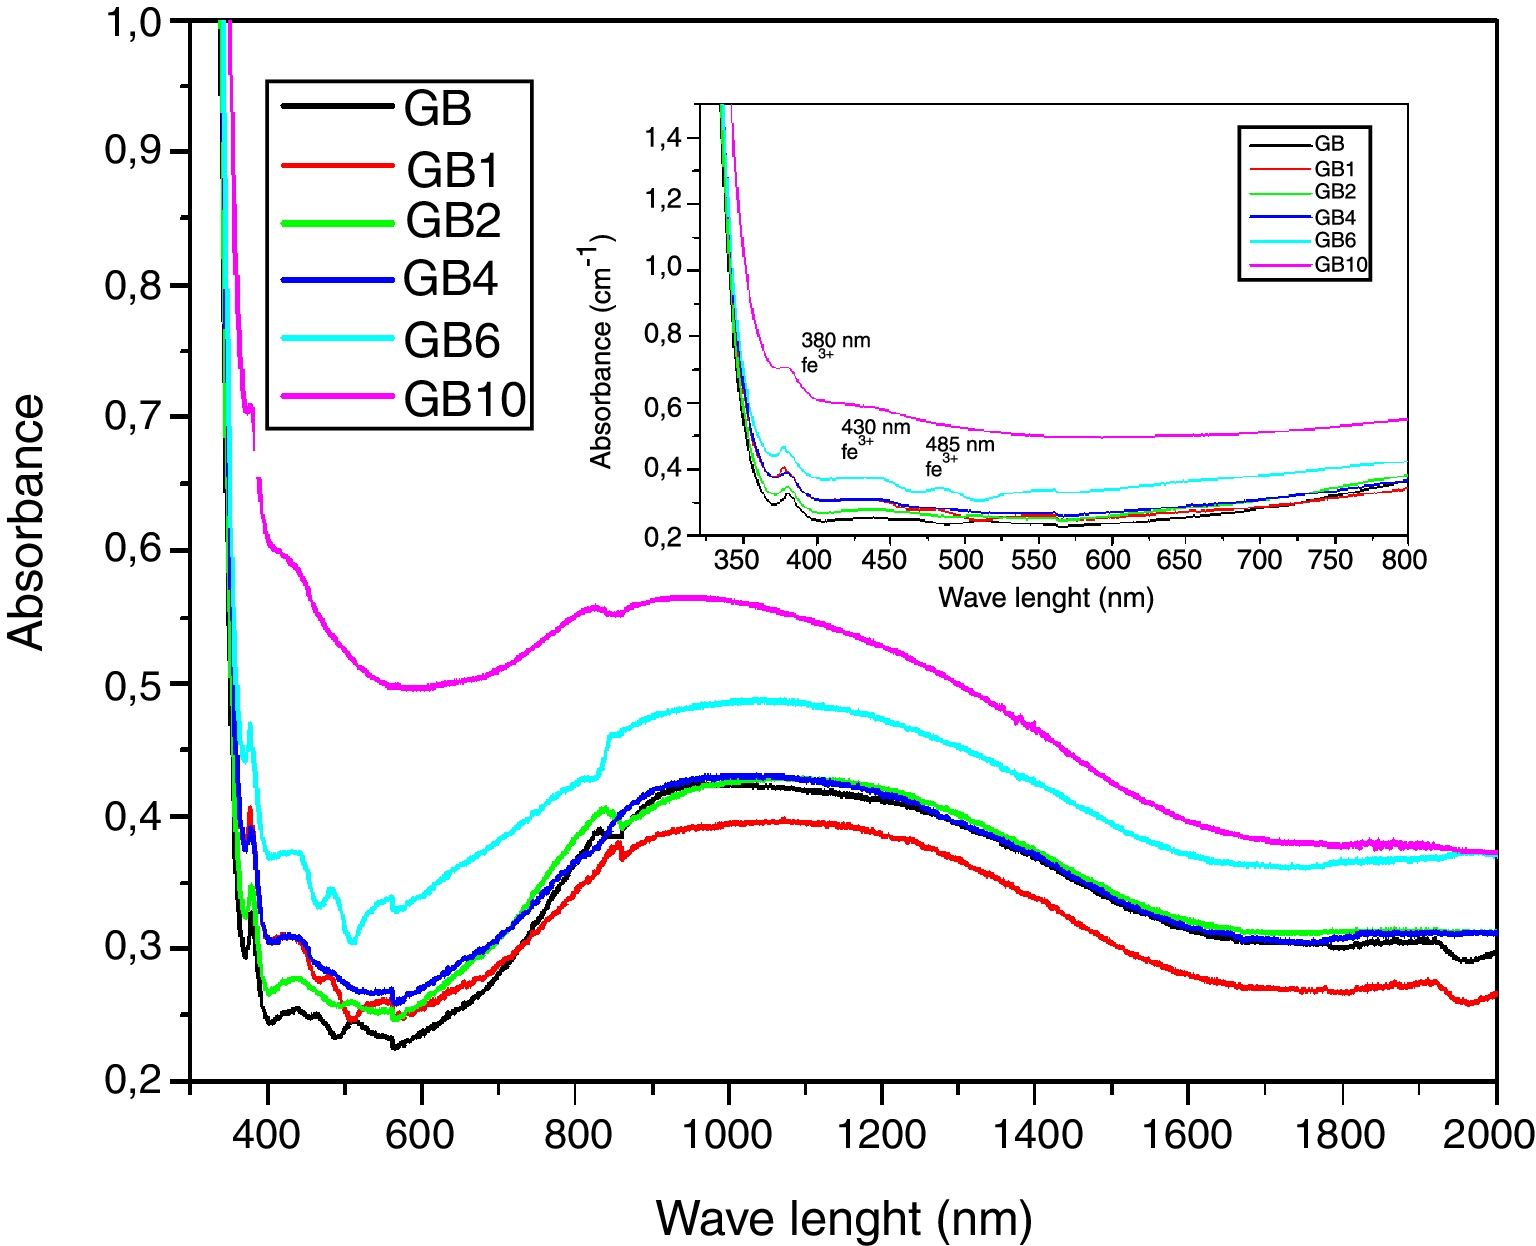
In general, the developed glasses absorption spectra in the UV-Visible near IR region (Fig. 10) have similar profiles. With the TiO2 additions, the UV cutoff in the absorption spectra, showing an infinite ultraviolet absorption and a zero emission, was shifted to a higher wavelength from 350nm to 370nm. Similar results were obtained by Kumar [28]. A decrease in light transmission by the doped glasses, in the visible range, was additionally noticed. TiO2 additions also influence the broad band around 1100nm characteristic of Fe2+ ions (Fig. 10) [11]. A decrease in intensity of this broad band in the GB1 spectrum was noticed. Indicating a decrease in the level of ferrous ions in the GB1 composition compared with the other glasses. Characteristic absorption bands of the Ti3+ ions at 480–510nm, 570 and 680nm are not detected. These results are expected as under ordinary melting conditions, and it is difficult to obtain reduced Ti3+ ions in soda-lime silicate glasses [29]. TiO2 addition also contributes to the increase in intensity of the peak at 380nm, characteristic of the Fe3+ ions charge transfer [11] and the peaks at 430 and 480nm, characteristic of the Fe3+ions. According to the studies of the iron-doped glasses by Rus et al. [30] and Kukkadapu et al. [31], Fe3+ ions present absorption bands in the range 325–450nm and 350–500nm, respectively.
L*a*b* Color properties
According to Table 3, the glass GB with no addition of TiO2 is the most chromatic glass (C *=2.21), by adding a small amount of TiO2 (0.1, 0.2, 0.4 and 0.6wt%), the chromaticity decreases to 1.71. Increasing the TiO2 content to 1wt%, the glass becomes more chromatic but still less than the GB glass. The addition of TiO2 increases the parameter b*, approaching the positive values characteristic of yellowish color. However, the values of the parameter a* are strongly influenced by the interference between Fe2+/Fe3+ and Ti3+/Ti4+[26]. Its negative values indicate a slight green color attributed to the mixture of Fe2+ and Fe3+ ions. The TiO2 addition brings an improvement in the glasses clarity represented by the L * parameter from 87.67 to 91.05 for GB and GB10, respectively.
Knoop micro hardnessAs shown in Fig. 10, TiO2 addition improves Knoop micro hardness of SB based glasses. An increase of ∼8.65wt% of Knoop micro hardness is noticed for GB10 (with 1wt% of TiO2) comparatively with GB. These results confirm the TiO2 effect as an oxide influencing this mechanical property found in the case of GB and GT glasses. TiO2 addition reinforces the glass network and produces an increase in the obtained glasses density [10], thus resulting in an increase in micro hardness for glasses containing TiO2.
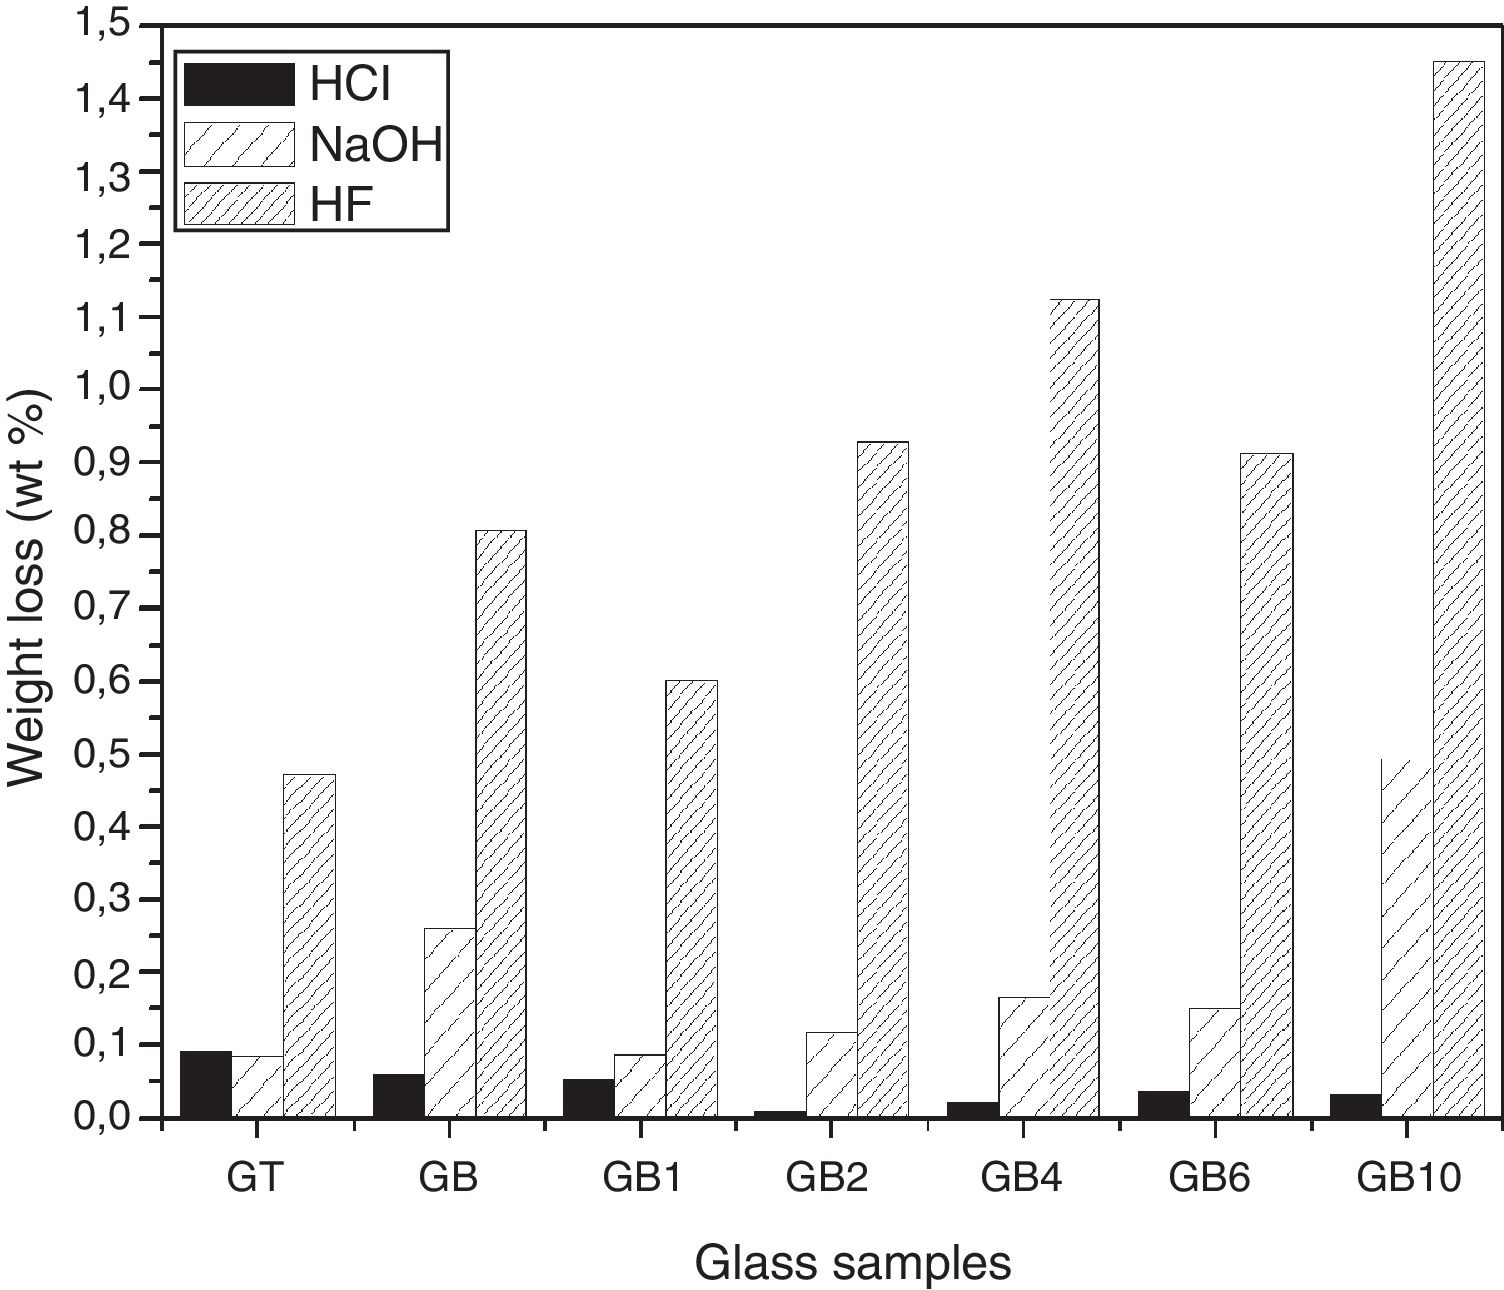
Chemical durability of the elaborated glassesHCl and NaOHThe chemical durability tests in HCl (1N) and NaOH (1N) solutions showed (Fig. 11) that the glass samples are more durable in acidic solution than alkali ones. Thus, in acidic solution, GB resists better, while it is more vulnerable in the presence of alkaline solution comparatively with GT.
 of the studied glasses by various solutions.")
The addition of TiO2 in GB glass improves its chemical durability with respect to the HCl acid by reinforcing the vitreous network. However, in NaOH solution, the improvement is also observed except in the case of GB10 composition (1wt% of TiO2). Similar observations have been reported by El-Batal et al. [32] for the GB1 sample. The exception related to GB10 composition is due to the fact that Si–O–Si bonds are influenced by the addition of 1wt% of TiO2. It makes their breakdown by the hydroxyl ions (OH−) contained in the alkaline solution easier. The incorporation of this TiO2 amount in the glass network may increase the substitution of Si4+ by the Ti4+ ion with its larger ionic radius than that of Si4+ (0.061 and 0.040nm, respectively) and thus increase the exchange engaged between the two ions [33].
Durability of the glasses in HFThe study of chemical durability in HF (10N) for the developed glasses (Fig. 11) revealed that the vitreous network of the GT sample is more resistant to attack than that of the GB sample. This is related to the higher silica content of GB compared to GT.
The SB sand glass compositions prepared with TiO2 addition are more attacked by HF than the basic composition without TiO2 addition. The variation of glass composition modifies the glass structure, leading to changes in the concentration of fragile bonds. An exception is noticed in the case of GB1 (with addition of 0.1wt% of TiO2) where an improvement in its durability is observed (with a mass loss of 0.602 compared to 0.807 and 0.472wt% for GB and GT, respectively).
ConclusionsThe physico-chemical characterization of the Boussaâda sand revealed the presence of a fraction with a particle size <100μm carrying the ferrous impurity, thus requiring prior treatment before its use in the glasses elaboration. After the physical treatments by several washes and a granulometric selection, the characterization of SB by X-ray diffraction revealed the disappearance of the clay fraction (albite and calcite).
The soda-lime glass produced from the Boussaâda sand is colorless, has an interesting light transmission that is better than the Tebessa sand glass and has a better chemical durability in acid solution (HCL solution (1N)).
TiO2 additions to SB-based glasses have enhanced the clarity and transparency from L *=87.67 to L *=91.05 and improved the Knoop microhardness from 451 HK to 490 HK for GB and GB10, respectively. This improvement is due to the fact that TiO2 affect on the Fe3+/Fe2+ ions equilibrium in the vitreous matrix.
The glass chemical durability to attack by acid (HCl) and alkaline (NaOH) solutions is enhanced by the addition of TiO2 amounts. However, the chemical resistance to attack by HF is enhanced only in the case of GB1 composition (with 0.1wt% TiO2).
The dune sand of Boussaâda is promising for its use as a raw material for the elaboration of glasses. Moreover, the addition of TiO2 improves its colorimetric and mechanical properties besides its chemical durability in acids (HCl, HF) and alkaline (NaOH) solutions.
