


Archaeological excavation of the Institute of Archaeology and Ethnology (Polish Academy of Sciences, PAN) at several Iron Age sites located in West Poland and South Germany has allowed the recovery of an important set of coloured glass beads mostly decorated (6th–4th centuries BC). The present paper summarises the results obtained through the chemical and microstructural characterisation of such beads. The research was carried out by binocular microscope observations, X-ray diffraction, scanning electron microscopy, energy dispersive X-ray spectrometry and visible spectrophotometry. The main objective was to attain information on the production technology and conservation state of these beads.
The results indicated that all them were produced with soda lime silicate glass, even though two groups can be separated: (i) beads containing high MgO percentages made from plant ashes as an alkaline source, and (ii) beads containing low MgO percentages made from natron as an alkaline source. As regards decorations, opaque white was obtained from tin oxide, turquoise blue from Cu2+-ions, and opaque yellow from lead antimonate.
Additionally, results showed microstructural and microcrystalline differences between some glass beads studied here and other glass beads from Mediterranean areas, dated in the same chronological period. This fact pointed out the valuable role given to these beads by Iron Age communities from Central Europe.
La excavación arqueológica realizada por el Instituto de Arqueología y Etnología de la Academia Polaca de Ciencias, en varios yacimientos de la Edad del Hierro situados en el oeste de Polonia y el sur de Alemania, ha permitido la recuperación de un importante conjunto de cuentas coloreadas de vidrio, la mayoría decoradas (siglosVI-IVa.C.). Este artículo recoge los resultados obtenidos tras la caracterización química y microestructural de dichas cuentas de vidrio. La investigación se llevó a cabo mediante observaciones de microscopía binocular, difracción de rayosX, microscopía electrónica de barrido, espectrometría de dispersión de energías de rayosX y espectrofotometría visible. El objetivo principal ha sido obtener información acerca de la tecnología de producción y del estado de conservación de estas cuentas de vidrio.
Los resultados indicaron que todas las cuentas se produjeron con vidrios de silicato sódico cálcico, aunque se pueden clasificar en 2 grupos: 1) cuentas que contienen porcentajes elevados de MgO, elaboradas a partir de cenizas de plantas como fuente de componentes alcalinos; y 2) cuentas que contienen porcentajes bajos de MgO, elaboradas con natrón como fuente de componentes alcalinos. En lo que se refiere a las decoraciones, el blanco opaco se obtuvo a partir de óxido de estaño, el azul turquesa con iones Cu2+, y el amarillo opaco con antimoniato de plomo.
Por otro lado, los resultados demostraron la existencia de diferencias microestructurales y microcristalinas entre algunas de las cuentas de vidrio estudiadas y otras cuentas procedentes del área mediterránea, fechadas en el mismo periodo cronológico. Este hecho señala el valioso papel que se confería a este tipo de cuentas de vidrio en las comunidades centroeuropeas de la Edad del Hierro.
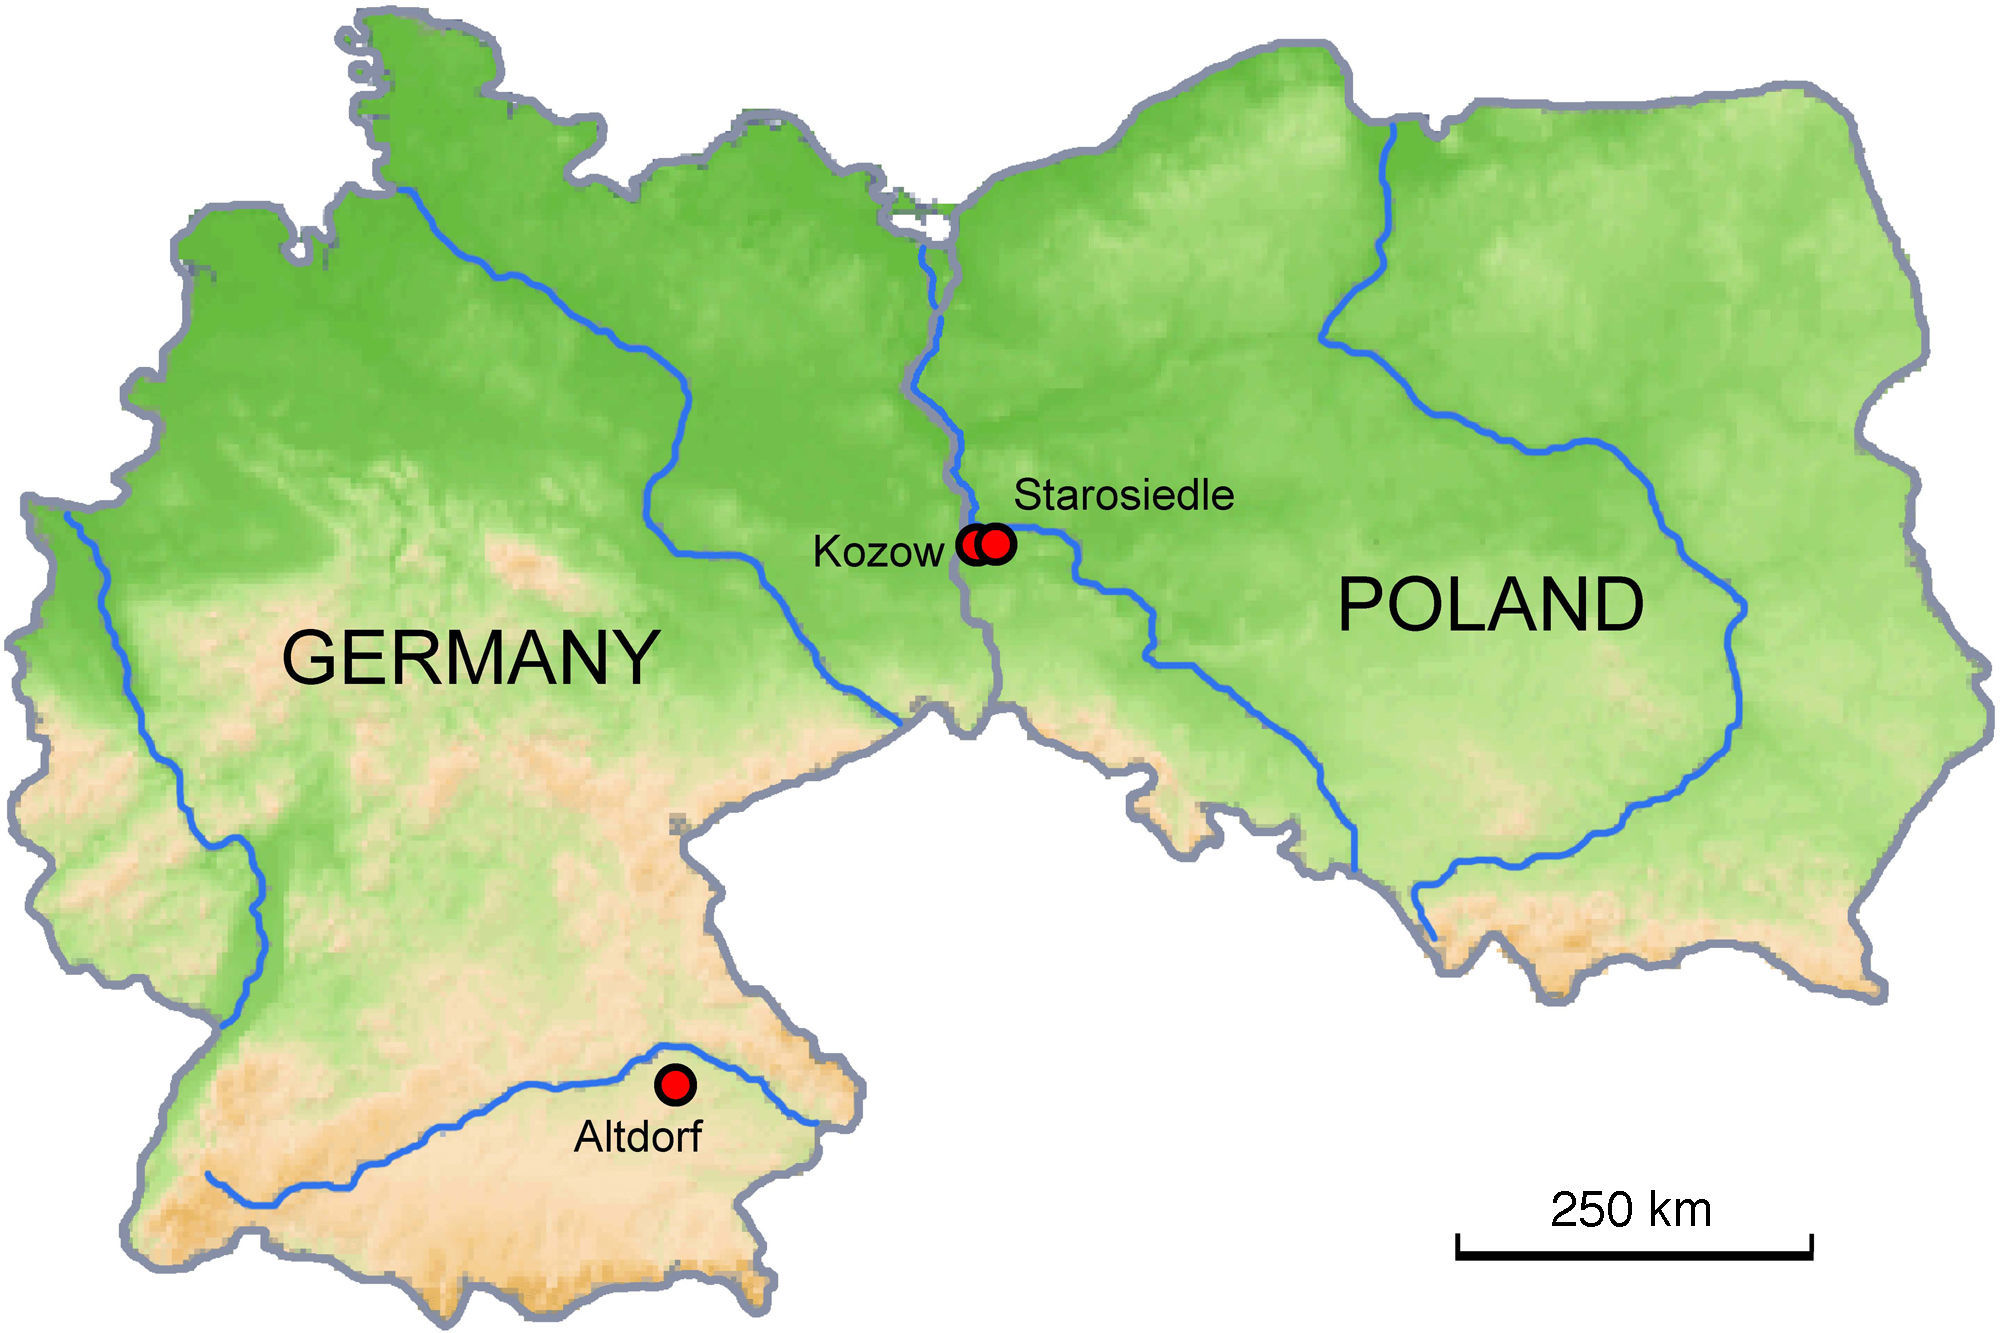
The present paper presents the results obtained in the chemical–physical (archaeometric) study undertaken on a set of glass beads found during excavations of the Early Iron Age archaeological sites at Kozów and Starosiedle in the Lubuskie Province and at Altdorf in Bavaria. The first two sites are located in western Poland and both are very next each other, while the third one is located in southern Germany (Fig. 1). The site at Kozów had most probably a cult function, the site at Starosiedle was a defensive settlement, and the site at Altdorf was an open settlement.

The site at Kozów, commune of Gubin, was excavated between 2001 and 2004 by an archaeological team from the Institute of Archaeology and Ethnology (IAE) of the Polish Academy of Sciences (PAN) in cooperation with the Cardinal Stefan Wyszyński University (UKSW) and Office for Protection of Archaeological Monuments in Dresden, Germany (LfA). The site is dated to the period of the 6th to 5th centuries BC. Most of the glass beads were unearthed in a ceremonial context of the cult wellspring, together with other valuable items, pottery bowls with polished or burnished surfaces [1]. The site is identified with the place of discovery of the famous Scythian “Vettersfelde hoard” found in the 19th century [2]. Numerous analogies suggest close relations of the form and colour of the beads from Kozów with the Scythian culture. Identical beads are found for example in Scythian graves from the 6th to 4th centuries in the broad region from the Ukrainian steppes to the northern slopes of the Caucasus Mountains and steppes on the Caspian Sea. Analogies come also from the Pontic Greek colonies, which suggest that this kind of beads could be originally manufactured by the Pontic Greeks [3].
The stronghold at Starosiedle, commune of Gubin, was firstly excavated during the second decade of the 20th century and later, between 2001 and 2004, by the same team from IAE PAN, UKSW and LfA. On the basis of these late works, two occupation levels were identified: (i) one belonging to the Early Iron Age with somewhat earlier chronology than the Kozów site (5th–4th centuries BC), and (ii) another one of Medieval time dated in the 10th–11th centuries AD [4,5]. The glass bead here studied from this site was found in the Early Iron Age level.
The early Celtic settlement at Altdorf, commune of Landshut, was excavated by a Polish-German archaeological team between 1992 and 1995. Only one occupation phase dated in the 6th–5th centuries BC was identified [6]. Nine so-called “eye” glass beads found here in the settlement context make a unique assemblage since this kind of beads are believed to be associated with rituals and belief system of the Celts, and they are usually found in graves or ceremonial sites.
The main goals of the archaeometric research on the beads undertaken by the Spanish-Polish team within the framework of bilateral projects of cooperation between the academies of sciences of the two countries were to provide some insights into the chemical composition, technology of production and state of conservation to later assess the probable provenance and the socio-economical meaning of this kind of glass items. Iron Age glass beads are little studied in comparison with other ancient glass materials [7,8]. Summarising, the main objective of the present research has been to attain information on the production technology and conservation state of these beads.
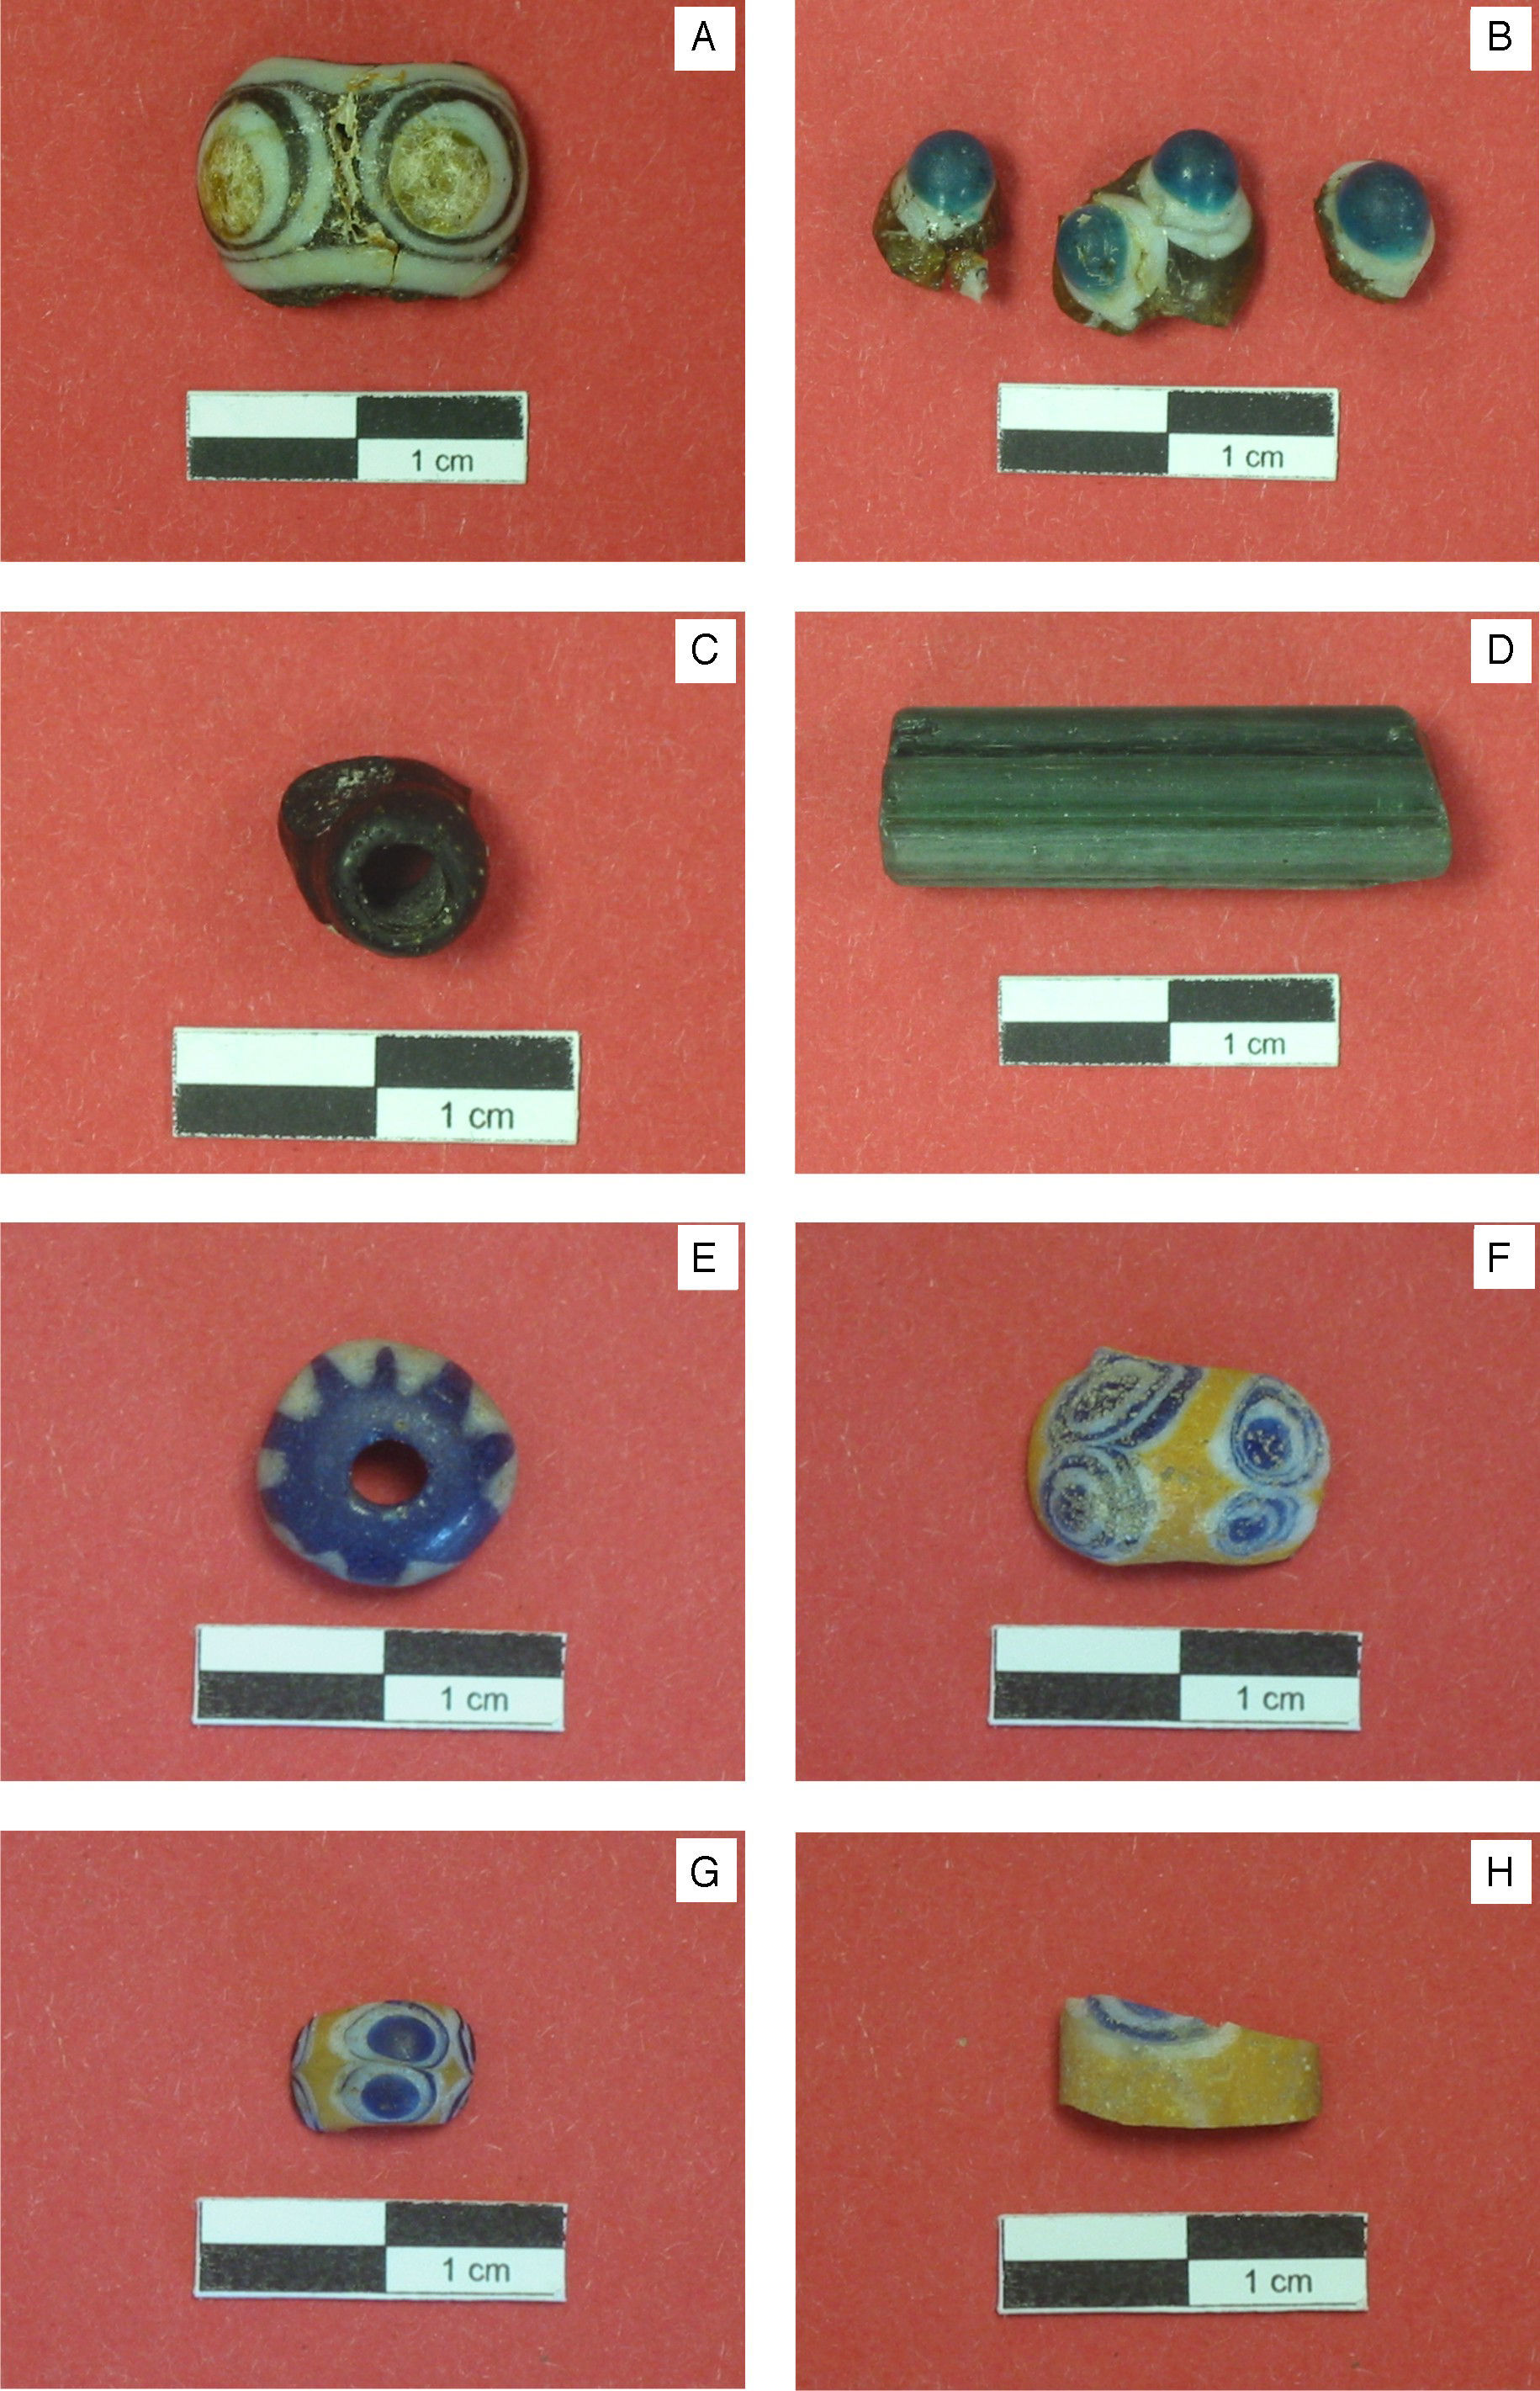
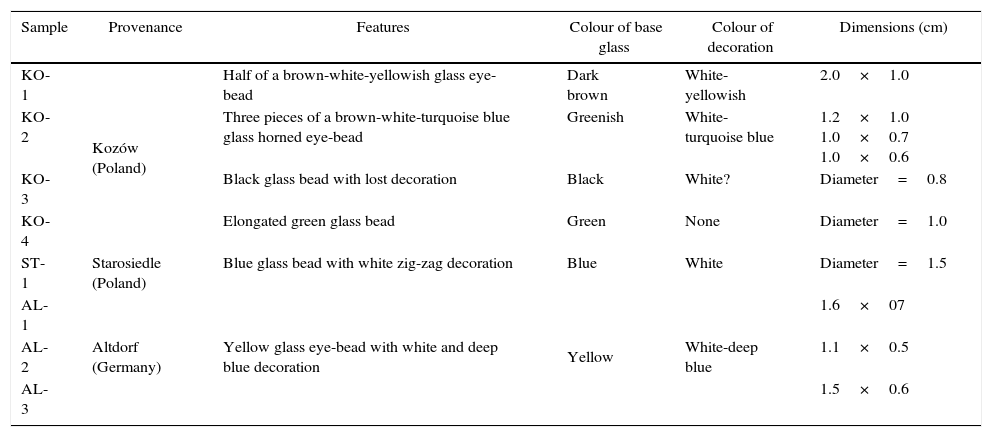
ExperimentalSamples selectedSeveral samples corresponding to some pieces of eight glass beads were analysed in this study. Descriptive information of each sample is provided in Table 1. The first sample (KO-1) is half of an eye-decorated dark brown glass bead (Fig. 2A). The brown base glass shows a heterogeneous grained mass with abundant unmelted inclusions. Decoration is made with a white glass used as background and a yellowish glass used to draw the eye. The second sample (KO-2) is composed of three pieces of a horned eye-decorated greenish glass bead (Fig. 2B). Horned eye decoration shows a white glass used as background with drops of a turquoise blue glass above the white layer. The greenish base glass shows a certain degree of transparency. The third sample (KO-3) is an opaque black glass bead (Fig. 2C) with the print of some lost decoration composed of drops of a possible white glass. The fourth sample (KO-4, Fig. 2D) is an elongated green glass bead which shows a good degree of transparency. The first three samples (KO-1, KO-2, and KO-3) were found in the ceremonial context of the Kozów site described above, whereas the KO-4 sample was located in a completely different area of the site. The fifth sample (ST-1, Fig. 2E) is a blue bead decorated with white zigzag lines, whose surface appears pitted and cracked showing a translucent appearance. The sixth, seventh and eighth samples are quite similar (AL-1, AL-2 and AL-3, Fig. 2F–H, respectively) and are made of a yellow base glass eye-decorated with white and blue concentric lines. In a more or less extent, the entire three show surface pits and craters, as well as bubbles and unmelted grains in the bulk glass.
Descriptive information on the glass beads analysed.
| Sample | Provenance | Features | Colour of base glass | Colour of decoration | Dimensions (cm) |
|---|---|---|---|---|---|
| KO-1 | Kozów (Poland) | Half of a brown-white-yellowish glass eye-bead | Dark brown | White-yellowish | 2.0×1.0 |
| KO-2 | Three pieces of a brown-white-turquoise blue glass horned eye-bead | Greenish | White-turquoise blue | 1.2×1.0 1.0×0.7 1.0×0.6 | |
| KO-3 | Black glass bead with lost decoration | Black | White? | Diameter=0.8 | |
| KO-4 | Elongated green glass bead | Green | None | Diameter=1.0 | |
| ST-1 | Starosiedle (Poland) | Blue glass bead with white zig-zag decoration | Blue | White | Diameter=1.5 |
| AL-1 | Altdorf (Germany) | Yellow glass eye-bead with white and deep blue decoration | Yellow | White-deep blue | 1.6×07 |
| AL-2 | 1.1×0.5 | ||||
| AL-3 | 1.5×0.6 |
 Sample KO-1. (B) Sample KO-2. (C) Sample KO-3. (D) Sample KO-4. (E) Sample ST-1. (F) Sample AL-1. (G) Sample AL-2. (H) Sample AL-3.")
The following analytical and observation techniques were used to carry out the archaeometric study: binocular microscope, scanning electron microscope (SEM) with energy dispersive X-ray spectrometry (EDS), X-ray diffraction (XRD), and visible spectrophotometry (VIS).
Binocular microscope observations were undertaken through a Leica MZ16 equipped with a Leica DC300 camera. SEM observations were made on uncoated samples and were accomplished with a Hitachi S-3400-N microscope (CCHS-CSIC Madrid), using acceleration voltages between 20 and 25kV and the backscattered electrons mode. Microanalyses by EDS spectrometry were carried out on the surfaces of all the samples. Only in samples KO-2 and KO-4 a polished section could be also microanalyzed. Despite EDS does not provide a high accuracy, this technique was conducted due to the high cultural value of these glass beads, in which destructive analyses should not be carried out. The EDS equipment used was a Bruker AXS spectrometer attached to the SEM microscope. The EDS microanalyses with the theoretical inner pattern were obtained by using the ZAF method of correction. Microanalyses were undertaken, on the whole, on similar sized areas of the samples, except for inclusions which were individually analysed. Accordingly, neither average values nor standards deviations were provided. Detection limits for major components (e.g., Na2O, Al2O3, SiO2, CaO, etc.) range between 0.2 and 0.5, while for minor ones (e.g., P2O5, MnO, etc.) range between 0.2 and 0.3.
XRD was employed to analyse the bulk base glass of the sample KO-1 and some experimental glasses prepared in the laboratory. These analyses were accomplished with a PANalytical X’Pert-MPD unit using Kα of copper radiation (1.54059Å), under set conditions of 45kV and 40mA. Diffraction patterns were recorded between 2θ=5–60°. VIS spectra were acquired with an Ocean Optics HR4000CG spectrophotometer in reflection mode throughout the 250–1050nm wavelength range.
To reproduce bulk materials of samples KO-1 and KO-3 and the blue decoration glass of sample KO-2, some experimental glasses were formulated. All raw materials used for the experimental glass melting were laboratory reagent-grade chemicals (Na2CO3, K2CO3, Al2O3, CaCO3, P2O5, Fe2O3, CuSO4·5H2O, MgO, MnO2, >98.50wt%). Silica source was pure quartz sand >98.40wt%. Whole glasses formulation and the corresponding reagents’ proportions were calculated bearing in mind the average result of several EDS microanalyses carried out on the clean surface (without any chemical degradation) of the original glass samples of the beads. No solvents were used for the reagents mixing. Unglazed porcelain boat shaped crucibles were used in these experiments. Even though some interaction between the glass batches and the crucibles material could not be discarded, the result will not disturb the test intention, which is the qualitative observation of glassy aspect on the more or less melted material to be obtained. The melting tests under oxidising atmosphere (air) were run in an electric lift-provided Interbil Pyrox furnace, while those under reducing atmosphere (N2/H2 90/10vol.%, pressure 1bar) were run in an electric tubular Interbil Pyrox furnace. Heating rate was 10°Cmin−1 in the 25–700°C range, and 5°Cmin−1 in the 700–1100°C and 700–1400°C ranges. Stabilisation time at 700°C was 60min, and at 1100°C and 1400°C was 120min. After the melting tests no quenching were done; the samples were maintained inside the furnace till the complete falling down of temperature after the furnace switching off. No special recalculation of the alkaline components for the experimental glasses formulation was done. Such recalculation is only required when a glass for quantitative purposes is formulated. The melting tests carried out in the present study were exclusively conducted to observe qualitatively the aspect of the melted material, i.e. if the raw materials were completely melted or not, and no quantitative calculations or analyses were further performed. They are not necessary according to our objectives.
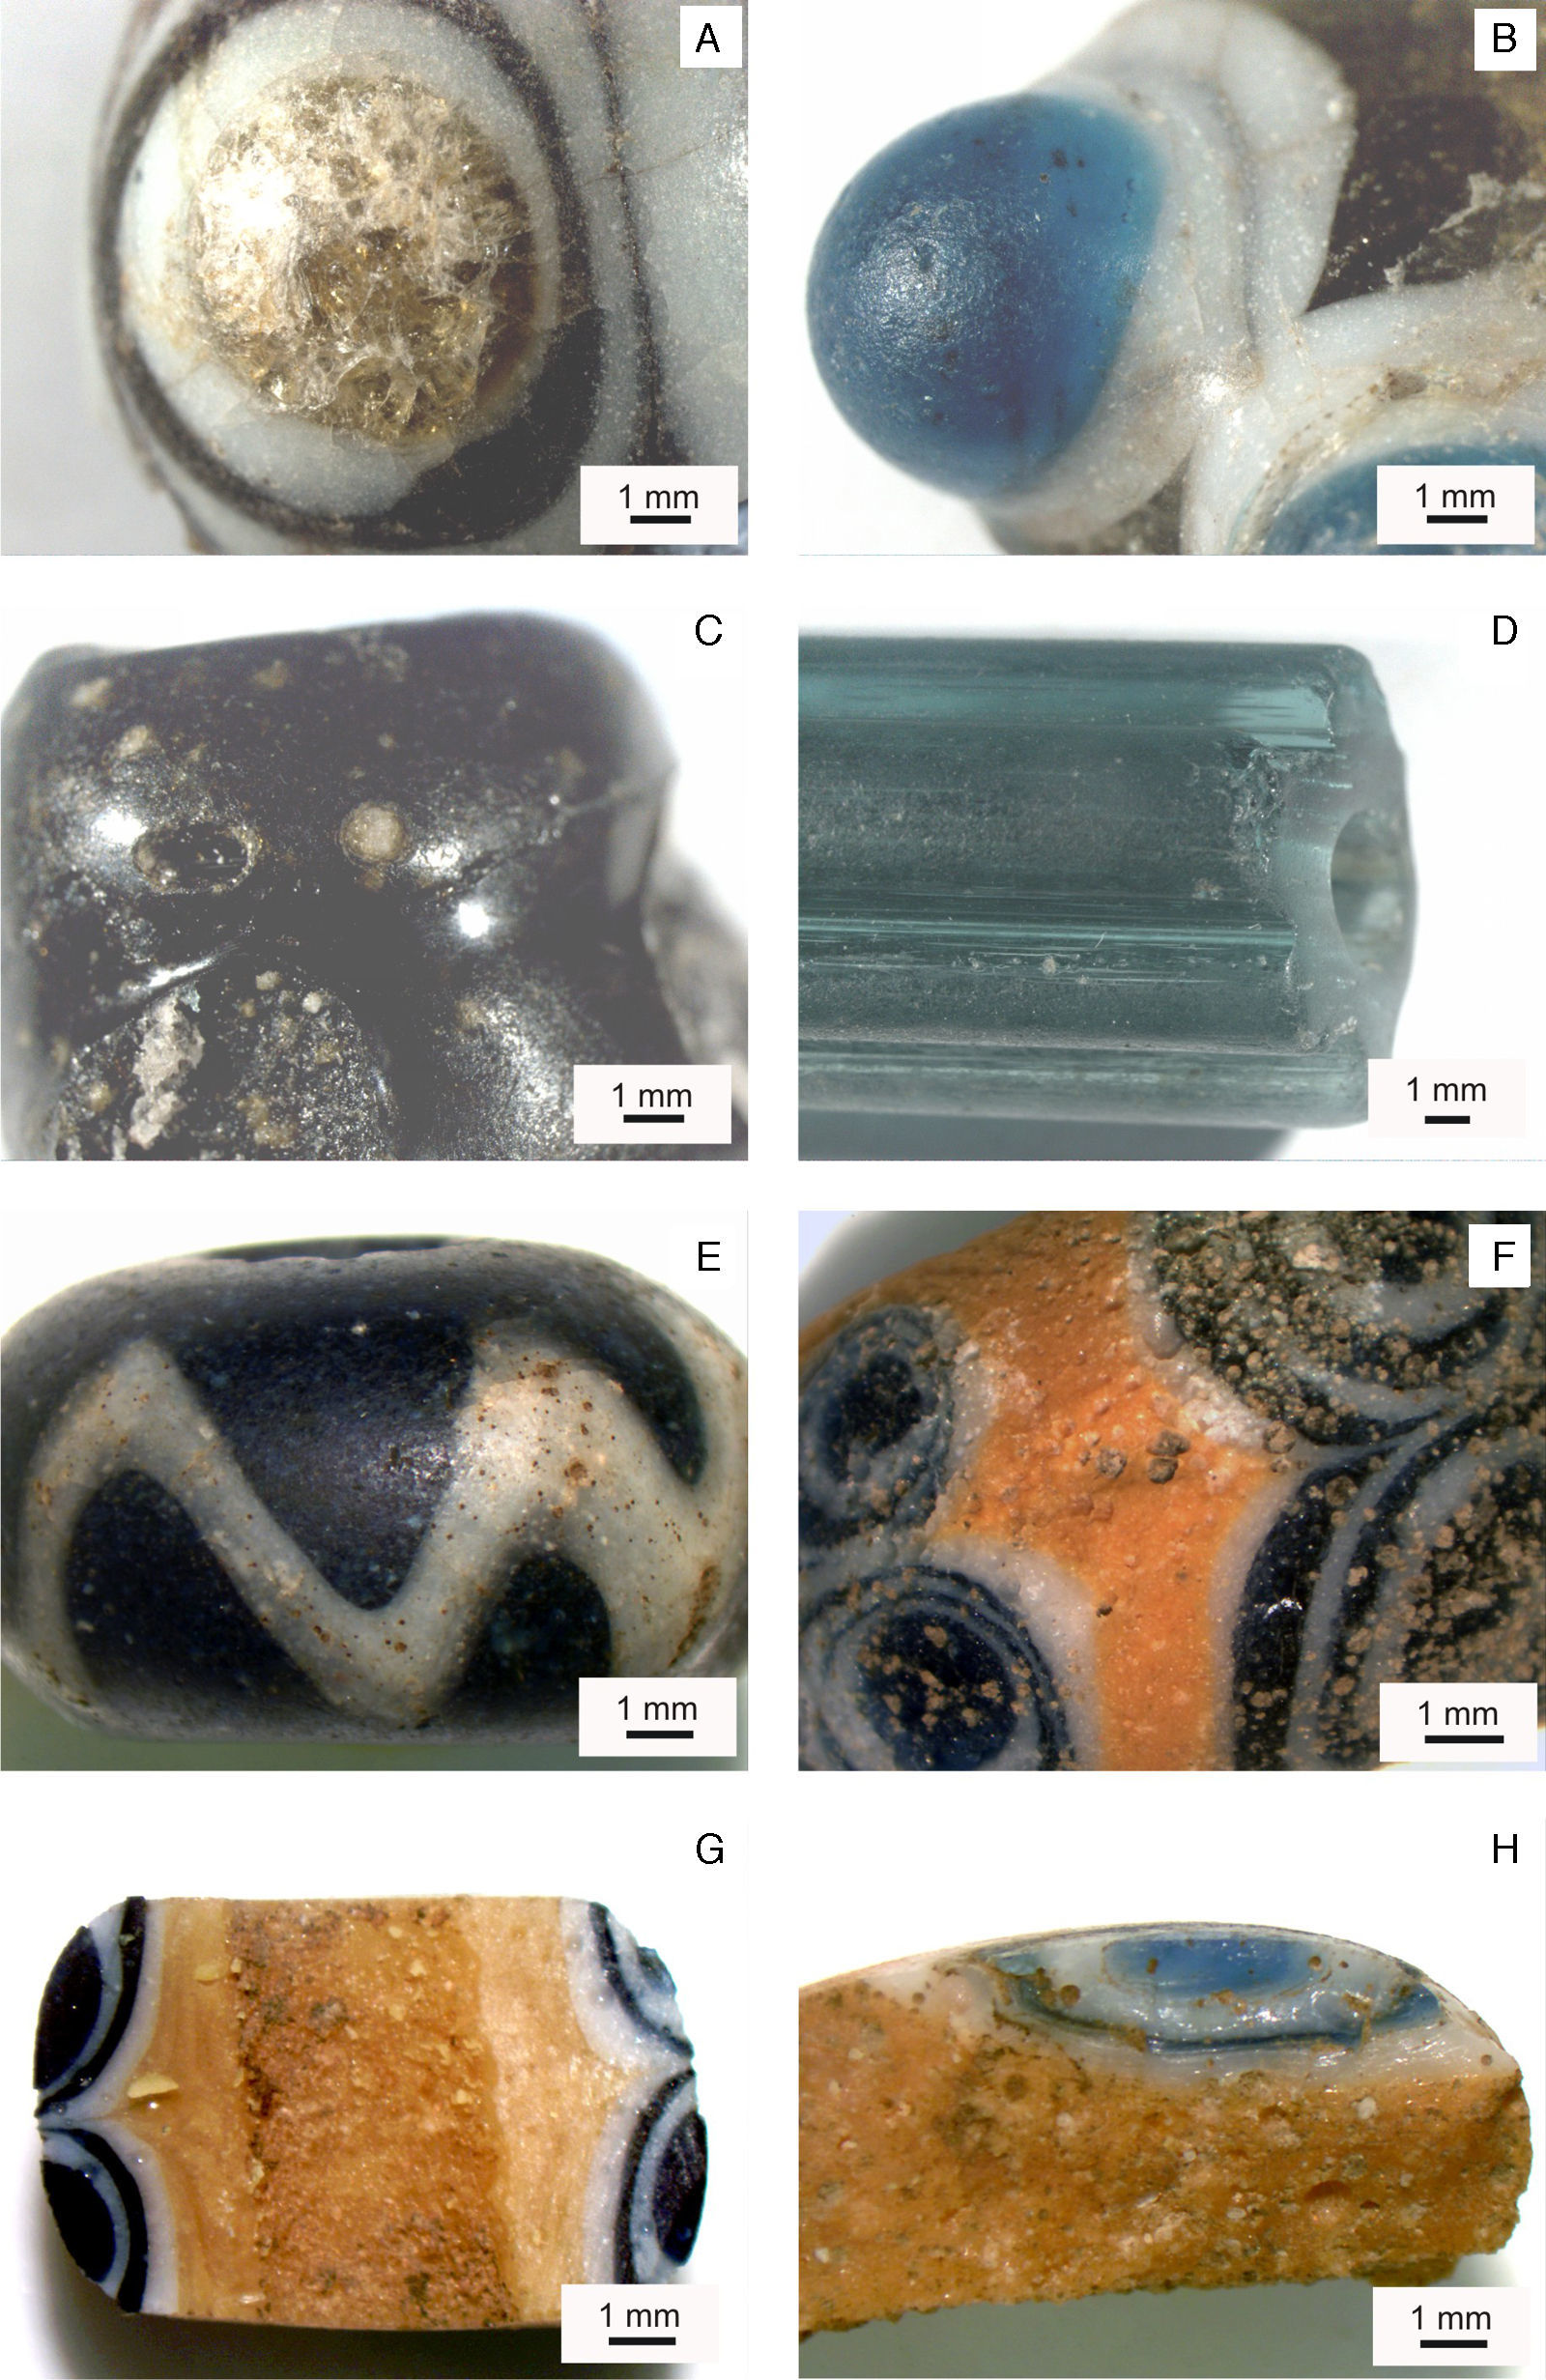
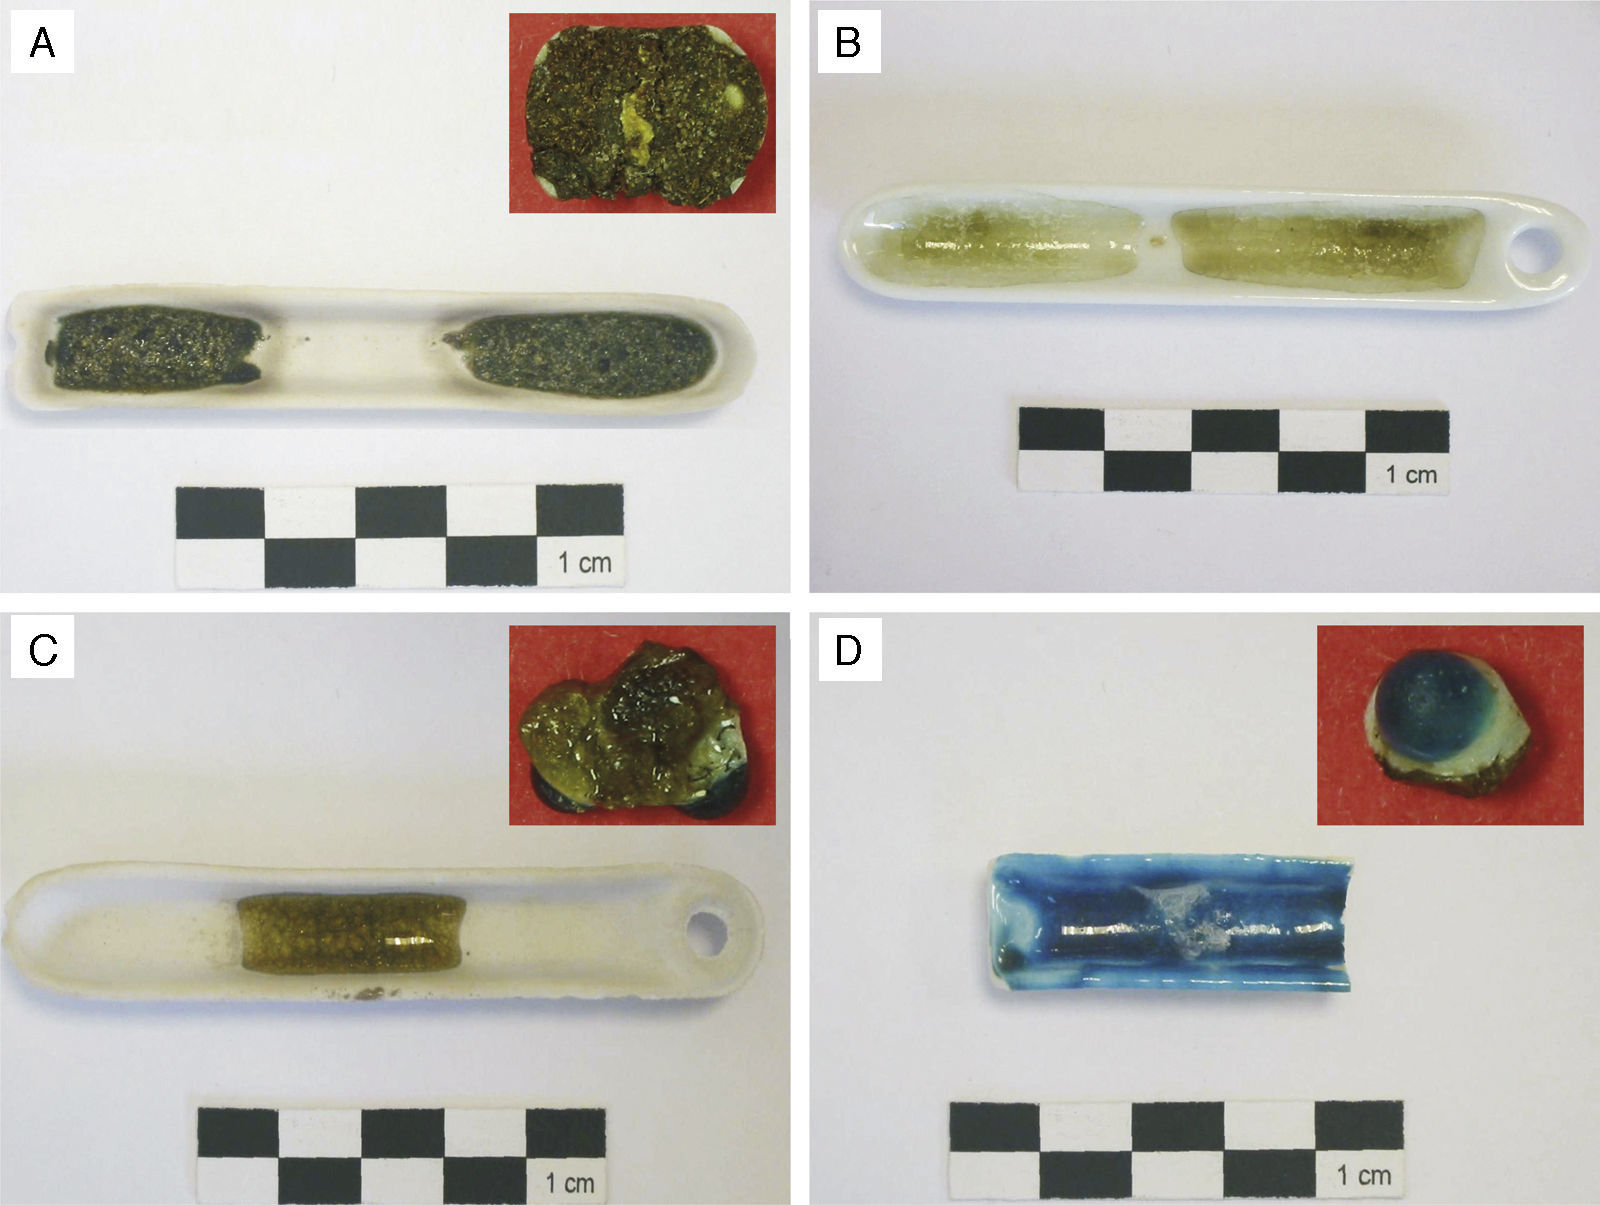
Results and discussionBinocular microscope photographs (Fig. 3) pointed out some features concerning the conservation state of the beads as a first approach. Sample KO-1 (Fig. 3A) presents a yellowish fractured material in the central part of its eyed decoration, which can be clearly assigned to a glass sustaining both chemical and mechanical deterioration, even though it conserves partial transparency and the typical fracture pattern of a glass. The black and white surfaces appear opaque and lightly grained, probably as a result of the burial conditions. The same kind of surface and conservation state can be observed in sample KO-2 (Fig. 3B). Blue and greenish surfaces show partial transparency, which account for true glasses, whereas the white one seems to be an opal glass, due to its texture and brightness. The surface of sample KO-3 (Fig. 3C) is heterogeneous, opaque and with inclusions and prints of bubbles or pores. Sample KO-4 (Fig. 3D) shows a complete glass appearance, with the well known transparency and brightness that characterise the glassy state. Signs of mechanical and maybe chemical deterioration do appear along the major axis of the bead, especially located in the most rounded and external areas. Such damages could be due, on the one hand, to chemical attack by water during burial and, on the other hand, to erosion produced by soil grains. Sample ST-1 (Fig. 3E) appears full of pits and craters, sometimes interconnected, which crack the bead surface; the presence of many bulk bubbles give rise to a translucent aspect. In the sample AL-1 (Fig. 3F) both numerous pits and craters, deeper in the eyed decoration, and bubbles indicate a heterogeneous bulk glass. Sample AL-2 (Fig. 3G) shows few but bigger surface pits, while the bulk glass is homogeneous with some big bubbles, which demonstrates that this glass was melted and refined at a higher temperature than that of the former. In sample AL-3 (Fig. 3H) many interconnected craters and surface cracks can be observed. Moreover some peeling and a heterogeneous bulk glass with many bubbles and unmelted grains were detected.
 Detail of the eye decoration of sample KO-1. (B) Detail of the horned eye decoration of sample KO-2. (C) Detail of the surface of sample KO-3. (D) Detail of the surface of sample KO-4. (E) Detail of the external surface of sample ST-1. (F) Detail of pits and craters of sample AL-1. (G) Detail of the inner surface of sample AL-2. (H) Detail of pits and craters of the external surface of sample AL-3.")
Binocular microscope photographs. (A) Detail of the eye decoration of sample KO-1. (B) Detail of the horned eye decoration of sample KO-2. (C) Detail of the surface of sample KO-3. (D) Detail of the surface of sample KO-4. (E) Detail of the external surface of sample ST-1. (F) Detail of pits and craters of sample AL-1. (G) Detail of the inner surface of sample AL-2. (H) Detail of pits and craters of the external surface of sample AL-3.
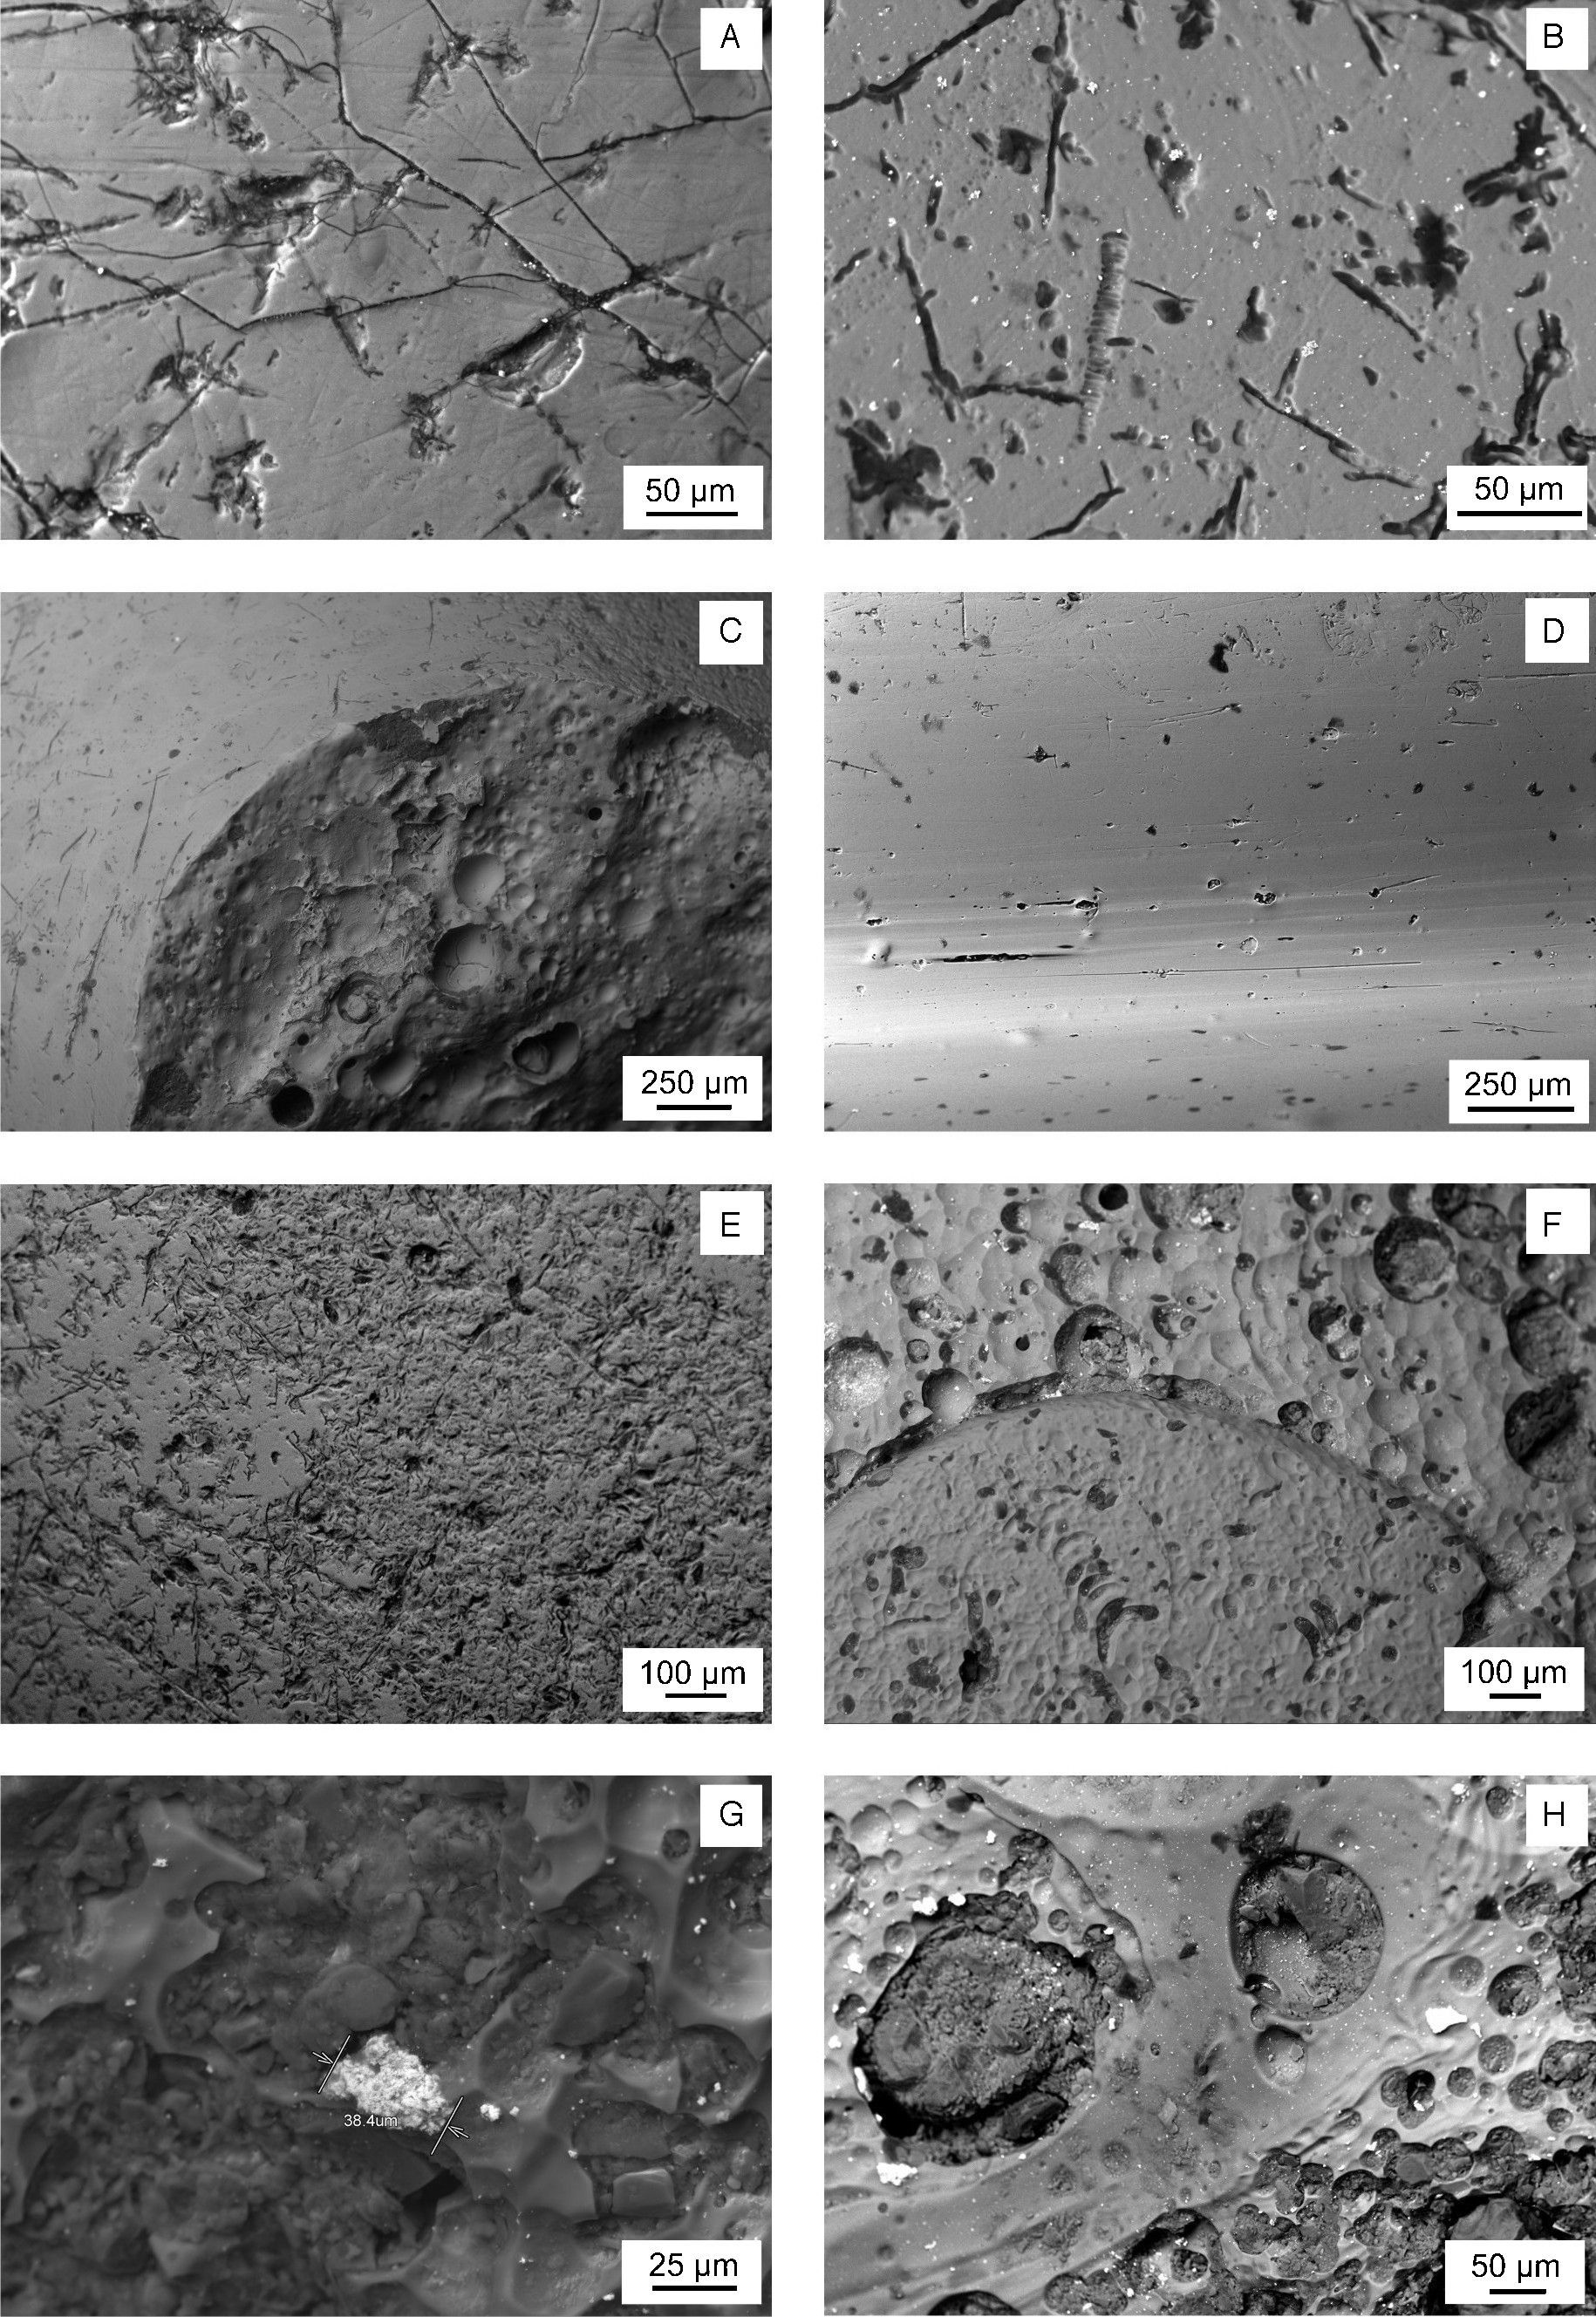
A detailed observation of the samples surface is attained by SEM. Fig. 4 shows selected features concerning to some representative damages with variable depth and extent, e.g. in the yellowish area of the sample KO-1 (Fig. 4A) and in the white area of the sample KO-2 (Fig. 4B). The morphology of such damages suggests that initial small mechanical pits or defects were progressively increased in size and depth as a consequence of the chemical attack carried out by water during burial [9]. Different surface patterns can be observed in Fig. 4C (sample KO-3). The border between the bead black surface (left area) and the area under the supposed lost decoration (right area) shows two surface states, which are due to their respective thermal histories and, probably, even to their respective chemical compositions, which would respond in a different way against water and burial conditions. As far as the sample KO-4 concerns (Fig. 4D) only elongated and aligned damages are observed. Their orientation in the same direction than the bead grooves suggests that it could have been produced by moulding and further drawing of the glass during its visco-plastic state. In sample ST-1 the most important microstructural feature concerns the textural difference between the blue base glass and the white decoration glass, while both chemical compositions remain similar. In this sample white decoration areas (Fig. 4E, left side) showed less degradation prints than the blue base glass (Fig. 4E, right side), and small inclusions (2–3μm in diameter). Similarly, sample AL-1 presents textural differences associated with the interface blue glass and white glass of the eyed decoration: the white area shows bigger bubbles and inclusions (<20μm) (Fig. 4F, upper part). In the corresponding yellow base glass inclusions (<30μm) were detected. Yellow base glass of sample AL-2 also showed inclusions (Fig. 4G), and a heterogeneous microstructure with bubbles, especially distributed over the interface between the yellow glass and the white glass. The corresponding white glass of decoration presents inclusions (≈40μm). The microstructural pattern of sample AL-3 is very similar to that of sample AL-2, regarding both the inclusions of the yellow and white glasses and the textural features (heterogeneity, bubbles, degradation prints, etc.) (Fig. 4H).
 Yellowish area of sample KO-1. (B) White area of sample KO-2. White small particles are SnO2 inclusions. (C) Border between the black surface (left up) and the area under the lost decoration (right bottom) of sample KO-3. (D) Surface of Sample KO-4. (E) Interface area between the blue surface (right up) and the white surface (left bottom) of sample ST-1. (F) Interface area between the white surface with SnO2 inclusions (up) and the blue surface (bottom) of sample AL-1. (G) Yellow surface of sample AL-2 with an inclusion of lead and antimony oxides. (H) Yellow surface of sample AL-3 with inclusions of lead and antimony oxides, bubbles, pits and craters.")
Backscattered electron SEM micrographs. (A) Yellowish area of sample KO-1. (B) White area of sample KO-2. White small particles are SnO2 inclusions. (C) Border between the black surface (left up) and the area under the lost decoration (right bottom) of sample KO-3. (D) Surface of Sample KO-4. (E) Interface area between the blue surface (right up) and the white surface (left bottom) of sample ST-1. (F) Interface area between the white surface with SnO2 inclusions (up) and the blue surface (bottom) of sample AL-1. (G) Yellow surface of sample AL-2 with an inclusion of lead and antimony oxides. (H) Yellow surface of sample AL-3 with inclusions of lead and antimony oxides, bubbles, pits and craters.
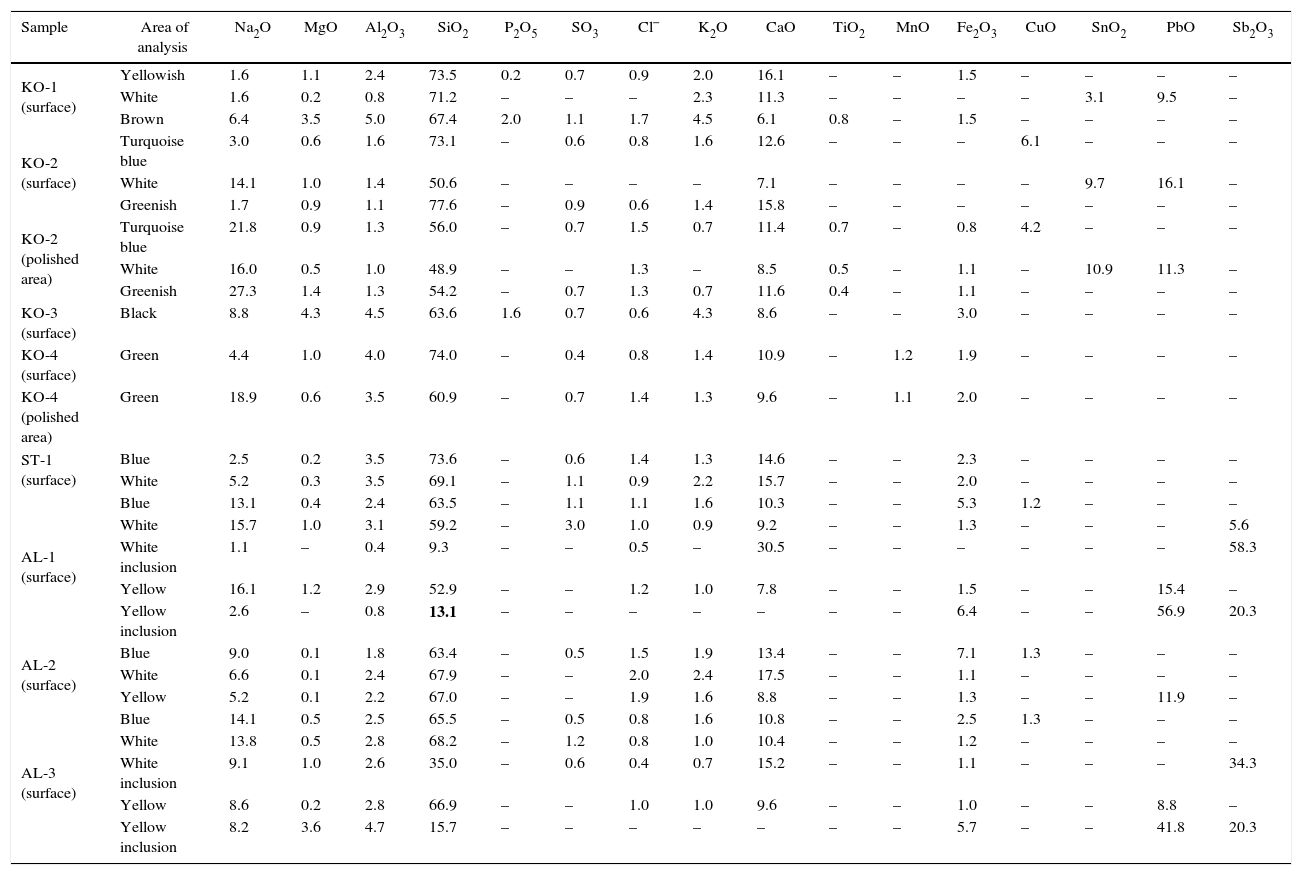
Given the singularity of the beads studied, destructive analyses were discarded. Therefore, chemical composition of the samples was only achieved by EDS on their surfaces or, when possible, on a small polished area of the surface. Table 2 shows the results obtained on each different area of the samples. In addition, chromatic characterisation of samples is quite difficult to undertake by conventional spectrophotometry analyses, since the preparation of thin slabs from the original samples implies their destruction. Thus, two kind of indirect qualitative evaluations were done. The first one concern samples KO-1, KO-2 and KO-3; for that purpose some experiments were carried out by preparing and melting small batches that contain the chromophores supposedly responsible for colours of samples. The second one concern samples ST-1, AL-1, AL-2 and AL-3; for that purpose VIS spectra of the surface of glasses were recorded in the reflexion mode. The corresponding results are included in the following sections for each sample.
Results from chemical analyses by EDS (wt%).
| Sample | Area of analysis | Na2O | MgO | Al2O3 | SiO2 | P2O5 | SO3 | Cl− | K2O | CaO | TiO2 | MnO | Fe2O3 | CuO | SnO2 | PbO | Sb2O3 |
|---|---|---|---|---|---|---|---|---|---|---|---|---|---|---|---|---|---|
| KO-1 (surface) | Yellowish | 1.6 | 1.1 | 2.4 | 73.5 | 0.2 | 0.7 | 0.9 | 2.0 | 16.1 | – | – | 1.5 | – | – | – | – |
| White | 1.6 | 0.2 | 0.8 | 71.2 | – | – | – | 2.3 | 11.3 | – | – | – | – | 3.1 | 9.5 | – | |
| Brown | 6.4 | 3.5 | 5.0 | 67.4 | 2.0 | 1.1 | 1.7 | 4.5 | 6.1 | 0.8 | – | 1.5 | – | – | – | – | |
| KO-2 (surface) | Turquoise blue | 3.0 | 0.6 | 1.6 | 73.1 | – | 0.6 | 0.8 | 1.6 | 12.6 | – | – | – | 6.1 | – | – | – |
| White | 14.1 | 1.0 | 1.4 | 50.6 | – | – | – | – | 7.1 | – | – | – | – | 9.7 | 16.1 | – | |
| Greenish | 1.7 | 0.9 | 1.1 | 77.6 | – | 0.9 | 0.6 | 1.4 | 15.8 | – | – | – | – | – | – | – | |
| KO-2 (polished area) | Turquoise blue | 21.8 | 0.9 | 1.3 | 56.0 | – | 0.7 | 1.5 | 0.7 | 11.4 | 0.7 | – | 0.8 | 4.2 | – | – | – |
| White | 16.0 | 0.5 | 1.0 | 48.9 | – | – | 1.3 | – | 8.5 | 0.5 | – | 1.1 | – | 10.9 | 11.3 | – | |
| Greenish | 27.3 | 1.4 | 1.3 | 54.2 | – | 0.7 | 1.3 | 0.7 | 11.6 | 0.4 | – | 1.1 | – | – | – | – | |
| KO-3 (surface) | Black | 8.8 | 4.3 | 4.5 | 63.6 | 1.6 | 0.7 | 0.6 | 4.3 | 8.6 | – | – | 3.0 | – | – | – | – |
| KO-4 (surface) | Green | 4.4 | 1.0 | 4.0 | 74.0 | – | 0.4 | 0.8 | 1.4 | 10.9 | – | 1.2 | 1.9 | – | – | – | – |
| KO-4 (polished area) | Green | 18.9 | 0.6 | 3.5 | 60.9 | – | 0.7 | 1.4 | 1.3 | 9.6 | – | 1.1 | 2.0 | – | – | – | – |
| ST-1 (surface) | Blue | 2.5 | 0.2 | 3.5 | 73.6 | – | 0.6 | 1.4 | 1.3 | 14.6 | – | – | 2.3 | – | – | – | – |
| White | 5.2 | 0.3 | 3.5 | 69.1 | – | 1.1 | 0.9 | 2.2 | 15.7 | – | – | 2.0 | – | – | – | – | |
| AL-1 (surface) | Blue | 13.1 | 0.4 | 2.4 | 63.5 | – | 1.1 | 1.1 | 1.6 | 10.3 | – | – | 5.3 | 1.2 | – | – | – |
| White | 15.7 | 1.0 | 3.1 | 59.2 | – | 3.0 | 1.0 | 0.9 | 9.2 | – | – | 1.3 | – | – | – | 5.6 | |
| White inclusion | 1.1 | – | 0.4 | 9.3 | – | – | 0.5 | – | 30.5 | – | – | – | – | – | – | 58.3 | |
| Yellow | 16.1 | 1.2 | 2.9 | 52.9 | – | – | 1.2 | 1.0 | 7.8 | – | – | 1.5 | – | – | 15.4 | – | |
| Yellow inclusion | 2.6 | – | 0.8 | 13.1 | – | – | – | – | – | – | – | 6.4 | – | – | 56.9 | 20.3 | |
| AL-2 (surface) | Blue | 9.0 | 0.1 | 1.8 | 63.4 | – | 0.5 | 1.5 | 1.9 | 13.4 | – | – | 7.1 | 1.3 | – | – | – |
| White | 6.6 | 0.1 | 2.4 | 67.9 | – | – | 2.0 | 2.4 | 17.5 | – | – | 1.1 | – | – | – | – | |
| Yellow | 5.2 | 0.1 | 2.2 | 67.0 | – | – | 1.9 | 1.6 | 8.8 | – | – | 1.3 | – | – | 11.9 | – | |
| AL-3 (surface) | Blue | 14.1 | 0.5 | 2.5 | 65.5 | – | 0.5 | 0.8 | 1.6 | 10.8 | – | – | 2.5 | 1.3 | – | – | – |
| White | 13.8 | 0.5 | 2.8 | 68.2 | – | 1.2 | 0.8 | 1.0 | 10.4 | – | – | 1.2 | – | – | – | – | |
| White inclusion | 9.1 | 1.0 | 2.6 | 35.0 | – | 0.6 | 0.4 | 0.7 | 15.2 | – | – | 1.1 | – | – | – | 34.3 | |
| Yellow | 8.6 | 0.2 | 2.8 | 66.9 | – | – | 1.0 | 1.0 | 9.6 | – | – | 1.0 | – | – | 8.8 | – | |
| Yellow inclusion | 8.2 | 3.6 | 4.7 | 15.7 | – | – | – | – | – | – | – | 5.7 | – | – | 41.8 | 20.3 |
– not detected.
Sample KO-1: yellowish and white surface areas present a similar chemical composition corresponding to a soda lime silicate glass strongly dealkalinised (low Na2O content and relative high SiO2 content, as a result of the corresponding percentage enrichment) [10]. The difference between these two glasses is that the white one contents additional amounts of SnO2 and PbO, responsible for the white opaque aspect, as is confirmed by the small clear inclusions identified by SEM. The brown area of this sample displays a chemical composition very different to a common soda lime silicate glass, since Na2O, MgO, Al2O3, P2O5 and K2O contents are higher, while SiO2 and CaO contents are lower. These proportions may indicate that the brown material could have been made from plants ashes as alkaline raw materials, i.e. it would be a high magnesium soda lime glass (HMG) [11,12]. As far as the chromophores concerns Fig. 5A and B demonstrate that iron ions (Fe2+ and Fe3+) are responsible for the brown colour when melted at 1100°C, as well as for the greenish colour if the glass was properly melted up to 1400°C.
 and KO-2 (greenish and turquoise blue areas). (A) Batch from the sample KO-1 at 1100°C. The small photograph shows the grained rear side of the sample KO-1. (B) Batch from the sample KO-1 at 1400°C. (C) Batch from the greenish area of the sample KO-2. The small photograph shows the greenish area of the sample KO-2. (D) Batch from the turquoise blue area of the sample KO-2. The small photograph shows the turquoise blue area of the sample KO-2.")
Melting tests from batches prepared in the laboratory according to the composition of samples KO-1 (grained rear side) and KO-2 (greenish and turquoise blue areas). (A) Batch from the sample KO-1 at 1100°C. The small photograph shows the grained rear side of the sample KO-1. (B) Batch from the sample KO-1 at 1400°C. (C) Batch from the greenish area of the sample KO-2. The small photograph shows the greenish area of the sample KO-2. (D) Batch from the turquoise blue area of the sample KO-2. The small photograph shows the turquoise blue area of the sample KO-2.
Sample KO-2: both turquoise and greenish areas have similar chemical composition corresponding to a dealkalinised soda lime silicate glass (low Na2O percentage and relative enriched percentage of SiO2). The composition of the white area is quite different and is characterised by a higher content of Na2O, lower contents of SiO2 and CaO, and other two oxides SnO2 and PbO in relative high weight percentages, 9.7 and 16.1, respectively. These latter oxides account for the opaque white feature, which is confirmed by the microcrystals detected by SEM observations (Fig. 4B) as white small inclusions. Moreover, the microanalysis of such microcrystals provided high concentrations of tin and lead oxides, which are responsible for the opacity of the white glass [13]. Some other EDS analyses were carried out on a small polished area of the sample KO-2 (bulk glass not degraded), which provided more accurate results than those undertaken on the rough degraded surface. In fact, these results confirm that both turquoise and greenish areas correspond to soda lime silicate glasses with similar composition, in which a low content of MgO (∼1wt%) is detected. Thus, both of them can be assigned to low magnesium soda lime glasses (LMG), probably produced from mineral natron as alkaline raw material [11,12]. However, the concentration of CuO is quite different, since it is at about 4wt% in the turquoise glass, while it is not detected in the greenish one. Therefore, such turquoise blue colour can be attributed to Cu2+-ions, exclusively [14]. As far as the composition of the polished white area is concerned, it deals with a soda lime silicate glass in which the relative low percentage of SiO2 (∼49wt%) and high content of PbO (∼11wt%) could play together as glass network formers, while a relative high amount of SnO2 (∼11wt%) explains the presence of microcrystals responsible for the white opacity (Fig. 4B). The results of the melting experiments to clarify what are the chromophores, confirmed that in the greenish glass they can be assigned to Fe2+ and Fe3+-ions (Fig. 5C), while the turquoise blue colour is due to Cu2+-ions (Fig. 5D).
Sample KO-3: as expected on the basis of EDS microanalyses, the chemical composition of this sample is quite similar to that of the brown area of the sample KO-1, even though the Fe2O3 content is higher. Therefore, it could be assigned to a kind of soda lime silicate glass produced from plant ashes as a source of alkaline components (HMG). With respect to the chromophores of this sample, iron ions (Fe2+ and Fe3+) are the responsible for the brown colour (Fig. 5A).
Sample KO-4: EDS analyses carried out on the rough degraded area indicate that it is a dealkalinised soda lime silicate glass. In turns, EDS analyses from the corresponding polished surface (non degraded bulk glass) demonstrated that it can be assigned to a soda lime glass, maybe obtained by using natron as alkaline source (LMG) (high Na2O content, very low MgO and P2O5 not detected). It is important to note the percentages of iron and manganese oxides. The first one is responsible for the green colour (the mixture of iron ions in the two possible oxidation states: Fe3+ yellow and Fe2+ blue, gives rise to green colour), and the second one was probably added as a decolourant. The use of manganese minerals (pyrolusite, mainly MnO2) as decolourant is an ancient tradition based on the chromatic compensation of Fe2+-ions (greenish blue) with manganese oxide [15]. The reduction-oxidation (redox) reaction results on the formation of Fe3+-ions (light yellowish) and Mn2+-ions (colourless). Obviously, in sample KO-4 the relative proportions of iron and manganese were not adequate to achieve a colourless glass.
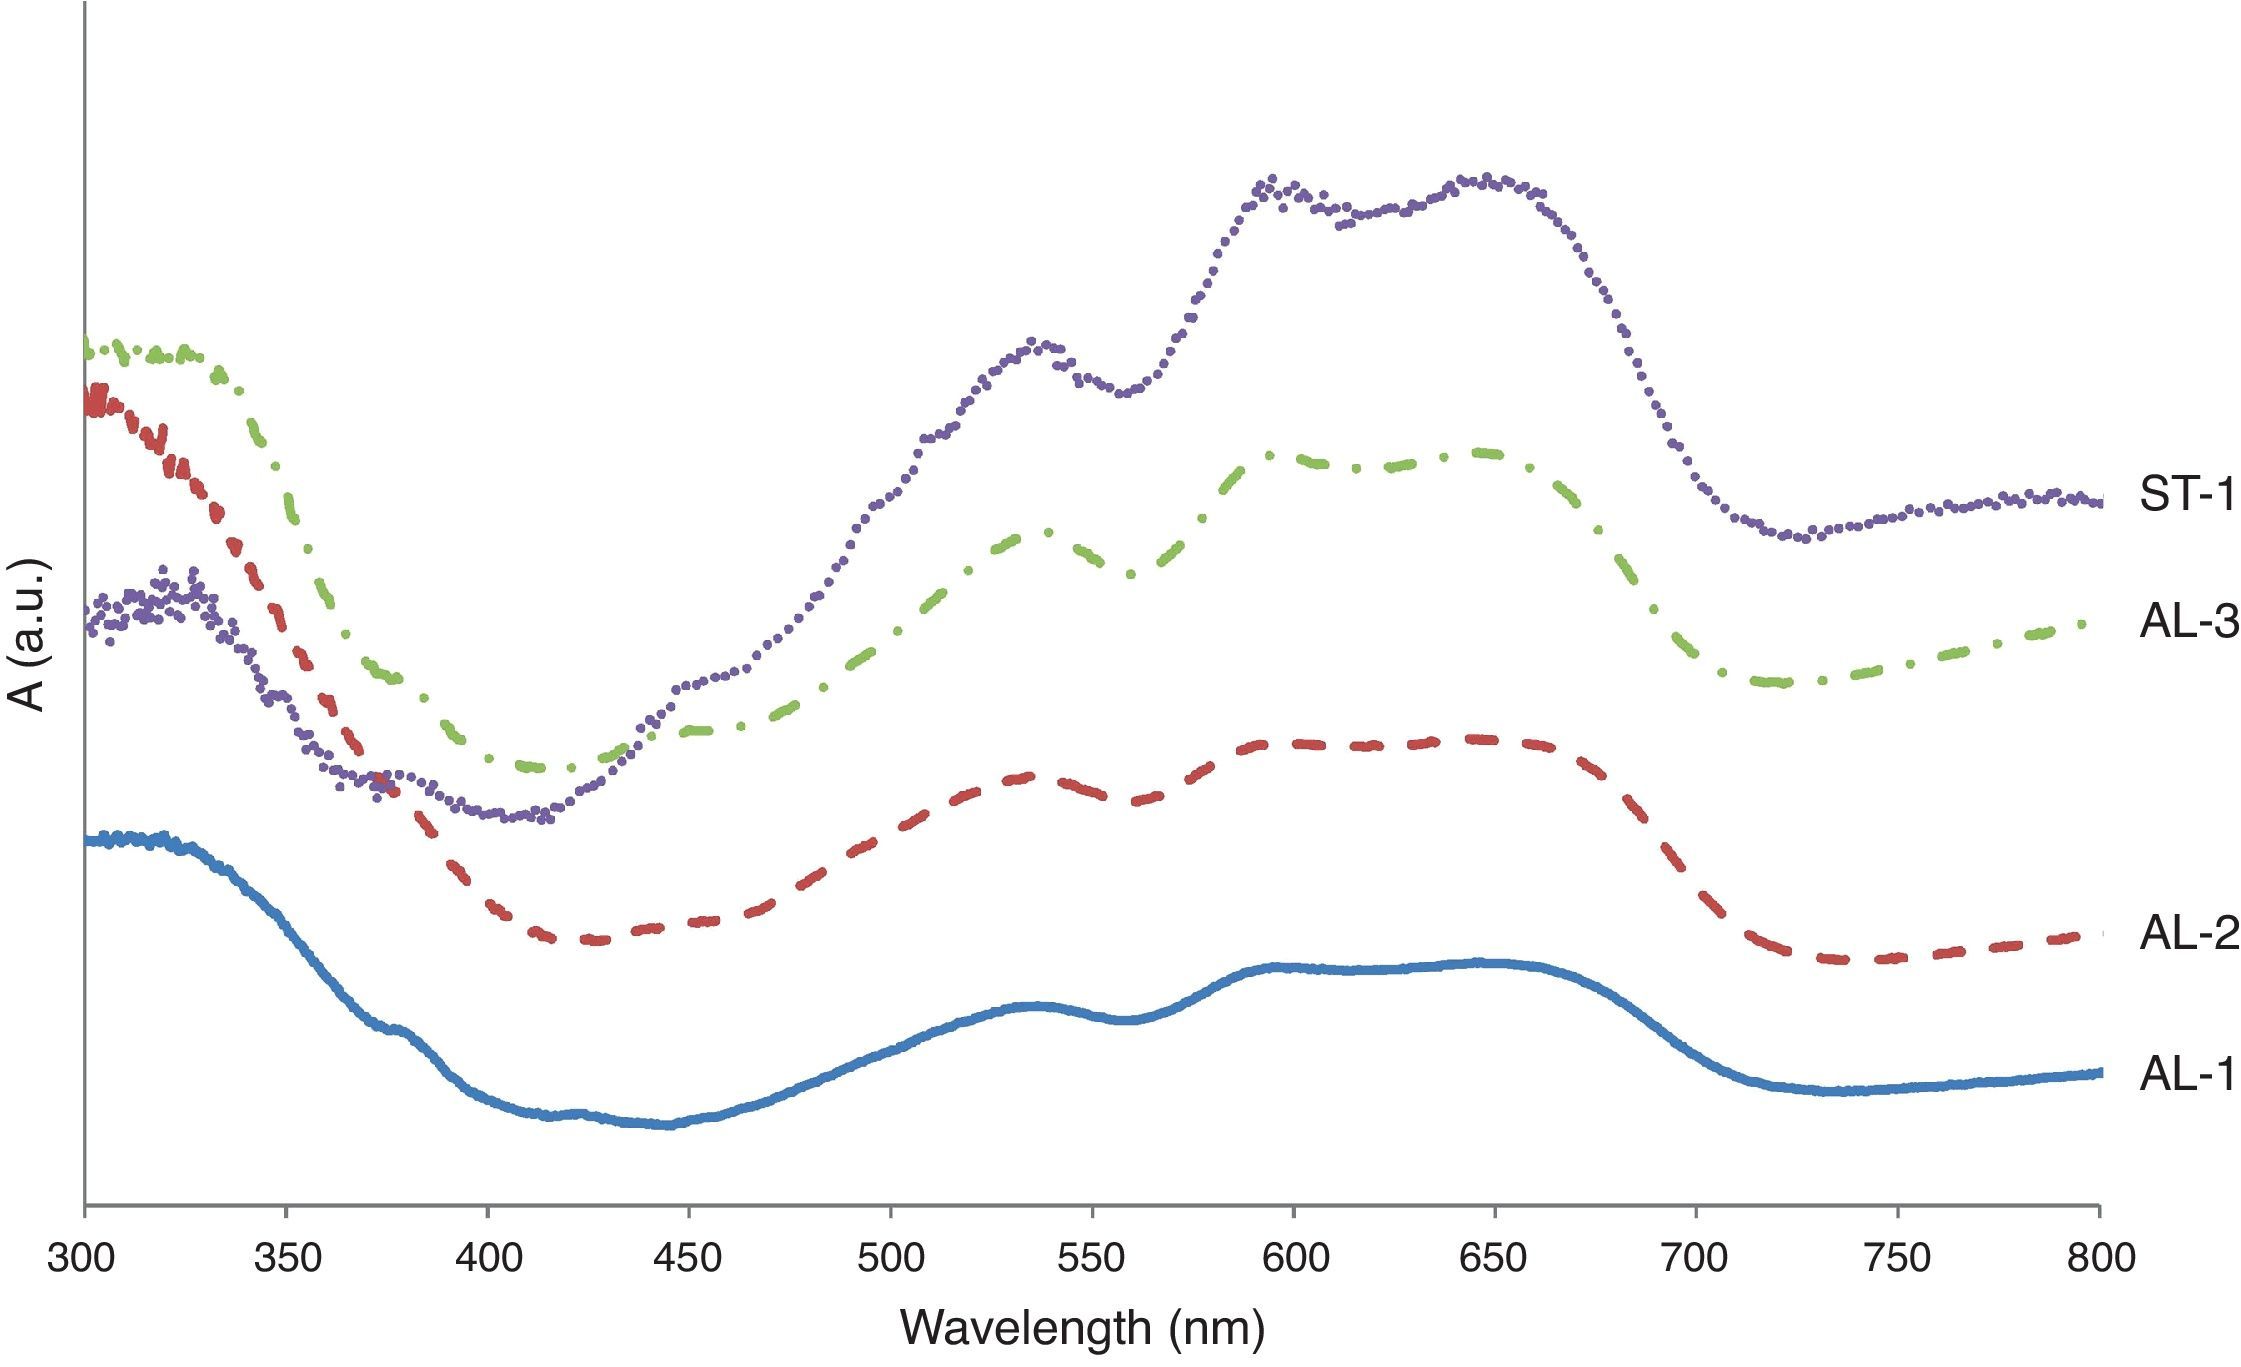
Sample ST-1: as EDS analyses indicate, the blue base glass is a soda lime silicate deeply dealkalinised, whose chemical composition is similar to that of sample KO-2, greenish bulk glass and turquoise blue decoration. Therefore, the base glass of sample ST-1 can be assigned to a low magnesium soda lime glass (LMG). However, ST-1 sample contents a high percentage of Fe2O3, instead of copper as is the case of sample KO-2. Such iron ions may contribute to the dark blue colour of sample ST-1. In addition, some very small content of Co2+ ions (not detectable by EDS) were identified by VIS spectrophotometry as the main chromophores responsible for the blue colour (Fig. 6A). Spectrophotometric detection of Co2+ ions by VIS spectrophotometry is accurate enough to safely assume the presence of such chromophores in the glass matrix, even though their proportion is very low [13]. As regards the white decoration, its chemical composition corresponds to a dealkalinised soda lime silicate glass (also LMG glass), in which local EDS microanalyses detected small inclusions (2–3μm in diameter) containing SnO2, as responsible for the opaque white appearance. The relatively high percentage of Fe2O3 detected by EDS in the white layer (see Table 2) can be explained by the nearness of the base glass.
 Sample ST-1. (B) Sample AL-1. (C) Sample AL-2. (D) Sample AL-3.")
Sample AL-1: both the yellow base glass and glasses of the decoration (blue and white) are soda lime silicates containing low percentage of MgO, i.e. LMG. Moreover, EDS microanalyses pointed out that possible dealkalinisation of such glass surfaces did not progress to an important extent. This is related to the burial conditions of the bead, probably in a drier environment compared, for instance, with that of samples from Kozów. EDS microanalyses of the yellow base glass demonstrated the presence of inclusions (∼30μm) containing PbO and Sb2O3 in proportions coherent with lead antimonate, which are responsible for the opaque yellow colour. Microanalyses carried out in the inclusions (<20μm) of the white decoration glass indicated high contents of CaO and Sb2O3, probably incorporated as calcium antimonate to give the opaque white appearance [16]. Finally, in the blue decoration glass EDS microanalyses detected iron and copper as contributing chromophores. In addition, the VIS spectrum pointed out the presence of cobalt ions as the main blue chromophores (Fig. 6B). This deep blue colour, as well as in samples ST-1, AL-2 and AL-3, is assigned to the combination of iron, copper and cobalt ions, even though Co2+-ions, due to its very high extinction coefficient, mask the contribution from iron and copper ions.
Sample AL-2: similarly to sample AL-1, the chemical composition of this bead (yellow, blue and white glasses) corresponds to LMG soda lime silicate glasses, even though some dealkalinisation has taken place. Once again microanalyses carried out on the yellow glass showed high contents of PbO and Sb2O3 inside inclusions of ≈25μm in diameter, responsible for the opaque yellow colour (Fig. 4G). Likewise, inclusions detected on the white glass (∼40μm in diameter) contain CaO and Sb2O3 near the calcium antimonate stoichiometry. In the blue decoration glass the chromophores are similar to those of the sample AL-1: iron, copper and cobalt ions (Fig. 6C).
Sample AL-3: EDS microanalyses demonstrated that the chemical composition of the glasses of this sample (yellow, blue and white) is very similar to that of the sample AL-1, as well as the chromophores detected by EDS and VIS spectrophotometry (Fig. 6D).
From the point of view of chemical composition and provenance, the samples KO-1 and KO-3 are HMG soda lime glasses with a medium concentration of K2O, which suggest that these beads could be European imitations of typical glass beads from the Near East and Egypt. Contents of MgO and K2O are closer to those found in Bronze Age and Early Iron Age glass beads from Western and Southern Europe [17]. On the other hand, the samples KO-2, ST-1, AL-1, Al-2 and AL-3 are LMG soda lime glasses which probably come from the Near East and Egypt [18]. Very similar chemical compositions of the glass beads here studied (either for LMG or HMG glasses with the exception of the sample KO-4) have been determined in glass beads from the Hallstatt C and D periods in Early Iron Age archaeological contexts of southwestern Poland [19]. Although the sample KO-4 is a common LMG soda lime glass, its chemical composition can be assimilated to a typical composition of a Roman glass.
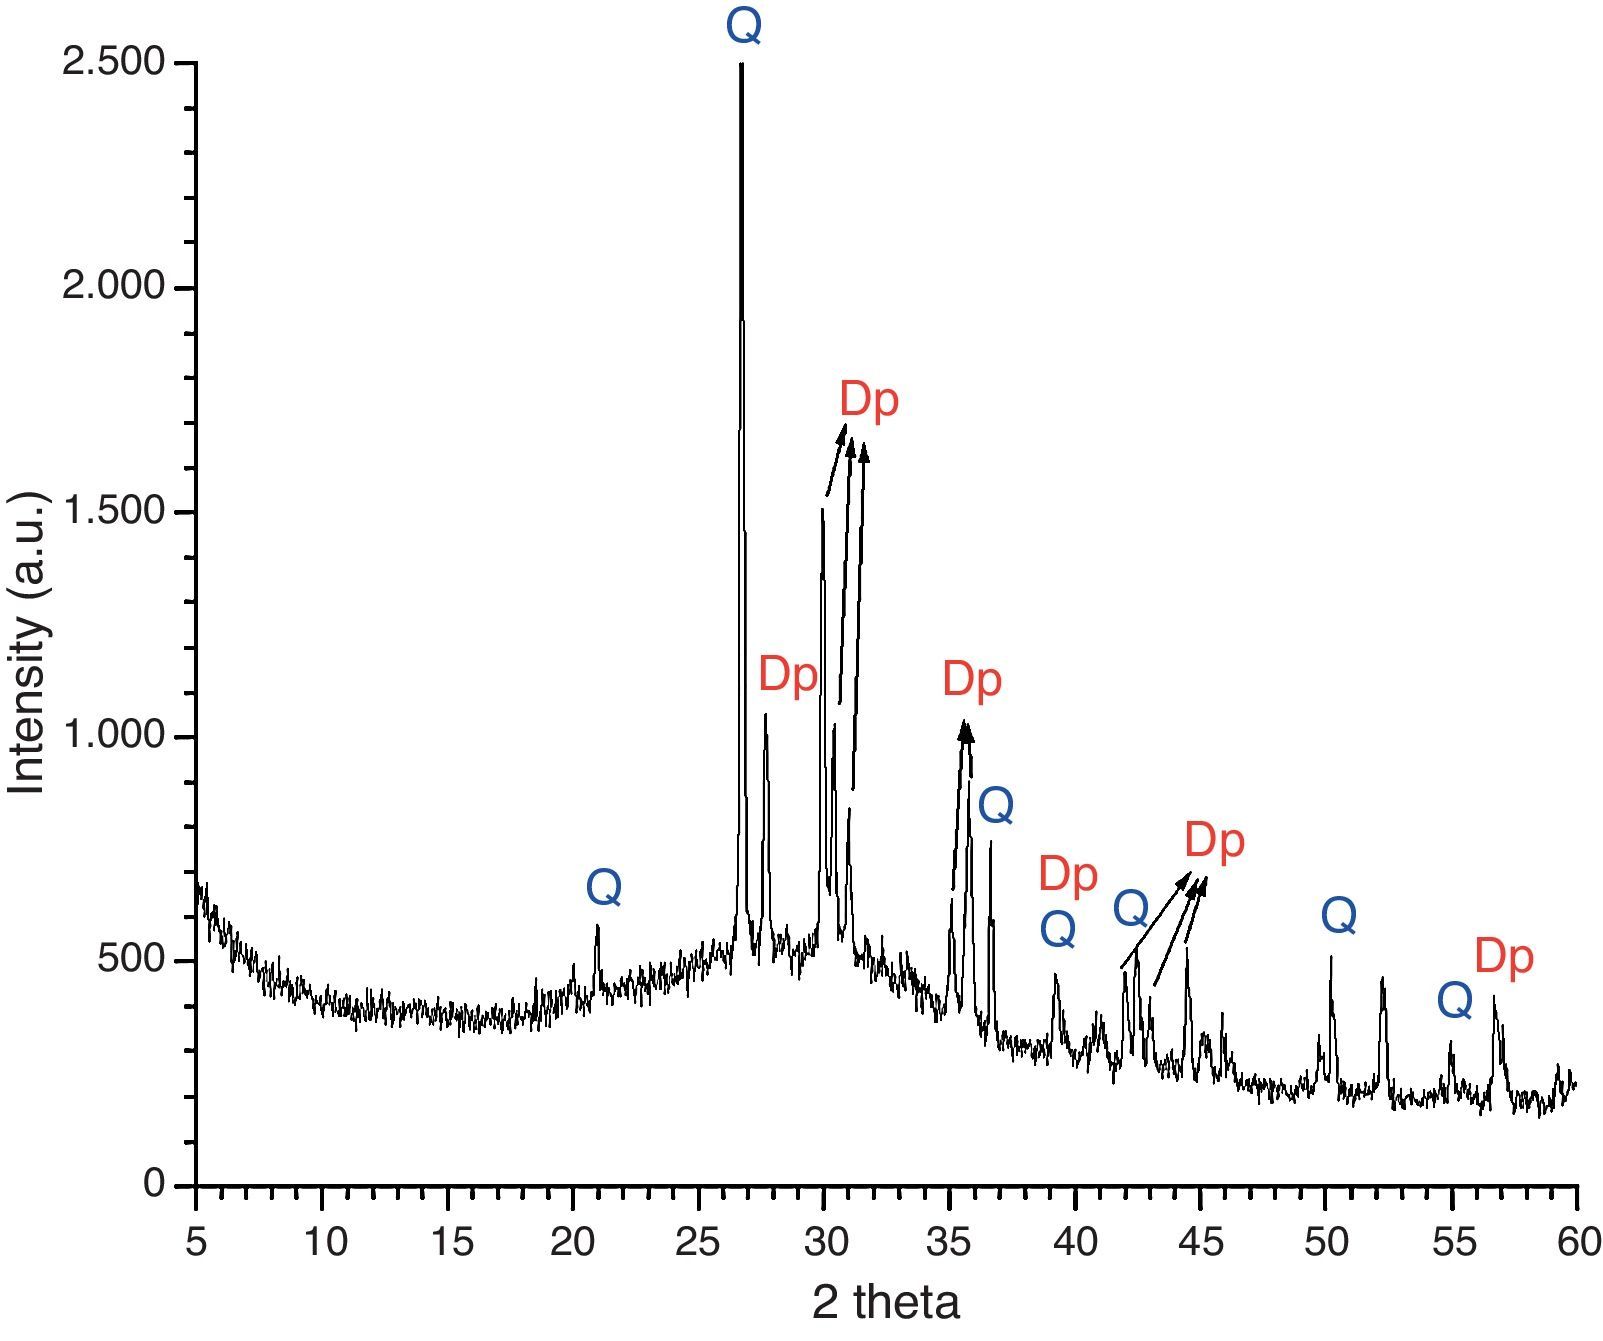
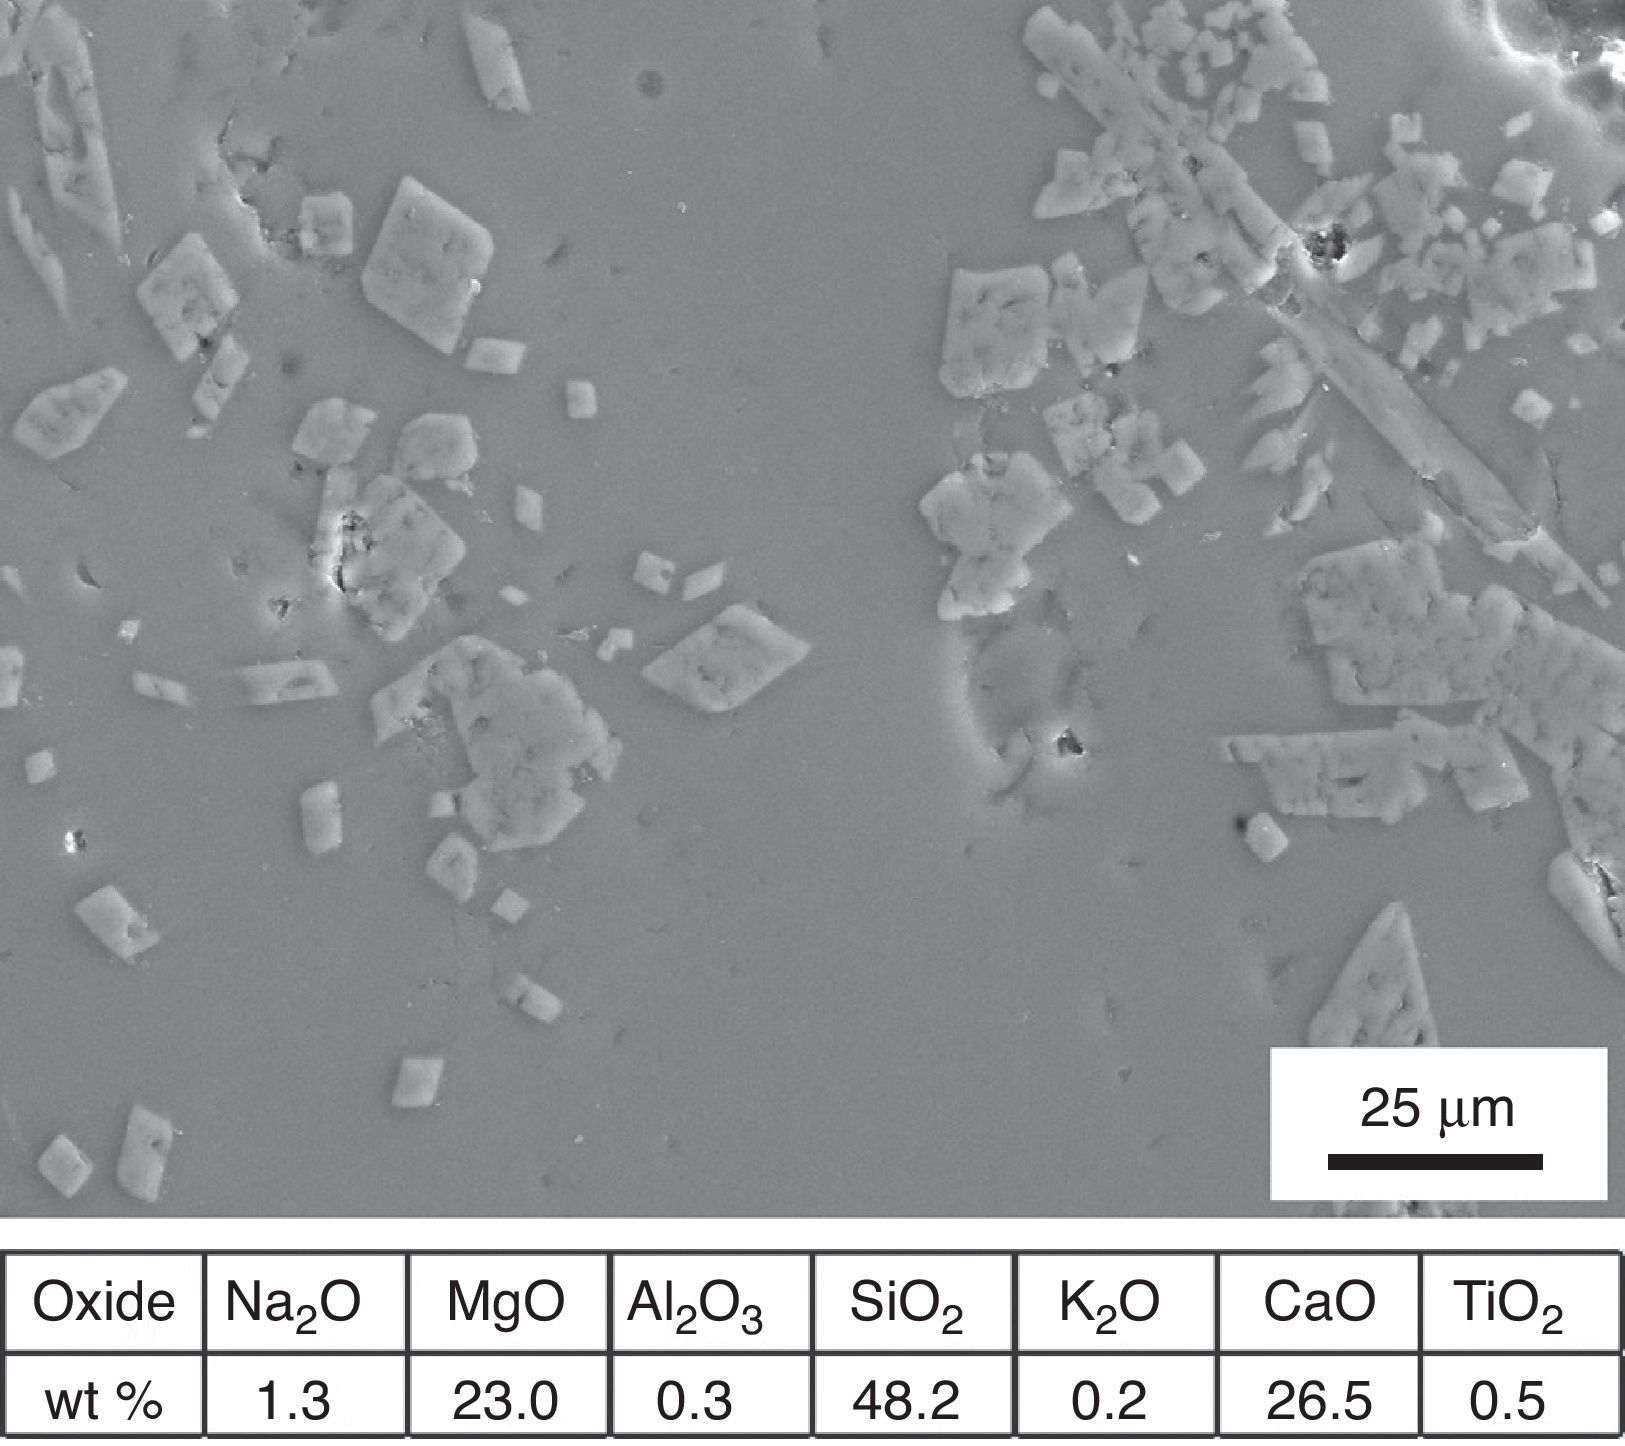
An overall consideration of binocular microscope observations and results of EDS analyses of samples KO-1 and KO-3 poses the question of clarifying whether or not the black opaque and/or the grained surfaces correspond to a true glass. To answer such question, a small portion of the rear side of the sample KO-1 was grounded and analysed by XRD. The corresponding diffraction pattern is shown in Fig. 7. Reflections assigned to diopside (Dp) and quartz (Q) phases were detected, together with a wide diffuse shoulder over the 2θ=20–40° range, due to the presence of a glassy matrix. In fact, crystals were detected by EDS spectrometry in the glassy matrix whose microanalysis indicates a stoichiometry near the diopside (Fig. 8). Such microcrystals could be responsible for the grained appearance of both KO-1 (brown area) and KO-3 samples, in which the characteristic glassy brightness is not clearly observed. Furthermore, to confirm the glassy nature of these samples and with the aim to reproduce the diopside crystallisation, some melting tests were carried out from a batch prepared according to the composition of sample KO-1 (Table 2). One melting process was undertaken with a small batch amount at 1100°C under a reducing atmosphere, as the most probable attainable temperature. The result can be observed in Fig. 5A. At this temperature the batch has not reached a complete melting and the partial melted material looks like the rear side of the sample KO-1. However, when the melting process is carried out at a higher temperature (1400°C), the result is a glass totally melted, showing the characteristic glassy brightness (Fig. 5B), similarly as in the other melting experiments whose results are shown in Fig. 5C and D. Taking into account that 1400°C is a temperature which was practically impossible to reach by the technology of the sixth century BC, it could be concluded that the brown area of the KO-1 sample consists on a partial melted soda lime silicate glass. In addition, the XRD pattern obtained in the sample melted at 1100°C, showed the presence of quartz and cristobalite but not diopside. Some other melting tests were carried out under oxidising atmosphere at 1100°C and 1400°C and further quenching. In both cases quartz and cristobalite were detected by XRD. When the experiment was undertaken at 1100°C under oxidising atmosphere and further slow cooling and heat treatment at 950°C for 2h, diopside and cristobalite were detected. Therefore, glasses of samples KO-1 and KO-3 were probably melted below 1100°C and re-heated/annealed during the decoration process, which caused the partial devitrification of diopside and quartz from the glassy matrix.


All the samples studied can be assimilated to soda lime glasses in which variable percentages of (mainly) MgO allows their classification as high magnesium glasses (HMG) (brown area of the sample KO-1 and the KO-3 sample) or low magnesium glasses (LMG) (samples KO-2, KO-4, ST-1, AL-1, AL-2, AL-3 and other areas of the sample KO-1). This implies that not all the glass beads were produced according to the same technology pattern: some of them were obtained from plant ashes as source of alkaline components (HMG), and the other were probably obtained from mineral natron (LMG). As far as sample KO-4 concern, its production technology was quite different as deduced from its morphology, deterioration signs and composition. The two black beads are similar and consist of partially melted glass, while the other are made of true melted glasses.
In regarding to chromophores, black, green, greenish and yellowish colours are due to the redox pair Fe3+/Fe2+; the turquoise colour to Cu2+-ions; the white opaque appearance in samples KO-1, KO-2 and ST-1 to the combination of tin and lead oxides, while the white decoration of samples AL-1, AL-1 and AL-3 is due to inclusions of calcium and antimony oxides; the deep blue colour in samples ST-1, AL-1, AL-2 and AL-3 is assigned to the combination of iron, copper and cobalt ions, even though Co2+-ions, due to its very high extinction coefficient, mask the contribution from iron and copper ions; and the opaque yellow colour of samples AL-1, AL-2 and AL-3 to the presence of inclusions containing lead and antimony oxides.
As far as the conservation state is concerned, all the beads show a variety of deterioration signs, mainly surface dealkalinisation, pits, mechanical damages of different depth and extent, and fine cracked morphology. All of these pathologies are consistent with the burial conditions in which they were conserved. Those samples found in extremely wet burial environments showed serious surface dealkalinisation.
The beads KO-1 and KO-3 could be assimilated to a European (Scythian?) imitation of glass beads from the Near East and Egypt, since they cannot be considered as true melted glasses. The beads KO-2, ST-1, AL-1, AL-2 and AL-3 correspond to typical LMG soda lime glasses, which probably came from the Greek Pontic colonies, Near East or Egypt, while the bead KO-4 could be assimilated to a typical composition of a Roman glass from a later period.
FundingBilateral projects PAN-CSIC (refs. 2008PL0012 and 2010PL0003).
The authors are indebted to the partial financing of bilateral projects PAN-CSIC (refs. 2008PL0012 and 2010PL0003). Likewise, the authors wish to mention the professional support of the TechnoHeritage network of Science and Technology for the Conservation of Cultural Heritage.

