


Diagnosing asthma in children is a challenge and using a single biomarker from exhaled breath condensate (EBC) showed the lack of improvement in it.
ObjectiveThe aim of this study was to assess the diagnostic potential of a pattern of simple chemical biomarkers from EBC in diagnosing asthma in children in a real-life setting, its association with lung function and gastroesophageal reflux disease (GERD).
MethodsIn 75 consecutive children aged 5–7 years with asthma-like symptoms the following tests were performed: skin prick tests, spirometry, impulse oscillometry (IOS), exhaled NO (FENO), 24-hour oesophageal pH monitoring and EBC collection with subsequent analysis of pH, carbon dioxide tension, oxygen tension, and concentrations of magnesium, calcium, iron and urates.
ResultsNo significant differences were found for individual EBC biomarkers between asthmatics and non-asthmatics (p>0.05 for all). A pattern of six EBC biomarkers showed a statistically significant (p=0.046) predictive model for asthma (AUC=0.698, PPV=84.2%, NPV=38.9%). None to moderate association (R2 up to 0.43) between EBC biomarkers and lung function measures and FENO was found, with IOS parameters showing the best association with EBC biomarkers. A significantly higher EBC Fe was found in children with asthma and GERD compared to asthmatics without GERD (p=0.049).
ConclusionsAn approach that involves a pattern of EBC biomarkers had a better diagnostic accuracy for asthma in children in real-life settings compared to a single one. Poor to moderate association of EBC biomarkers with lung function suggests a complementary value of EBC analysis for asthma diagnosis in children.
Asthma in children is a common and heterogeneous disorder with different phenotypes and endotypes that affects 1–18% of the population with considerable variability among countries.1,2 Documenting reversible airflow obstruction, allergen sensitisation, elevated serum IgE or blood eosinophilia is helpful in establishing a diagnosis of asthma in children, if present; however, the diagnosis is most often based on symptom patterns, and therapeutic response according to GINA recommendation.3 Furthermore, diagnosis of asthma in preschoolers is complicated due to poor cooperation during lung function tests with a significant age-related effect.4,5 Presence of co-morbidities represents an additional diagnostic challenge associated with a decrease in specificity of diagnostic tests used.6 Major problems associated with asthma research are complex pathophysiological mechanisms, significant interaction with environmental factors and the absence of single method or parameter to recognise asthma unambiguously.7
The development of new diagnostic tools in recent years, such as exhaled nitric oxide, capnovolumetry and the identification of biomarkers from exhaled breath condensate (EBC) have helped distinguish asthma from other lung disorders or comorbidities, such as GERD. EBC represents a non-invasive diagnostic sampling method that can be used to conveniently and non-invasively collect a wide range of volatile and non-volatile compounds coming from the respiratory tract, without affecting airway function or inflammation.8 For this study we selected several, simple to determine EBC biomarkers (pH, PCO2, PO2, magnesium, calcium, iron and urates) with the aim to possibly improve the sensitivity and specificity of diagnosing asthma in children. Researchers from our team had already investigated these EBC biomarkers separately to demonstrate changes of different metabolites collected via EBC in asthmatic children as well as in children with GERD.9–11 These markers were chosen because they have a proven role in airway reactivity and inflammation (pH, Mg, Ca), changes of a breathing pattern (PCO2, PO2), represent a major antioxidant in respiratory lining fluid (urates), a marker of airway injury (Fe), and a marker of endogenous and/or exogenous acidic stress (pH).10–13 Although these biomarkers are not exclusively specific for asthma, they correlate with pathophysiological processes of chronic inflammation in asthma with or without comorbidities. Using a biomarker pattern instead of a single biomarker has an advantage in improving diagnostic accuracy when a reflection of the complex pathophysiology is needed.14
The aim of our study was to assess the diagnostic potential of a pattern of simple chemical biomarkers from EBC in diagnosing asthma in children (referred to us with a mild to moderate pre-test probability for asthma), its association with lung function, and to assess the effect of gastroesophageal reflux disease (GERD), as one of the main comorbidities in asthmatic children, on EBC biomarkers in a real-life setting.
MethodsStudy populationOne hundred consecutive children aged 5–7 years with asthma-like symptoms were referred to our outpatient clinic by their primary care physicians. The reason for referral was additional diagnostic workout, to establish a diagnosis and prescribe appropriate treatment. As the prevalence of asthma in general population of that age group in Croatia is 6–10%, in this selected population with suggestive symptoms of asthma a mild to moderate [30–50%] pre-test probability for asthma was assumed.
The study was approved by the Hospital and the Faculty of Medicine Ethics Committees. Informed consent was obtained from parents of all children.
Exclusion criteria were: (1) acute or chronic respiratory infection; (2) systemic diseases affecting diagnostic tests; (3) children treated with inhaled or systemic corticosteroids during the eight weeks prior to visit; (4) children treated with any other medications during the two weeks prior to visit, excluding salbutamol prn. Treatment was excluded because of the referral to a diagnostic workout according to the in-house standard operational procedure (in vivo allergy testing, lung function, inflammatory markers). Exclusions (n=25) were based on medical history, clinical examination, fever and results of laboratory tests (C-reactive protein (CRP), white blood cell (WBC) count. The diagnosis of asthma was made independently by two paediatricians (asthma specialists) according to the criteria of GINA/ATS guidelines blinded for the results of EBC analysis.3 As part of a routine diagnostic procedure the bronchodilator response was measured in all patients and positive results were used as supporting evidence for the diagnosis of asthma. In the case of a disagreement between the two paediatricians about the diagnosis of asthma a consensus was made after additional review of the medical documentation by both of them together.
In patients with suspect (based on medical history and clinical examination) pathological gastroesophageal reflux (GER) (n=70), a 24-hour oesophageal pH-monitoring was performed.15
Skin prick testingSkin prick tests (SPT) were performed with 10 common aeroallergens; Dermatophagoides pteronyssinus (Der.pt.) and Dermatophagoides farinae (Der.f.), cat and dog dander, Dactylis glomerata, Artemisia vulgaris, Ambrosia elatior, Corylus avellana, Betula verrucosa, and Cladosporium, with histamine dihydrochloride (10mg/mL) as the positive, and saline as the negative control (Stallergenes, France). The reactions were assessed after 15min, the wheal size was measured in millimetres in two perpendicular directions including the longest diameter, with their mean recorded as the response. Mean wheal diameter ≥3mm greater than the negative control was considered as a positive test.16
Lung function testsSpirometrySpirometry was performed in upright sitting position using a spirometer (Ganzhorn, Germany) according to ATS/ERS standards.17 Best forced vital capacity (FVC) manoeuvre was interpreted using FVC, forced expiratory volume in one second (FEV1), peak expiratory flow (PEF), maximal expiratory flows at 50% and 25% of FVC (MEF50, MEF25), and expressed as percent of predicted according to Quanjer.17,18 The bronchodilator response was measured 20min after the inhalation of 200–400μg of salbutamol (depending on the body weight of patient).
Impulse oscillometryJaeger MasterScreen IOS (Viasys Healthcare, Inc., Yorba Linda, USA) was used for the measurements of respiratory impedance according to ERS/ATS recommendations and the following IOS data were collected: resistance of the respiratory system at 5Hz (R5) and 20Hz (R20) and reactance at 5Hz (X5).19 Results were analysed as absolute values (abs) and as percentages of predicted values (%) according to Nowowiejska et al.20
Measurement of exhaled NOFraction of exhaled nitric oxide (FENO) was measured using a chemiluminescence analyser (NIOX analyzer, Aerocrine, Sweden) during a single-breath exhalation according to the ERS/ATS recommendations at a flow rate of 50mL/s.21
Exhaled breath condensate collection and analysesEBC was collected using an EcoScreen condenser (Erich Jaeger GmbH, Hoechberg, Germany). The subjects were instructed to breathe tidally for 15min, wearing a nose clip, according to ATS/ERS recommendations.22 Obtained condensate samples were deaerated using argon immediately after collection. The following parameters were analysed within 5min after argon deaeration: pH, carbon dioxide tension (PCO2), oxygen tension (PO2) (Ecosys II TM, Eschweiler, Kiel, Germany). The rest of the sample was frozen at −70°C for later analysis of the following parameters: the concentrations of magnesium, calcium, iron and urates (Olympus, Tokyo, Japan). Catalytic activity of α-amylase was also measured to exclude contamination with saliva. To maintain the highest standards of quality assurance and reliability of diagnostics, our laboratory is certified according to ISO 9001.
24-Hour oesophageal pH-probeTwenty-four-hour oesophageal pH studies were performed using portable digital recorders (POLYGRAM NET™ pH Testing Application, Medtronic A/S), an antimony catheter and an outer electrode. The probe was calibrated using buffered solutions of pH 7.0 and 1.0 prior to insertion. Tests were performed after 6h of fasting, introducing the catheter through the nostril and placed 3–4cm above the gastroesophageal junction (confirmed by chest radiography). After 24h, the data was downloaded onto a computer using Medtronic software. The variables assessed for gastroesophageal reflux were the total percentage of time with pH <4.0, the number of episodes with pH <4.0 with the calculation of DeMeester and Boix-Ochoa composite scores. Reflux index >4was considered abnormal.
Statistical analysisContinuous variables were presented as mean and standard deviation (SD) and categorical as absolute and relative frequencies (%). Comparisons of continuous variables between subgroups were made using Student's t-test or Mann–Whitney U-test (depending on the distribution). Regression analysis and canonical correlation were used to assess the associations between variables. Discriminant analysis was used to determine predictive variables for diagnosing asthma. Receiver operator curve (ROC) analysis was done to assess boundary values, sensitivity, specificity, and accuracy of predictive models (with 95% confidence intervals [CI]). The following parameters were calculated: area under curve (AUC), positive predictive value (PPV), negative predictive value (NPV), diagnostic accuracy (DA), likelihood ratios (LR) and diagnostic odds (DO). The sample size was defined at 100 to allow enough subjects for diagnostic accuracy to be calculated (ROC analysis) with enough precision, based on multivariate analysis with expected R2=0.2, 7 independent variables, α=0.05 and statistical power of 0.9 with a calculated sample size of 84 subjects. p<0.05 was considered statistically significant for all tests performed. The analysis was performed using STATISTICA, version 10 (StatSoft Inc., Tulsa, OK, USA).
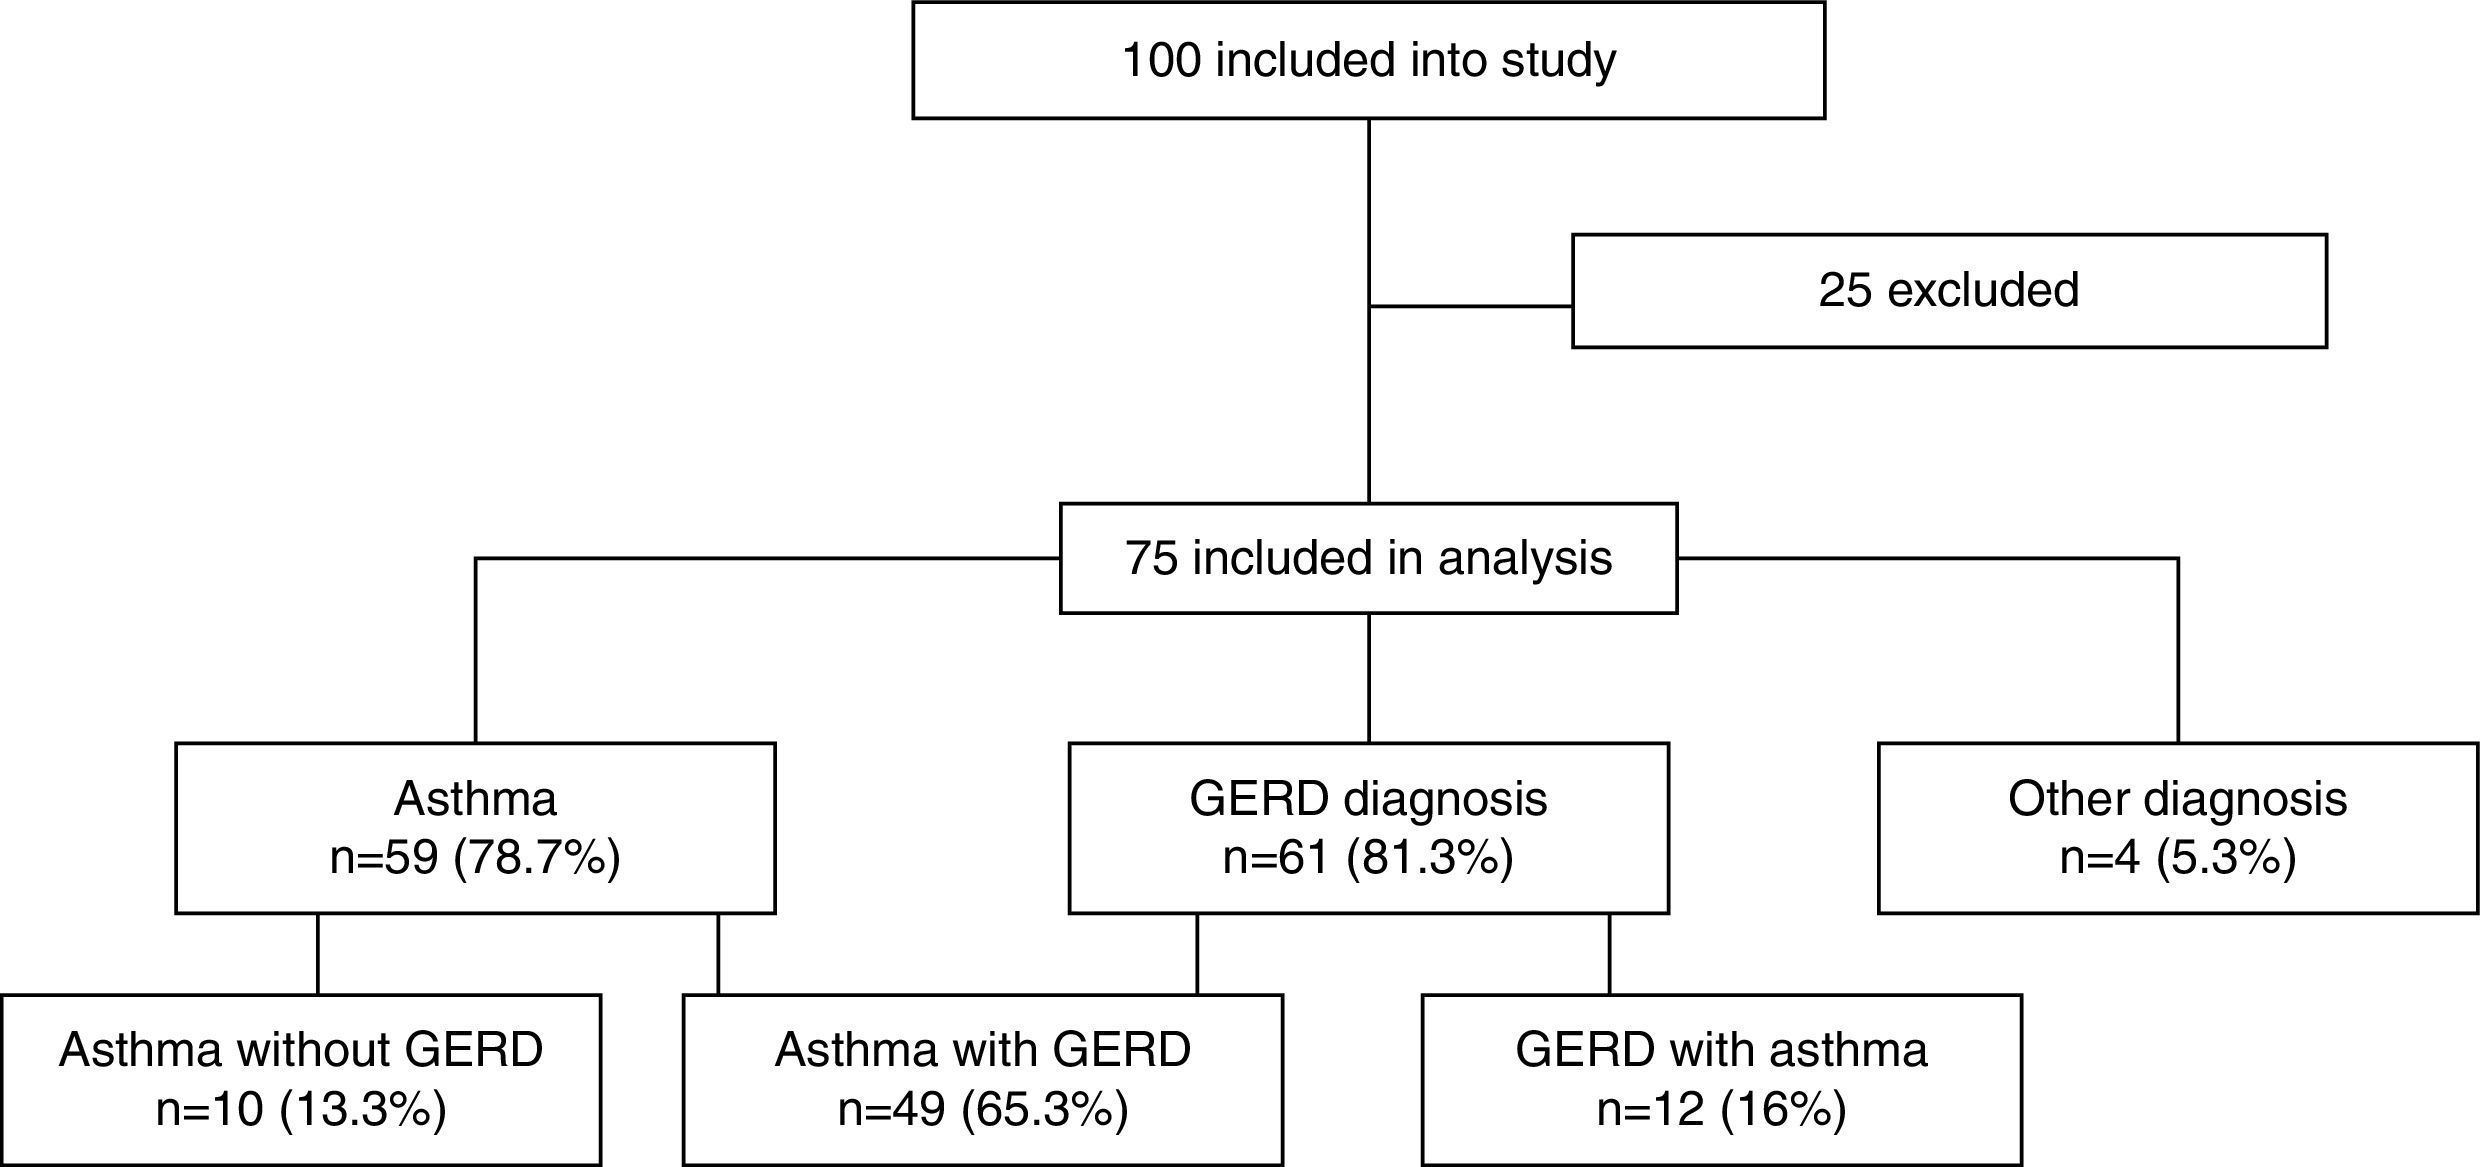
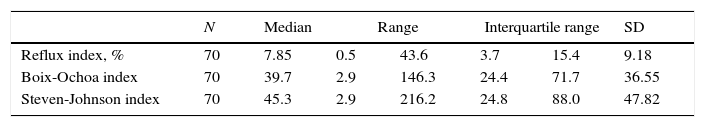
ResultsOut of 100 consecutively referred children (with mild to moderate pre-test probability for asthma), 75 children were included into the study (25 were excluded based on exclusion criteria). Mean age of included children was 6.5 years (range, 5–7 years) of which 41 (54.7%) were boys. Flow of the subjects through the study is given in Fig. 1. The most prevalent signs and symptoms were cough (66/75), followed by dyspnoea (34/75), exercise intolerance (22/75), wheeze (16/75) and chest tightness (5/75). Forty-one (out of 75) patients presented with signs and symptoms of rhinosinusitis, 14 with laryngitis and nine with productive cough. Thirty-six patients were sensitised to house dust mites, five to cat dander, 19 to grass, 29 to weed and 15 to tree pollen, and two to moulds. Out of 75 patients, 35 were not sensitised, five were mono-sensitised, 14 were double-sensitised and 21 were polysensitised. Results of 24-hours pH-monitoring are presented in Table 1.

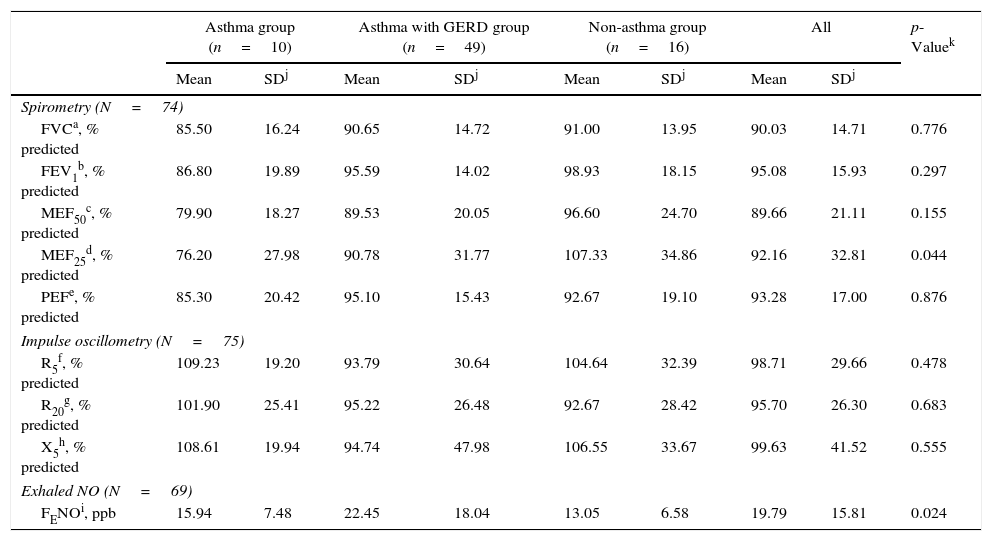
Results of lung function measurements are listed in Table 2. On average the results of spirometry and impulse oscillometry of studied participants were within the normal range.
Lung function measurements and exhaled NO measurements of studied participants.
| Asthma group (n=10) | Asthma with GERD group (n=49) | Non-asthma group (n=16) | All | p-Valuek | |||||
|---|---|---|---|---|---|---|---|---|---|
| Mean | SDj | Mean | SDj | Mean | SDj | Mean | SDj | ||
| Spirometry (N=74) | |||||||||
| FVCa, % predicted | 85.50 | 16.24 | 90.65 | 14.72 | 91.00 | 13.95 | 90.03 | 14.71 | 0.776 |
| FEV1b, % predicted | 86.80 | 19.89 | 95.59 | 14.02 | 98.93 | 18.15 | 95.08 | 15.93 | 0.297 |
| MEF50c, % predicted | 79.90 | 18.27 | 89.53 | 20.05 | 96.60 | 24.70 | 89.66 | 21.11 | 0.155 |
| MEF25d, % predicted | 76.20 | 27.98 | 90.78 | 31.77 | 107.33 | 34.86 | 92.16 | 32.81 | 0.044 |
| PEFe, % predicted | 85.30 | 20.42 | 95.10 | 15.43 | 92.67 | 19.10 | 93.28 | 17.00 | 0.876 |
| Impulse oscillometry (N=75) | |||||||||
| R5f, % predicted | 109.23 | 19.20 | 93.79 | 30.64 | 104.64 | 32.39 | 98.71 | 29.66 | 0.478 |
| R20g, % predicted | 101.90 | 25.41 | 95.22 | 26.48 | 92.67 | 28.42 | 95.70 | 26.30 | 0.683 |
| X5h, % predicted | 108.61 | 19.94 | 94.74 | 47.98 | 106.55 | 33.67 | 99.63 | 41.52 | 0.555 |
| Exhaled NO (N=69) | |||||||||
| FENOi, ppb | 15.94 | 7.48 | 22.45 | 18.04 | 13.05 | 6.58 | 19.79 | 15.81 | 0.024 |
Thirty-two percent of the children (24/74) had values below the lower limit of normal for one or more spirometric parameters. Comparable results were found using impulse oscillometry with 27% of children (20/75) having values beyond the normal limits for one or more parameters. The only significant differences for the lung function parameters between the asthmatic and non-asthmatic group were found for MEF25 (88.31% vs. 107.33% predicted, p=0.044). FENO values were within normal range in 61% of children (46/69) and significantly different between asthmatic and non-asthmatic group (21.50ppb vs. 13.05ppb, p=0.024).
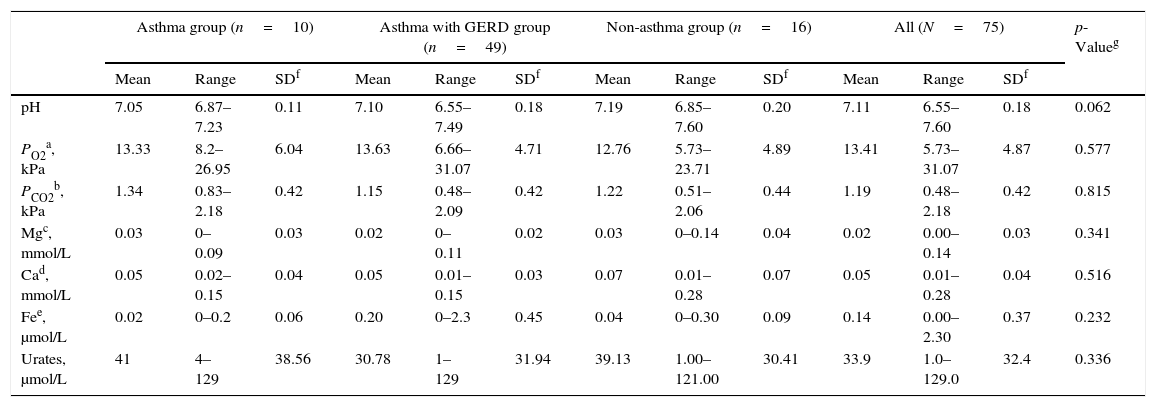
EBC biomarkersThe results for the EBC biomarkers are shown in Table 3. Single EBC biomarkers have not shown a significant difference between asthmatic and non-asthmatic children (p>0.05 for all).
EBC biomarker measurements of studied participants.
| Asthma group (n=10) | Asthma with GERD group (n=49) | Non-asthma group (n=16) | All (N=75) | p-Valueg | |||||||||
|---|---|---|---|---|---|---|---|---|---|---|---|---|---|
| Mean | Range | SDf | Mean | Range | SDf | Mean | Range | SDf | Mean | Range | SDf | ||
| pH | 7.05 | 6.87–7.23 | 0.11 | 7.10 | 6.55–7.49 | 0.18 | 7.19 | 6.85–7.60 | 0.20 | 7.11 | 6.55–7.60 | 0.18 | 0.062 |
| PO2a, kPa | 13.33 | 8.2–26.95 | 6.04 | 13.63 | 6.66–31.07 | 4.71 | 12.76 | 5.73–23.71 | 4.89 | 13.41 | 5.73–31.07 | 4.87 | 0.577 |
| PCO2b, kPa | 1.34 | 0.83–2.18 | 0.42 | 1.15 | 0.48–2.09 | 0.42 | 1.22 | 0.51–2.06 | 0.44 | 1.19 | 0.48–2.18 | 0.42 | 0.815 |
| Mgc, mmol/L | 0.03 | 0–0.09 | 0.03 | 0.02 | 0–0.11 | 0.02 | 0.03 | 0–0.14 | 0.04 | 0.02 | 0.00–0.14 | 0.03 | 0.341 |
| Cad, mmol/L | 0.05 | 0.02–0.15 | 0.04 | 0.05 | 0.01–0.15 | 0.03 | 0.07 | 0.01–0.28 | 0.07 | 0.05 | 0.01–0.28 | 0.04 | 0.516 |
| Fee, μmol/L | 0.02 | 0–0.2 | 0.06 | 0.20 | 0–2.3 | 0.45 | 0.04 | 0–0.30 | 0.09 | 0.14 | 0.00–2.30 | 0.37 | 0.232 |
| Urates, μmol/L | 41 | 4–129 | 38.56 | 30.78 | 1–129 | 31.94 | 39.13 | 1.00–121.00 | 30.41 | 33.9 | 1.0–129.0 | 32.4 | 0.336 |
We found a poor association between spirometric parameters and investigated EBC biomarkers. Significant univariate correlation was found only between EBC Mg and MEF50 (r=0.237, p=0.042). Also, no significant correlation was found between the set of spirometric variables (FVC, FEV1, MEF50, MEF25, and PEF) and a set of EBC biomarkers (pH, PO2, PCO2, Mg, Ca, Fe, and urates; canonical R=0.534, χ2=44.698, p=0.126).
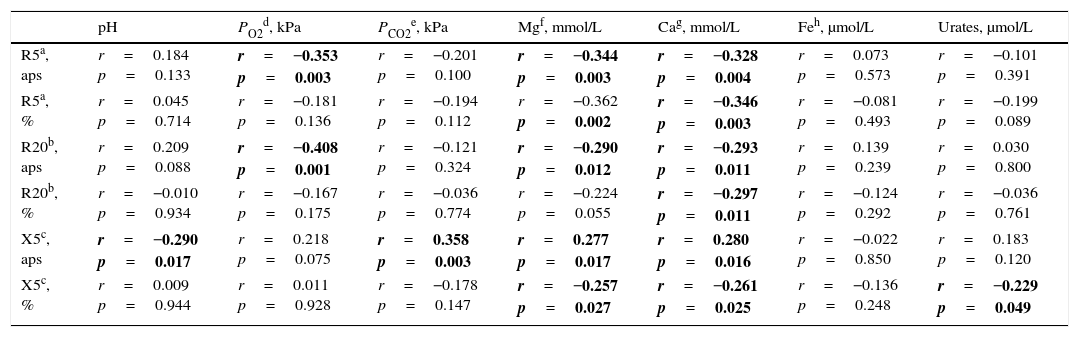
In contrast to spirometric parameters, all IOS parameters were significantly associated with at least one of investigated EBC biomarkers, with the exception of EBC Fe (Table 4). Significant correlation between the set of IOS variables (R5, R20, X5) and a set of investigated EBC biomarkers (canonical R=0.658, χ2=39.691, p=0.032) was also found.
Correlation between EBC biomarkers and impulse oscillometry parameters.
| pH | PO2d, kPa | PCO2e, kPa | Mgf, mmol/L | Cag, mmol/L | Feh, μmol/L | Urates, μmol/L | |
|---|---|---|---|---|---|---|---|
| R5a, aps | r=0.184 p=0.133 | r=−0.353 p=0.003 | r=−0.201 p=0.100 | r=−0.344 p=0.003 | r=−0.328 p=0.004 | r=0.073 p=0.573 | r=−0.101 p=0.391 |
| R5a, % | r=0.045 p=0.714 | r=−0.181 p=0.136 | r=−0.194 p=0.112 | r=−0.362 p=0.002 | r=−0.346 p=0.003 | r=−0.081 p=0.493 | r=−0.199 p=0.089 |
| R20b, aps | r=0.209 p=0.088 | r=−0.408 p=0.001 | r=−0.121 p=0.324 | r=−0.290 p=0.012 | r=−0.293 p=0.011 | r=0.139 p=0.239 | r=0.030 p=0.800 |
| R20b, % | r=−0.010 p=0.934 | r=−0.167 p=0.175 | r=−0.036 p=0.774 | r=−0.224 p=0.055 | r=−0.297 p=0.011 | r=−0.124 p=0.292 | r=−0.036 p=0.761 |
| X5c, aps | r=−0.290 p=0.017 | r=0.218 p=0.075 | r=0.358 p=0.003 | r=0.277 p=0.017 | r=0.280 p=0.016 | r=−0.022 p=0.850 | r=0.183 p=0.120 |
| X5c, % | r=0.009 p=0.944 | r=0.011 p=0.928 | r=−0.178 p=0.147 | r=−0.257 p=0.027 | r=−0.261 p=0.025 | r=−0.136 p=0.248 | r=−0.229 p=0.049 |
Bold values are statistically significant at p<0.05.
No significant association was found between investigated EBC biomarkers and FENO.
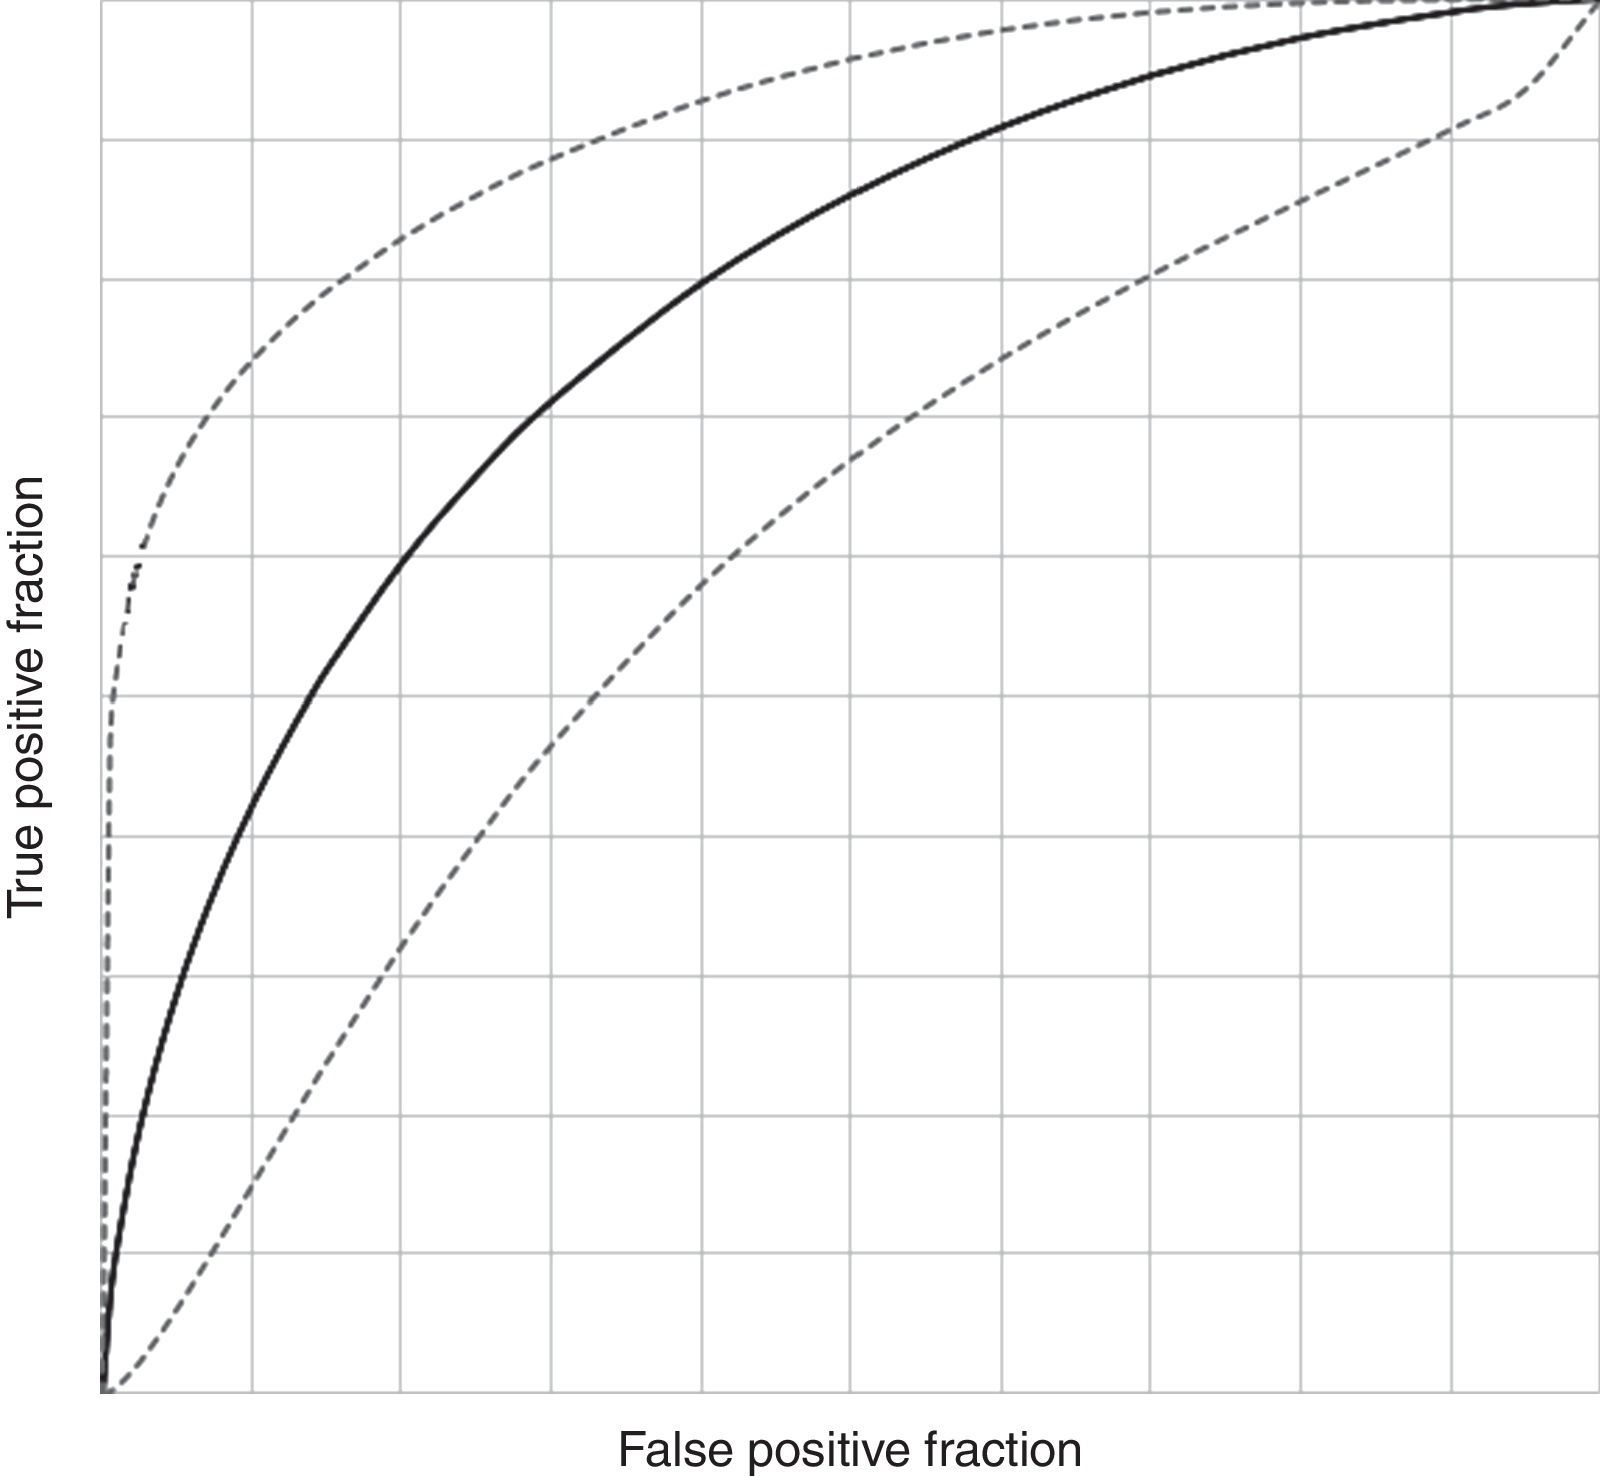
Diagnostic potential of investigated EBC biomarkersDiscriminant analysis yielded the best EBC predictive model for the diagnosis of asthma in children aged 5–7 years based on six of the investigated EBC biomarkers (pH, PO2, PCO2, Mg, Fe and urates; canonical R=0.432; Willk's lambda=0.813, χ2=12.833, df=6, p=0.046, stepwise discriminant analysis). ROC curve analysis of this model showed an AUC of 0.698 (95% CI, 0.526–0.838) with a sensitivity of 81.36% (95% CI, 69.62–89.26%), specificity of 43.75% (95% CI, 23.10–66.82%), PPV 84.21% (95% CI, 72.64–91.46%), NPV 38.89% (95% CI, 20.30–61.38%), DA of 73.33% (95% CI, 62.37–82.02%), LR for a diagnosis with a positive test of 1.446 (95% CI, 1.152–1.815) and LR for refusing a diagnosis with a negative test of 0.426 (95% CI, 0.249–0.730), with a DO of 3.394 (95% CI, 1.037–11.1) (Fig. 2). The model showed mild significant agreement with the diagnosis of asthma (Kappa=0.240; 95% CI, 0.015–0.466; p=0.019).
EBC in GERD and asthma curve for diagnosis of asthma fitted to EBC markers data (pH, PO2, PCO2, Mg, Fe and urates) using the binominal model; grey dotted lines represent 95% confidence intervals.")
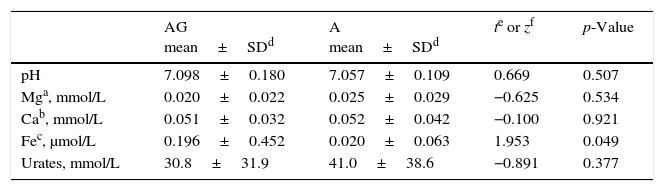
It can be seen (Table 5) that only EBC Fe showed significantly different (higher) values in children with asthma and GERD compared to asthmatics without GERD (0.196μmol/L vs. 0.020μmol/L, p=0.049).
Comparison of individual EBC biomarkers in children with asthma and GERD (AG, n=49) and asthmatic children without GERD (A, n=10).
During the last decade research of EBC biomarkers had led to novel observations about the pathophysiology in various respiratory disorders, especially asthma in the paediatric population.
The results of our study show that there was a significant overlap of the levels of single analysed EBC biomarkers (pH, magnesium, calcium, iron and urates) between asthmatic children and other subjects with chronic respiratory symptoms suggestive for asthma. It has to be emphasised that our study population constitutes an unselected group of children with chronic respiratory complaints. This was done intentionally to provide a more accurate assessment of these EBC biomarkers in a routine clinical setting. We selected a pattern of simple chemical biomarkers (metabolites) based on their role in physiology and pathophysiology of airway disorders and asthma. EBC pH is a reliable non-invasive marker for assessing ongoing airway inflammation and response to treatment.23 In capnovolumetry, the expiratory CO2 concentration during tidal breathing is used to diagnose airways limitation.12,13 Magnesium action on bronchial smooth muscle relaxation has been demonstrated in in vitro24 and in vivo25 studies being consistent with its function as a calcium antagonist that acts as a bronchoconstrictor.26 It appears that, besides its bronchodilatory action, magnesium is also involved in inflammatory processes27 and oxidative stress.28 The study done by Banovic et al.11 showed that decreased total magnesium concentration may be found in EBC, irrespective of whether the acidification is the result of endogenous pathomechanisms or GER-induced mechanisms. Calcium, as a physiologic magnesium antagonist is an important activator of airway smooth muscle contraction, being also involved in airway remodelling.29 Pro-oxidant iron provides a potential measure of oxidative stress in biological fluids. In asthma, disease severity and environmental exposure influenced levels of pro-oxidant iron measured in EBC indicating a potential for enhanced iron-catalysed oxidative stress.30 Urates represent a strong reducing agent, electron donor and antioxidant, bind pro-oxidant metals (i.e. iron)31 and may stabilise another powerful antioxidant, ascorbic acid.32 Increased concentration of urates in plasma seems to be a marker of oxidative stress.9
In contrast to the single EBC biomarker analysis and their diagnostic potential, a pattern of six simple EBC biomarkers (pH, PO2, PCO2, Mg, Fe and urates) showed a statistically significant (p=0.046) predictive model for asthma (AUC=0.698, PPV=84.2%, NPV=38.9%). Based on these results we can conclude that an approach involving a pattern of EBC biomarkers (similar to electronic nose model) would do better than using one single (specific) marker.33 Regardless of its statistical significance, this model still lacks specificity (43.8%) and has a low NPV, similar to some other biological methods used independently for diagnosing asthma. This could probably be improved by adding additional simple, relatively inexpensive biochemical markers (i.e. pro-inflammatory cytokines) to the analysis thus increasing specificity for asthma. Also new emerging analytical methods (nuclear magnetic resonance spectroscopy of EBC) will probably allow us the cheap and simple insight in EBC metabolomics profiling thus providing us with a significantly better diagnostic accuracy in future.34
Association testing between analysed EBC biomarkers and lung function measures in our study found none to moderate association (R2 up to 0.43). The weakest association was between EBC markers and FENO, while the strongest one was with IOS parameters. Precisely, EBC concentrations of Mg and Ca were significantly associated with all IOS parameters. A previous study35 showed that the magnesium to calcium ratio was a significantly better indicator in both GERD and asthma as compared to healthy subjects than the absolute concentrations of either ion, most probably because of a very close interaction of these two ions in (patho)physiological processes. EBC pH was significantly associated only with reactance (X5), a parameter that reflects a combination of volume, obstruction and elasticity of airways. EBC urates were significantly associated with airway resistance and reactance, possibly indicating a relationship with inflammatory events and oxidative stress in asthma that did not originate from allergic (eosinophilic) inflammation (no association with FENO). This was corroborated by a previous study by Vlašić et al.9 that showed that EBC urates were not significantly associated with parameters of sensitisation (allergy skin tests, IgE) and eosinophilic inflammation (FENO). On the other hand, a better association of analysed EBC biomarkers with IOS parameters than with spirometric ones could also be explained with higher sensitivity of IOS parameters for the pathophysiological changes in airways.
As GERD is a very common childhood asthma comorbidity that significantly affects asthma we wanted to assess the effect of GERD on analysed EBC biomarkers. Prevalence of GERD in our sample was high (81.3%) but was expected both from our clinical practice and from previously published datasets in whom prevalence ranged from 30 to 80%.36–38 There are at least two reasons for the high prevalence of GERD in the tested population. The first one is a tremendous change in lifestyle and nutrition during the last two decades with high prevalence of refined carbohydrates in a daily diet of children. The second one could come from the current clinical practice endorsed by the National Health Insurance Fund regarding diagnosis and management of asthma. In cases with high probability for the diagnosis of asthma (typical clinical presentation with no comorbid complications) the diagnosis and start of treatment should be done on the level of primary health care so these patients will not be referred to secondary or tertiary care for diagnosis. Thus an investigated population referred to our hospital (mild to moderate pre-test probability for asthma) might have a higher proportion of comorbid GERD. This is also the reason why it is so important to evaluate the method in a real clinical setup within an unselected population. Analysis of EBC biomarkers in our study in patients with asthma and comorbid GERD showed a significantly higher EBC Fe compared to asthmatics without GERD (0.196μmol/L vs. 0.020μmol/L; p=0.049). Thus an elevated (although not significantly) EBC Fe in all asthmatics could be adjudicated to a high prevalence of GERD in our sample showing how a comorbid disease could influence diagnostics. As measured levels of Fe in EBC was not significantly associated with any other diagnostic test parameter (lung function, FENO), this might indicate that it may reflect pathophysiological processes specific for asthma with comorbid GERD or GERD alone, probably due to the acute airways injury caused by an aspiration of acidic gastric content and consequent oxidative stress.10,30,39 This association deserves further research.
Limitations of our study were as follows: the lack of a “gold standard” for the diagnosis of asthma; preschool children as participants (six were not able to carry out a technically acceptable lung function measurement); lack of long-term follow-up to improve the accuracy of a clinical diagnosis; a necessary sample size was not reached because of large drop out from study. On the other hand, the advantages of this study were that the diagnosis of asthma was made by two experienced asthma specialists, and an unselected population of children with respiratory symptoms with mild to moderate pre-test probability of asthma and thus without previously established diagnosis by a primary care paediatrician. Thus a setup is comparable to a routine clinical setting.
At the end, the outcome of our study showed that an EBC pattern of very simple and low-cost biomarkers from a biological sample gathered by a simple, non-invasive method with no need for cooperation could have a significant advantage over a single diagnostic marker. Also, this approach shows complementary results to the standard diagnostic methods (lung function) used in asthma evident from a low biological association seen between EBC biomarkers and lung function and a discriminating power for comorbidities like GERD. Further research is needed to assess the role of these and other biomarkers in exhaled air to allow for the improvement of diagnosis and monitoring of asthma in children.
Ethical disclosuresProtection of human and animal subjectsThe authors declare that no experiments were performed on humans or animals for this investigation.
Confidentiality of dataThe authors declare that no patient data appears in this article.
Right to privacy and informed consentThe authors have obtained the informed consent of the patients and/or subjects mentioned in the article. The author for correspondence is in possession of this document.
Conflict of interestThe authors have no conflict of interest to declare.
