


Investigation of the geographic variation in asthma prevalence can improve our understanding of asthma etiology and management. The purpose of our investigation was to compare the prevalence of asthma and wheeze among adolescents living in two distinct international regions and to investigate reasons for observed differences.
MethodsA cross-sectional survey of 13–14 year olds was completed in Saskatoon, Canada (n=1200) and Skopje, Republic of Macedonia (n=3026), as part of the International Study of Asthma and Allergies in Childhood (ISAAC) Phase 3 study. Surveys were self-completed by students following the ISAAC protocol. Multiple logistic regression models were used to investigate associations with reports of asthma and current wheeze. A mediation analysis was then completed.
ResultsAsthma prevalence was much higher in Saskatoon than Skopje (21.3% vs. 1.7%) as was the prevalence of current wheeze (28.2% vs. 8.8%). Higher paracetamol (acetaminophen) use was a consistent risk factor for asthma and wheeze in both locations and showed dose-response relationships. In both countries, paracetamol use and physical activity mediated some of the association for both asthma and wheeze. In Saskatoon, among those with current wheeze, 42.6% reported ever having a diagnosis of asthma compared to 10.2% among Skopje adolescents.
ConclusionsThe results suggest that the variation in risk factors between the two locations may explain some of the differences in the prevalence of asthma and wheeze between these two study sites. However, diagnostic labeling patterns should not be ruled out as another potential explanatory factor.
International variation in childhood asthma prevalence has been shown with much of the work coming from the International Study of Asthma and Allergies in Childhood (ISAAC).1–3 Westernized regions such as North America, Australia, and Western Europe have reported relatively high rates of asthma prevalence while Eastern and Northern Europe have shown much lower prevalence.2 Variation in asthma prevalence has also been shown more regionally in such areas as Central and Eastern Europe.4,5
Potential explanations for the international variation in childhood asthma prevalence include differences in environment, personal characteristics, and health behaviors. Geographic differences in these factors and their relationship with respiratory health outcomes have been shown internationally4,6 and locally.7 While differences in diagnostic labeling between regions have been suggested,4,5 with evidence of asthma under-diagnosis,8 this explanation is not well investigated.
Improved the understanding of the geographic variation in asthma prevalence can assist in our knowledge of asthma etiology, while identifying differences in diagnostic labeling will allow these to be accounted for as we study other explanations of asthma etiology (e.g. environmental or health behavior). Because there have been increases in asthma prevalence within regions of previously low asthma prevalence,9 it is especially important to investigate the explanations for observed geographic differences to better predict and plan for potential increases that may occur with global westernization.
Our objectives were to: (1) determine if there is a difference in the prevalence of asthma or wheeze between two geographically distinct regions with potentially different environmental, health behavior, and health care service/diagnostic labeling patterns among 13–14 year olds; and (2) identify risk factors for asthma and wheeze and identify potential explanatory factors for observed differences in prevalence. We completed this using data from two participating regions of ISAAC Phase 3, one with low asthma prevalence (Skopje, Republic of Macedonia) and the other with high prevalence (Saskatoon, Canada), extending an established collaboration.10
Materials and methodsStudy design and locationThe ISAAC methodology is well described.1,11 In brief, ISAAC Phase 3 was a worldwide cross-sectional study using standardized methods.11 For the current analysis, we compared data from Saskatoon, Canada (completed in 2003) and Skopje, Republic of Macedonia (completed in 2002). Saskatoon (population approximately 220,00012) is in western Canada. These two locations were chosen based on a previous collaboration and common research interests from investigators in the two regions. The differences in asthma prevalence between the regions would allow for strong scientific comparisons of interest to the researchers. Skopje (population approximately 500,000 people13) is on the Balkan Peninsula in South Eastern Europe. Based on previous research, we suspected that these cities would vary greatly in asthma and wheeze prevalence, where Saskatoon and Skopje would be regions of high and low prevalence, respectively,10,14 making their selection ideal for this analysis. Also, both cities are large, in landlocked locations, and have agricultural areas surrounding them.
This study was approved by the Biomedical Research Ethics Board at the University of Saskatoon and the Ethics Committee at the Medical Faculty and The Ministry of Education and Science (Skopje). Participating schools approved of this study. In Saskatoon, active consent was required while in Skopje, passive consent was employed.
Study population and data collection protocolSelection of participants and data collection were performed in accordance with the ISAAC methodology.11 Due to differences in school enrollment, most high schools in Saskatoon (62 took part) and a random sample of primary schools in Skopje (17 took part) were recruited. Within each sampled school, all 13–14 year old children attending were eligible to participate. In Saskatoon, there were 1200 participants (53.7% response rate) compared to 3026 participants in Skopje (90.9% response rate).
Data were collected through a self-completed written questionnaire completed in class. The standardized ISAAC Phase 3 written questionnaires included information on asthma, rhinitis, eczema, health behaviors, and environmental risk factors. Questionnaires in Skopje were translated then back-translated prior to use.
The main outcome measures were asthma and wheeze. The lifetime diagnosis of asthma (asthma ‘ever’) was based on the question: “Have you ever had asthma?” Current wheeze was based on a positive response to “Have you ever had wheezing or whistling in the chest in the past 12 months?”
Additional covariates considered included socio-demographic information, home environmental exposures, weight and height, activity levels, and diet. Parental smoking was based on a positive history of currently smoking cigarettes by each parent independently. Self-reported weight and height or, where they were unknown by the respondents, their objectively measured values were used for the calculation of the BMI of each respondent as weight (kg)/height (m2). The international cut-points for BMI for overweight and obesity by sex between 2 and 18 years, 25kg/m2 for overweight and 30kg/m2 for obesity at age 18, were used.15 Physical activity was based on the question “How many times a week do you engage in vigorous physical activity long enough to make you breathe hard?” and was recorded as never/occasionally, 1–2 times per week, and 3 or more times per week. Television watching was based on the question “During a normal week, how many hours a day (24h) do you watch television?” and was recorded as <1hour, 1 to <3h, 3 to <5h, and 5h or more. Diet was assessed by the question “In the past 12 months, how often, on average, did you eat or drink the following?” with response options of never/occasionally, 1 to 2 times per week, and 3 or more times per week.
Statistical analysisStatistical analysis was completed using SPSS 24. Initially, descriptive analysis was completed. Statistical comparisons between Saskatoon and Skopje were made using the independent samples t-test for continuous variables and the chi-square test for categorical samples. In accordance with ISAAC recommendations,16 missing or “any other” responses were part of the denominator for calculation of prevalence figures for the main outcome measures.
We fitted a multiple logistic regression model for each outcome (ever asthma and current wheeze). Our primary independent variable of interest was location of dwelling (Saskatoon vs. Skopje). Additional variables were added to the model following purposeful selection as suggested by Hosmer and Lemeshow17 and included variables based on statistical significance, biological importance, and the effect that the removal of that variable had on the remaining variables in the model. Strength of association was based on the odds ratio (OR) and 95% confidence interval (95%CI). Effect modification between the variable indicating location and the other variables in the model was tested using the −2 loglikelihood test. Following this, multiple logistic regression was performed after stratification by location.
In order to identify risk factors that may explain differences in asthma prevalence between locations, a mediation analysis was performed. A base adjusted model was fitted with a minimum set of predictors. Additional, potentially mediating variables were then added to the base adjusted model one at a time so that there would be the base model plus one additional potentially mediating variable to evaluate the impact of that specific variable on the base model. This process was repeated for each potential mediator. Following this process, a fully adjusted model was fitted which included the base model along with all of the potential mediators. The proportion of the association between geographic location and the outcome that was explained by these factors was assessed by: [(ORfull model without mediator−ORfull model)/(ORfull model−1)]×100.18 For mediation to occur, a statistically significant association between the primary exposure (location) and outcome (asthma or wheeze) must be smaller and no longer statistically significant when the mediator is included.19 We considered a 5% change in the association to be meaningful.
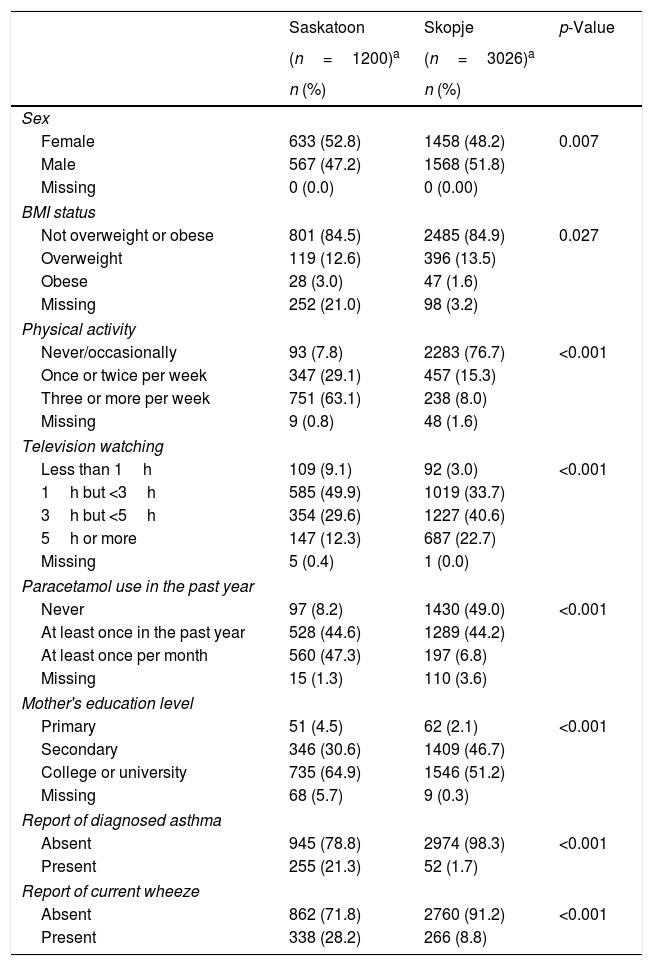
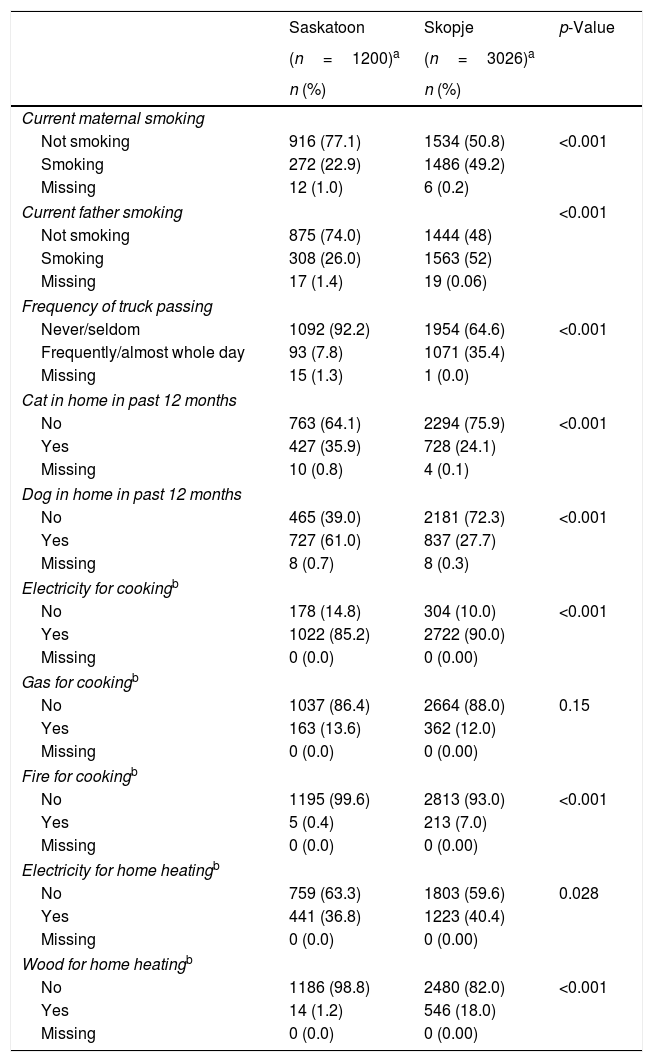
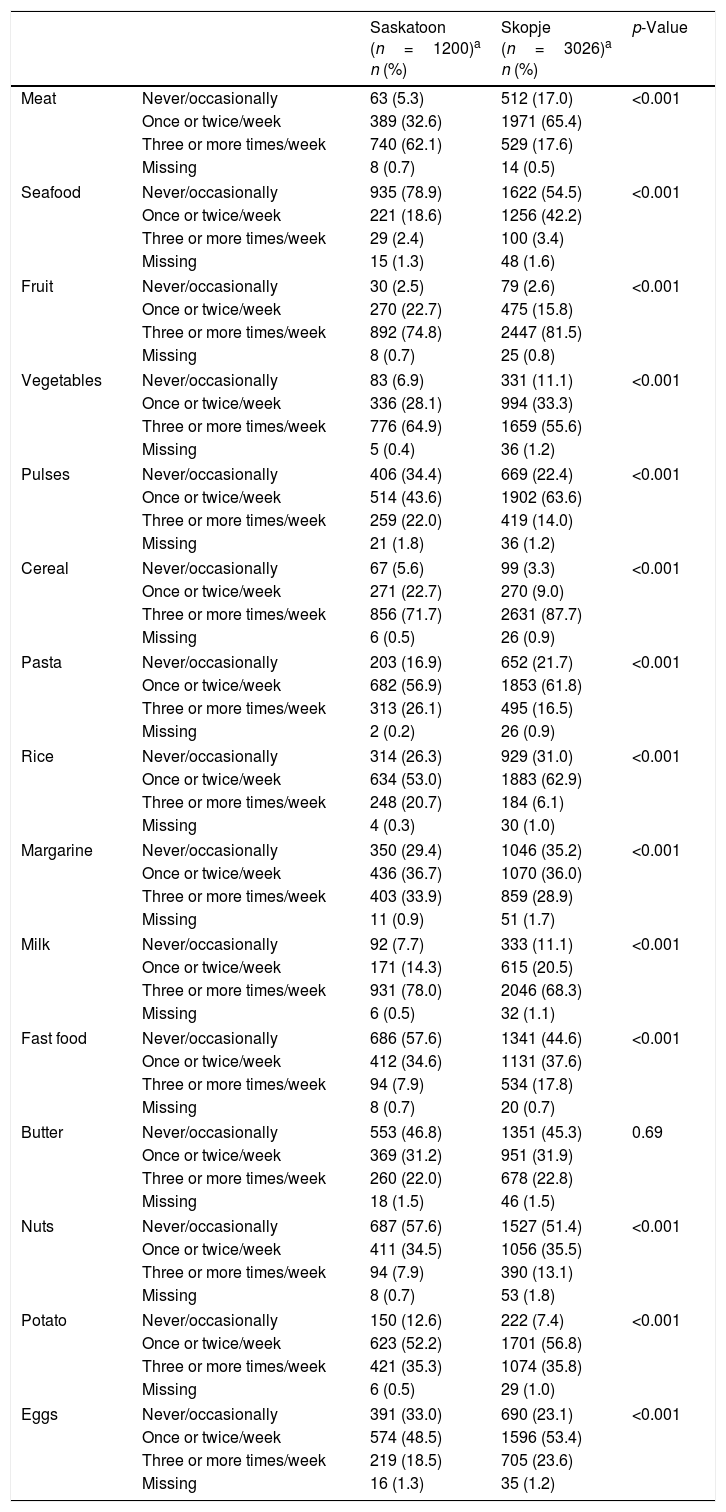
ResultsEver asthma prevalence was higher in Saskatoon than Skopje (21.3% vs. 1.7%, respectively; Table 1) as was current wheeze (Saskatoon: 28.2%, Skopje: 8.8%; Table 1). The Saskatoon children were less likely to be male or watch higher amounts of television but were more likely to be obese, have higher levels of physical activity, use paracetamol more often, and report a higher level of maternal education compared to those from Skopje (Table 1). Saskatoon participants were also less likely to be exposed to parental smoking, frequent truck passing on roads, and to use electricity or wood for cooking or heating but were more likely to have cats or dogs in the home (Table 2) compared to Skopje residents. Most dietary factors differed between Saskatoon and Skopje (Table 3).
Distribution of personal characteristics by location.
| Saskatoon | Skopje | p-Value | |
|---|---|---|---|
| (n=1200)a | (n=3026)a | ||
| n (%) | n (%) | ||
| Sex | |||
| Female | 633 (52.8) | 1458 (48.2) | 0.007 |
| Male | 567 (47.2) | 1568 (51.8) | |
| Missing | 0 (0.0) | 0 (0.00) | |
| BMI status | |||
| Not overweight or obese | 801 (84.5) | 2485 (84.9) | 0.027 |
| Overweight | 119 (12.6) | 396 (13.5) | |
| Obese | 28 (3.0) | 47 (1.6) | |
| Missing | 252 (21.0) | 98 (3.2) | |
| Physical activity | |||
| Never/occasionally | 93 (7.8) | 2283 (76.7) | <0.001 |
| Once or twice per week | 347 (29.1) | 457 (15.3) | |
| Three or more per week | 751 (63.1) | 238 (8.0) | |
| Missing | 9 (0.8) | 48 (1.6) | |
| Television watching | |||
| Less than 1h | 109 (9.1) | 92 (3.0) | <0.001 |
| 1h but <3h | 585 (49.9) | 1019 (33.7) | |
| 3h but <5h | 354 (29.6) | 1227 (40.6) | |
| 5h or more | 147 (12.3) | 687 (22.7) | |
| Missing | 5 (0.4) | 1 (0.0) | |
| Paracetamol use in the past year | |||
| Never | 97 (8.2) | 1430 (49.0) | <0.001 |
| At least once in the past year | 528 (44.6) | 1289 (44.2) | |
| At least once per month | 560 (47.3) | 197 (6.8) | |
| Missing | 15 (1.3) | 110 (3.6) | |
| Mother's education level | |||
| Primary | 51 (4.5) | 62 (2.1) | <0.001 |
| Secondary | 346 (30.6) | 1409 (46.7) | |
| College or university | 735 (64.9) | 1546 (51.2) | |
| Missing | 68 (5.7) | 9 (0.3) | |
| Report of diagnosed asthma | |||
| Absent | 945 (78.8) | 2974 (98.3) | <0.001 |
| Present | 255 (21.3) | 52 (1.7) | |
| Report of current wheeze | |||
| Absent | 862 (71.8) | 2760 (91.2) | <0.001 |
| Present | 338 (28.2) | 266 (8.8) | |
Distribution of environmental characteristics by location.
| Saskatoon | Skopje | p-Value | |
|---|---|---|---|
| (n=1200)a | (n=3026)a | ||
| n (%) | n (%) | ||
| Current maternal smoking | |||
| Not smoking | 916 (77.1) | 1534 (50.8) | <0.001 |
| Smoking | 272 (22.9) | 1486 (49.2) | |
| Missing | 12 (1.0) | 6 (0.2) | |
| Current father smoking | <0.001 | ||
| Not smoking | 875 (74.0) | 1444 (48) | |
| Smoking | 308 (26.0) | 1563 (52) | |
| Missing | 17 (1.4) | 19 (0.06) | |
| Frequency of truck passing | |||
| Never/seldom | 1092 (92.2) | 1954 (64.6) | <0.001 |
| Frequently/almost whole day | 93 (7.8) | 1071 (35.4) | |
| Missing | 15 (1.3) | 1 (0.0) | |
| Cat in home in past 12 months | |||
| No | 763 (64.1) | 2294 (75.9) | <0.001 |
| Yes | 427 (35.9) | 728 (24.1) | |
| Missing | 10 (0.8) | 4 (0.1) | |
| Dog in home in past 12 months | |||
| No | 465 (39.0) | 2181 (72.3) | <0.001 |
| Yes | 727 (61.0) | 837 (27.7) | |
| Missing | 8 (0.7) | 8 (0.3) | |
| Electricity for cookingb | |||
| No | 178 (14.8) | 304 (10.0) | <0.001 |
| Yes | 1022 (85.2) | 2722 (90.0) | |
| Missing | 0 (0.0) | 0 (0.00) | |
| Gas for cookingb | |||
| No | 1037 (86.4) | 2664 (88.0) | 0.15 |
| Yes | 163 (13.6) | 362 (12.0) | |
| Missing | 0 (0.0) | 0 (0.00) | |
| Fire for cookingb | |||
| No | 1195 (99.6) | 2813 (93.0) | <0.001 |
| Yes | 5 (0.4) | 213 (7.0) | |
| Missing | 0 (0.0) | 0 (0.00) | |
| Electricity for home heatingb | |||
| No | 759 (63.3) | 1803 (59.6) | 0.028 |
| Yes | 441 (36.8) | 1223 (40.4) | |
| Missing | 0 (0.0) | 0 (0.00) | |
| Wood for home heatingb | |||
| No | 1186 (98.8) | 2480 (82.0) | <0.001 |
| Yes | 14 (1.2) | 546 (18.0) | |
| Missing | 0 (0.0) | 0 (0.00) | |
Distribution of dietary characteristics by location.
| Saskatoon (n=1200)a n (%) | Skopje (n=3026)a n (%) | p-Value | ||
|---|---|---|---|---|
| Meat | Never/occasionally | 63 (5.3) | 512 (17.0) | <0.001 |
| Once or twice/week | 389 (32.6) | 1971 (65.4) | ||
| Three or more times/week | 740 (62.1) | 529 (17.6) | ||
| Missing | 8 (0.7) | 14 (0.5) | ||
| Seafood | Never/occasionally | 935 (78.9) | 1622 (54.5) | <0.001 |
| Once or twice/week | 221 (18.6) | 1256 (42.2) | ||
| Three or more times/week | 29 (2.4) | 100 (3.4) | ||
| Missing | 15 (1.3) | 48 (1.6) | ||
| Fruit | Never/occasionally | 30 (2.5) | 79 (2.6) | <0.001 |
| Once or twice/week | 270 (22.7) | 475 (15.8) | ||
| Three or more times/week | 892 (74.8) | 2447 (81.5) | ||
| Missing | 8 (0.7) | 25 (0.8) | ||
| Vegetables | Never/occasionally | 83 (6.9) | 331 (11.1) | <0.001 |
| Once or twice/week | 336 (28.1) | 994 (33.3) | ||
| Three or more times/week | 776 (64.9) | 1659 (55.6) | ||
| Missing | 5 (0.4) | 36 (1.2) | ||
| Pulses | Never/occasionally | 406 (34.4) | 669 (22.4) | <0.001 |
| Once or twice/week | 514 (43.6) | 1902 (63.6) | ||
| Three or more times/week | 259 (22.0) | 419 (14.0) | ||
| Missing | 21 (1.8) | 36 (1.2) | ||
| Cereal | Never/occasionally | 67 (5.6) | 99 (3.3) | <0.001 |
| Once or twice/week | 271 (22.7) | 270 (9.0) | ||
| Three or more times/week | 856 (71.7) | 2631 (87.7) | ||
| Missing | 6 (0.5) | 26 (0.9) | ||
| Pasta | Never/occasionally | 203 (16.9) | 652 (21.7) | <0.001 |
| Once or twice/week | 682 (56.9) | 1853 (61.8) | ||
| Three or more times/week | 313 (26.1) | 495 (16.5) | ||
| Missing | 2 (0.2) | 26 (0.9) | ||
| Rice | Never/occasionally | 314 (26.3) | 929 (31.0) | <0.001 |
| Once or twice/week | 634 (53.0) | 1883 (62.9) | ||
| Three or more times/week | 248 (20.7) | 184 (6.1) | ||
| Missing | 4 (0.3) | 30 (1.0) | ||
| Margarine | Never/occasionally | 350 (29.4) | 1046 (35.2) | <0.001 |
| Once or twice/week | 436 (36.7) | 1070 (36.0) | ||
| Three or more times/week | 403 (33.9) | 859 (28.9) | ||
| Missing | 11 (0.9) | 51 (1.7) | ||
| Milk | Never/occasionally | 92 (7.7) | 333 (11.1) | <0.001 |
| Once or twice/week | 171 (14.3) | 615 (20.5) | ||
| Three or more times/week | 931 (78.0) | 2046 (68.3) | ||
| Missing | 6 (0.5) | 32 (1.1) | ||
| Fast food | Never/occasionally | 686 (57.6) | 1341 (44.6) | <0.001 |
| Once or twice/week | 412 (34.6) | 1131 (37.6) | ||
| Three or more times/week | 94 (7.9) | 534 (17.8) | ||
| Missing | 8 (0.7) | 20 (0.7) | ||
| Butter | Never/occasionally | 553 (46.8) | 1351 (45.3) | 0.69 |
| Once or twice/week | 369 (31.2) | 951 (31.9) | ||
| Three or more times/week | 260 (22.0) | 678 (22.8) | ||
| Missing | 18 (1.5) | 46 (1.5) | ||
| Nuts | Never/occasionally | 687 (57.6) | 1527 (51.4) | <0.001 |
| Once or twice/week | 411 (34.5) | 1056 (35.5) | ||
| Three or more times/week | 94 (7.9) | 390 (13.1) | ||
| Missing | 8 (0.7) | 53 (1.8) | ||
| Potato | Never/occasionally | 150 (12.6) | 222 (7.4) | <0.001 |
| Once or twice/week | 623 (52.2) | 1701 (56.8) | ||
| Three or more times/week | 421 (35.3) | 1074 (35.8) | ||
| Missing | 6 (0.5) | 29 (1.0) | ||
| Eggs | Never/occasionally | 391 (33.0) | 690 (23.1) | <0.001 |
| Once or twice/week | 574 (48.5) | 1596 (53.4) | ||
| Three or more times/week | 219 (18.5) | 705 (23.6) | ||
| Missing | 16 (1.3) | 35 (1.2) | ||
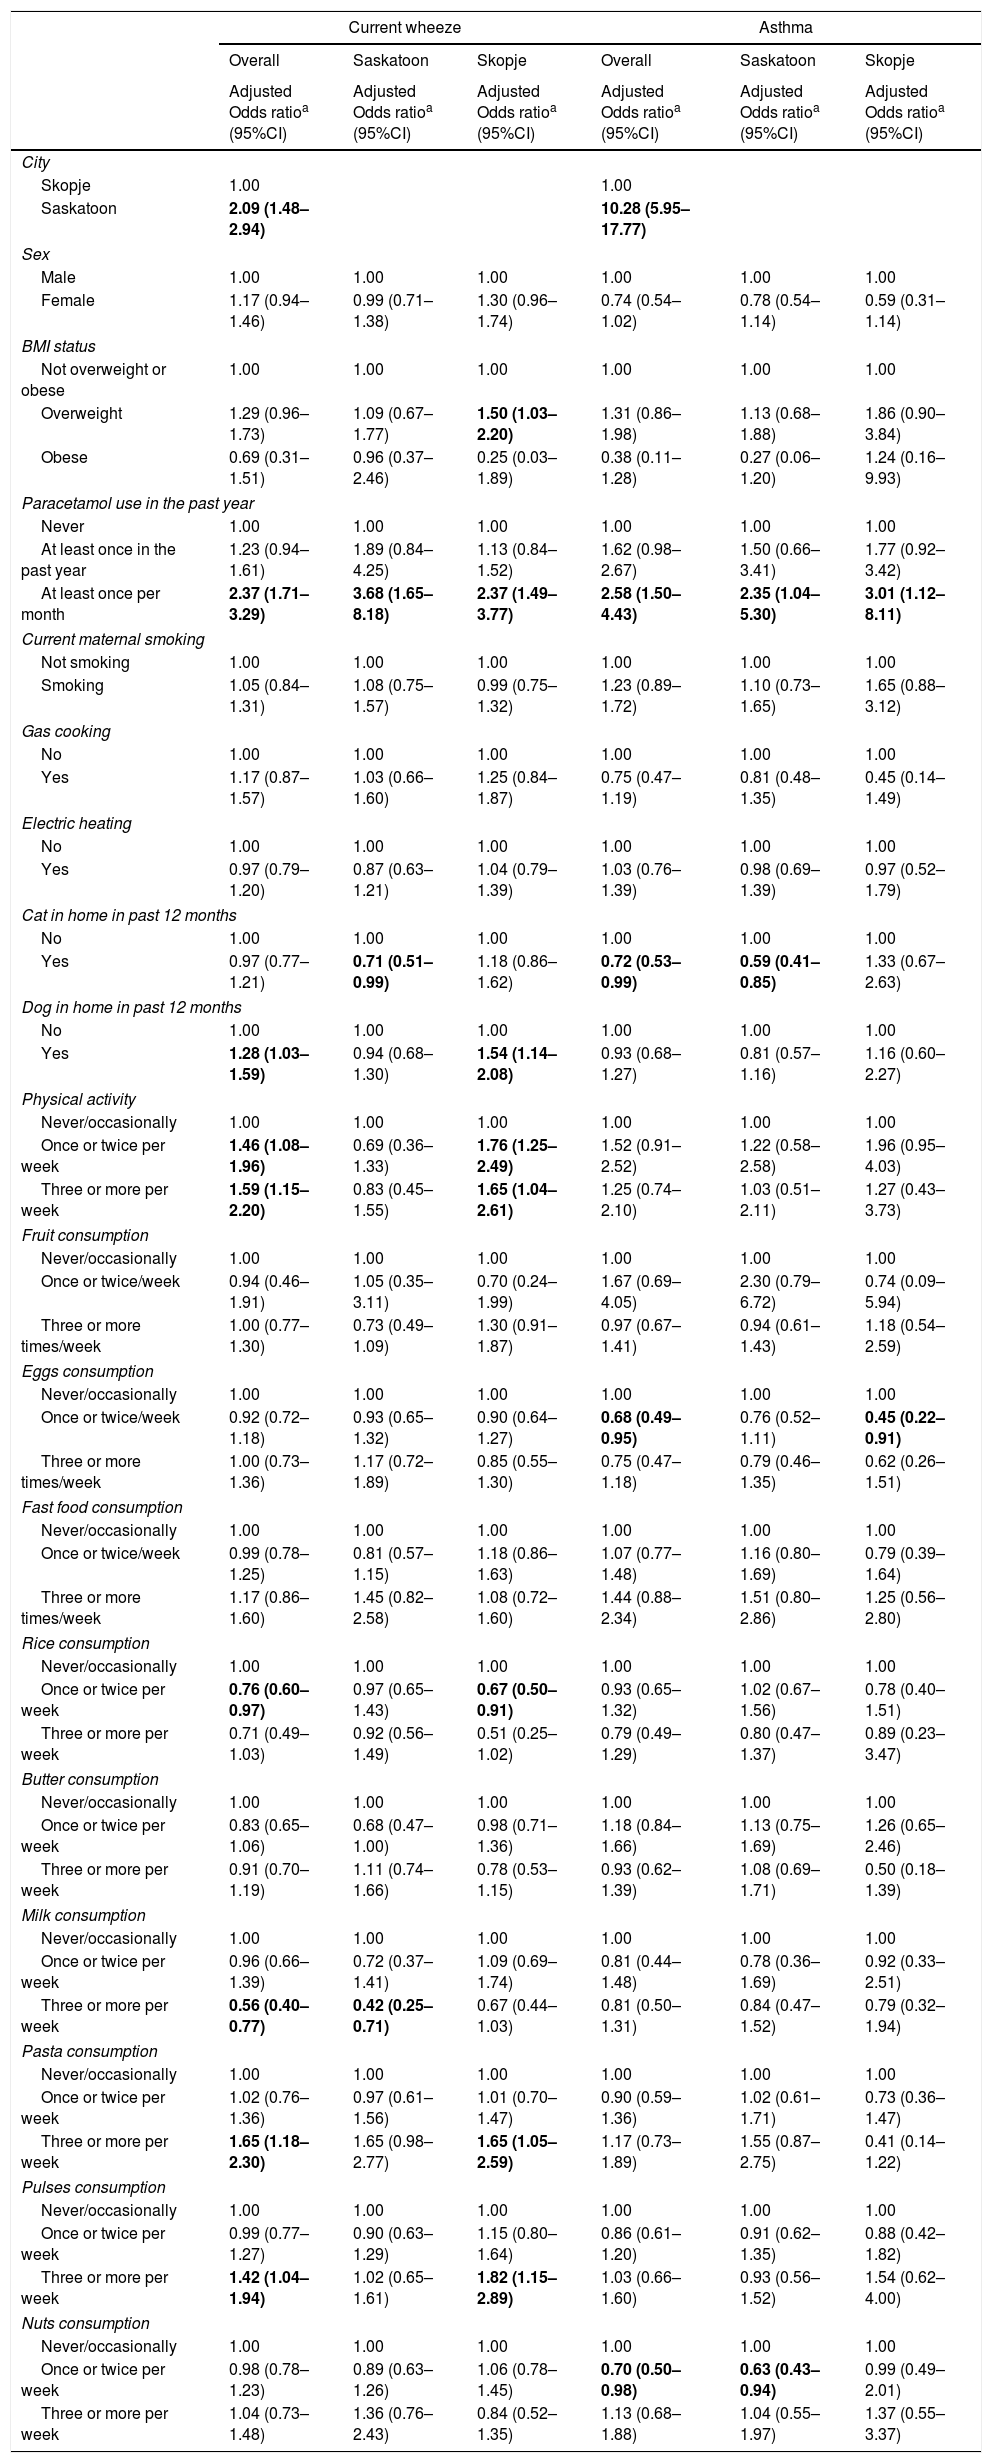
After adjustment for confounding, there was an increased risk of asthma (OR=10.28, 95%CI=5.95–17.77) and current wheeze (OR=2.09, 95%CI=1.48–2.94) living in Saskatoon compared to Skopje (Table 4). With regard to asthma, there was an increased risk associated with paracetamol use in a dose–response pattern and inverse associations with cat in the home and consuming eggs or nuts once or twice per week (Table 4). There was effect modification between city and cat (p=0.01) and city and pasta (p=0.10). After stratification by city, the association between presence of a cat in the home and asthma as well as nut consumption and asthma was observed in Saskatoon while the association between increased egg consumption and asthma was observed in Skopje (Table 4).
Results from multiple logistic regression analyses with asthma or current wheeze as the outcome by location of residence.
| Current wheeze | Asthma | |||||
|---|---|---|---|---|---|---|
| Overall | Saskatoon | Skopje | Overall | Saskatoon | Skopje | |
| Adjusted Odds ratioa (95%CI) | Adjusted Odds ratioa (95%CI) | Adjusted Odds ratioa (95%CI) | Adjusted Odds ratioa (95%CI) | Adjusted Odds ratioa (95%CI) | Adjusted Odds ratioa (95%CI) | |
| City | ||||||
| Skopje | 1.00 | 1.00 | ||||
| Saskatoon | 2.09 (1.48–2.94) | 10.28 (5.95–17.77) | ||||
| Sex | ||||||
| Male | 1.00 | 1.00 | 1.00 | 1.00 | 1.00 | 1.00 |
| Female | 1.17 (0.94–1.46) | 0.99 (0.71–1.38) | 1.30 (0.96–1.74) | 0.74 (0.54–1.02) | 0.78 (0.54–1.14) | 0.59 (0.31–1.14) |
| BMI status | ||||||
| Not overweight or obese | 1.00 | 1.00 | 1.00 | 1.00 | 1.00 | 1.00 |
| Overweight | 1.29 (0.96–1.73) | 1.09 (0.67–1.77) | 1.50 (1.03–2.20) | 1.31 (0.86–1.98) | 1.13 (0.68–1.88) | 1.86 (0.90–3.84) |
| Obese | 0.69 (0.31–1.51) | 0.96 (0.37–2.46) | 0.25 (0.03–1.89) | 0.38 (0.11–1.28) | 0.27 (0.06–1.20) | 1.24 (0.16–9.93) |
| Paracetamol use in the past year | ||||||
| Never | 1.00 | 1.00 | 1.00 | 1.00 | 1.00 | 1.00 |
| At least once in the past year | 1.23 (0.94–1.61) | 1.89 (0.84–4.25) | 1.13 (0.84–1.52) | 1.62 (0.98–2.67) | 1.50 (0.66–3.41) | 1.77 (0.92–3.42) |
| At least once per month | 2.37 (1.71–3.29) | 3.68 (1.65–8.18) | 2.37 (1.49–3.77) | 2.58 (1.50–4.43) | 2.35 (1.04–5.30) | 3.01 (1.12–8.11) |
| Current maternal smoking | ||||||
| Not smoking | 1.00 | 1.00 | 1.00 | 1.00 | 1.00 | 1.00 |
| Smoking | 1.05 (0.84–1.31) | 1.08 (0.75–1.57) | 0.99 (0.75–1.32) | 1.23 (0.89–1.72) | 1.10 (0.73–1.65) | 1.65 (0.88–3.12) |
| Gas cooking | ||||||
| No | 1.00 | 1.00 | 1.00 | 1.00 | 1.00 | 1.00 |
| Yes | 1.17 (0.87–1.57) | 1.03 (0.66–1.60) | 1.25 (0.84–1.87) | 0.75 (0.47–1.19) | 0.81 (0.48–1.35) | 0.45 (0.14–1.49) |
| Electric heating | ||||||
| No | 1.00 | 1.00 | 1.00 | 1.00 | 1.00 | 1.00 |
| Yes | 0.97 (0.79–1.20) | 0.87 (0.63–1.21) | 1.04 (0.79–1.39) | 1.03 (0.76–1.39) | 0.98 (0.69–1.39) | 0.97 (0.52–1.79) |
| Cat in home in past 12 months | ||||||
| No | 1.00 | 1.00 | 1.00 | 1.00 | 1.00 | 1.00 |
| Yes | 0.97 (0.77–1.21) | 0.71 (0.51–0.99) | 1.18 (0.86–1.62) | 0.72 (0.53–0.99) | 0.59 (0.41–0.85) | 1.33 (0.67–2.63) |
| Dog in home in past 12 months | ||||||
| No | 1.00 | 1.00 | 1.00 | 1.00 | 1.00 | 1.00 |
| Yes | 1.28 (1.03–1.59) | 0.94 (0.68–1.30) | 1.54 (1.14–2.08) | 0.93 (0.68–1.27) | 0.81 (0.57–1.16) | 1.16 (0.60–2.27) |
| Physical activity | ||||||
| Never/occasionally | 1.00 | 1.00 | 1.00 | 1.00 | 1.00 | 1.00 |
| Once or twice per week | 1.46 (1.08–1.96) | 0.69 (0.36–1.33) | 1.76 (1.25–2.49) | 1.52 (0.91–2.52) | 1.22 (0.58–2.58) | 1.96 (0.95–4.03) |
| Three or more per week | 1.59 (1.15–2.20) | 0.83 (0.45–1.55) | 1.65 (1.04–2.61) | 1.25 (0.74–2.10) | 1.03 (0.51–2.11) | 1.27 (0.43–3.73) |
| Fruit consumption | ||||||
| Never/occasionally | 1.00 | 1.00 | 1.00 | 1.00 | 1.00 | 1.00 |
| Once or twice/week | 0.94 (0.46–1.91) | 1.05 (0.35–3.11) | 0.70 (0.24–1.99) | 1.67 (0.69–4.05) | 2.30 (0.79–6.72) | 0.74 (0.09–5.94) |
| Three or more times/week | 1.00 (0.77–1.30) | 0.73 (0.49–1.09) | 1.30 (0.91–1.87) | 0.97 (0.67–1.41) | 0.94 (0.61–1.43) | 1.18 (0.54–2.59) |
| Eggs consumption | ||||||
| Never/occasionally | 1.00 | 1.00 | 1.00 | 1.00 | 1.00 | 1.00 |
| Once or twice/week | 0.92 (0.72–1.18) | 0.93 (0.65–1.32) | 0.90 (0.64–1.27) | 0.68 (0.49–0.95) | 0.76 (0.52–1.11) | 0.45 (0.22–0.91) |
| Three or more times/week | 1.00 (0.73–1.36) | 1.17 (0.72–1.89) | 0.85 (0.55–1.30) | 0.75 (0.47–1.18) | 0.79 (0.46–1.35) | 0.62 (0.26–1.51) |
| Fast food consumption | ||||||
| Never/occasionally | 1.00 | 1.00 | 1.00 | 1.00 | 1.00 | 1.00 |
| Once or twice/week | 0.99 (0.78–1.25) | 0.81 (0.57–1.15) | 1.18 (0.86–1.63) | 1.07 (0.77–1.48) | 1.16 (0.80–1.69) | 0.79 (0.39–1.64) |
| Three or more times/week | 1.17 (0.86–1.60) | 1.45 (0.82–2.58) | 1.08 (0.72–1.60) | 1.44 (0.88–2.34) | 1.51 (0.80–2.86) | 1.25 (0.56–2.80) |
| Rice consumption | ||||||
| Never/occasionally | 1.00 | 1.00 | 1.00 | 1.00 | 1.00 | 1.00 |
| Once or twice per week | 0.76 (0.60–0.97) | 0.97 (0.65–1.43) | 0.67 (0.50–0.91) | 0.93 (0.65–1.32) | 1.02 (0.67–1.56) | 0.78 (0.40–1.51) |
| Three or more per week | 0.71 (0.49–1.03) | 0.92 (0.56–1.49) | 0.51 (0.25–1.02) | 0.79 (0.49–1.29) | 0.80 (0.47–1.37) | 0.89 (0.23–3.47) |
| Butter consumption | ||||||
| Never/occasionally | 1.00 | 1.00 | 1.00 | 1.00 | 1.00 | 1.00 |
| Once or twice per week | 0.83 (0.65–1.06) | 0.68 (0.47–1.00) | 0.98 (0.71–1.36) | 1.18 (0.84–1.66) | 1.13 (0.75–1.69) | 1.26 (0.65–2.46) |
| Three or more per week | 0.91 (0.70–1.19) | 1.11 (0.74–1.66) | 0.78 (0.53–1.15) | 0.93 (0.62–1.39) | 1.08 (0.69–1.71) | 0.50 (0.18–1.39) |
| Milk consumption | ||||||
| Never/occasionally | 1.00 | 1.00 | 1.00 | 1.00 | 1.00 | 1.00 |
| Once or twice per week | 0.96 (0.66–1.39) | 0.72 (0.37–1.41) | 1.09 (0.69–1.74) | 0.81 (0.44–1.48) | 0.78 (0.36–1.69) | 0.92 (0.33–2.51) |
| Three or more per week | 0.56 (0.40–0.77) | 0.42 (0.25–0.71) | 0.67 (0.44–1.03) | 0.81 (0.50–1.31) | 0.84 (0.47–1.52) | 0.79 (0.32–1.94) |
| Pasta consumption | ||||||
| Never/occasionally | 1.00 | 1.00 | 1.00 | 1.00 | 1.00 | 1.00 |
| Once or twice per week | 1.02 (0.76–1.36) | 0.97 (0.61–1.56) | 1.01 (0.70–1.47) | 0.90 (0.59–1.36) | 1.02 (0.61–1.71) | 0.73 (0.36–1.47) |
| Three or more per week | 1.65 (1.18–2.30) | 1.65 (0.98–2.77) | 1.65 (1.05–2.59) | 1.17 (0.73–1.89) | 1.55 (0.87–2.75) | 0.41 (0.14–1.22) |
| Pulses consumption | ||||||
| Never/occasionally | 1.00 | 1.00 | 1.00 | 1.00 | 1.00 | 1.00 |
| Once or twice per week | 0.99 (0.77–1.27) | 0.90 (0.63–1.29) | 1.15 (0.80–1.64) | 0.86 (0.61–1.20) | 0.91 (0.62–1.35) | 0.88 (0.42–1.82) |
| Three or more per week | 1.42 (1.04–1.94) | 1.02 (0.65–1.61) | 1.82 (1.15–2.89) | 1.03 (0.66–1.60) | 0.93 (0.56–1.52) | 1.54 (0.62–4.00) |
| Nuts consumption | ||||||
| Never/occasionally | 1.00 | 1.00 | 1.00 | 1.00 | 1.00 | 1.00 |
| Once or twice per week | 0.98 (0.78–1.23) | 0.89 (0.63–1.26) | 1.06 (0.78–1.45) | 0.70 (0.50–0.98) | 0.63 (0.43–0.94) | 0.99 (0.49–2.01) |
| Three or more per week | 1.04 (0.73–1.48) | 1.36 (0.76–2.43) | 0.84 (0.52–1.35) | 1.13 (0.68–1.88) | 1.04 (0.55–1.97) | 1.37 (0.55–3.37) |
Adjusted sex, BMI status, paracetamol use, current maternal smoking, gas cooking, electric heating, cat in the home, dog in the home, physical activity, fruit consumption, eggs consumption, fast food consumption, rice consumption, butter consumption, milk consumption, pasta consumption, pulses consumption, nuts consumption; Statistically significant results are in bold.
For current wheeze, there was a similar dose response association with increased risk associated with more frequent paracetamol use as well as an increased risk associated with more frequent physical activity, dog in the home, high pasta consumption, and high pulses consumption but an inverse association associated with consumption of rice once or twice per week and high milk consumption (Table 4). Effect modification was seen between city and cat (p=0.02), dog (p=0.03), activity level (p=0.05), fruit consumption (p=0.06), and nuts consumption (p=0.08). Following stratification by city, statistically significant associations in a dose-response fashion were observed for paracetamol use in both cities. There was also an increased risk of current wheeze in Skopje with being overweight, having a dog in the home, higher physical activity levels, pasta consumption, or pulse consumption and a reduced risk associated with rice consumption once or twice weekly in Skopje (Table 4).
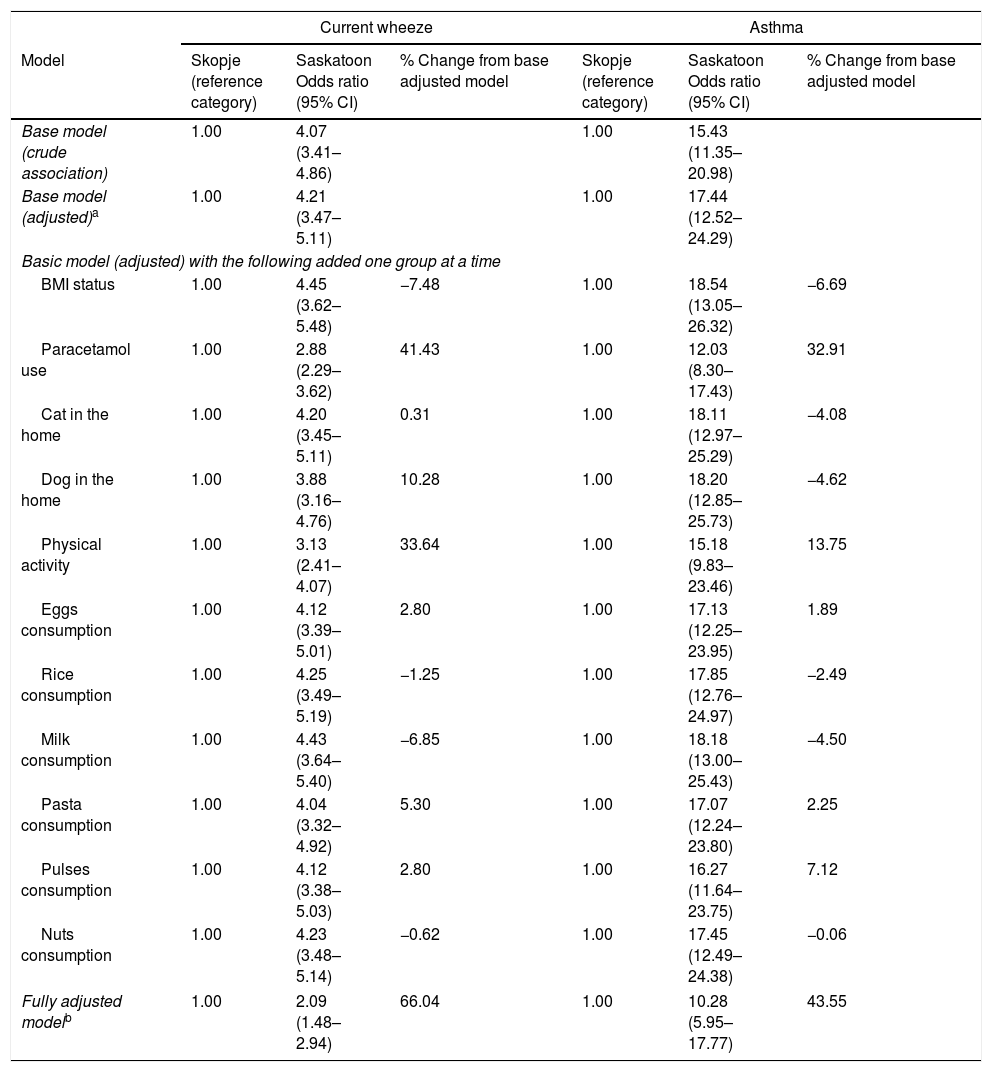
After investigating potential mediating variables (Table 5), the association between city and asthma remained statistically significant and strong. Paracetamol use (32.9%), activity level (13.8%), and pulses consumption (7.1%) explained some of the association. The association between city and current wheeze continued to be statistically significant and strong, although some of the association was explained by paracetamol use (41.4%), activity level (33.6%), dog in the home (10.3%), and pasta consumption (5.3%).
Adjusted associations between location and asthma or current wheeze followed by associations after removal of each factor to explore potential mediation.
| Current wheeze | Asthma | |||||
|---|---|---|---|---|---|---|
| Model | Skopje (reference category) | Saskatoon Odds ratio (95% CI) | % Change from base adjusted model | Skopje (reference category) | Saskatoon Odds ratio (95% CI) | % Change from base adjusted model |
| Base model (crude association) | 1.00 | 4.07 (3.41–4.86) | 1.00 | 15.43 (11.35–20.98) | ||
| Base model (adjusted)a | 1.00 | 4.21 (3.47–5.11) | 1.00 | 17.44 (12.52–24.29) | ||
| Basic model (adjusted) with the following added one group at a time | ||||||
| BMI status | 1.00 | 4.45 (3.62–5.48) | −7.48 | 1.00 | 18.54 (13.05–26.32) | −6.69 |
| Paracetamol use | 1.00 | 2.88 (2.29–3.62) | 41.43 | 1.00 | 12.03 (8.30–17.43) | 32.91 |
| Cat in the home | 1.00 | 4.20 (3.45–5.11) | 0.31 | 1.00 | 18.11 (12.97–25.29) | −4.08 |
| Dog in the home | 1.00 | 3.88 (3.16–4.76) | 10.28 | 1.00 | 18.20 (12.85–25.73) | −4.62 |
| Physical activity | 1.00 | 3.13 (2.41–4.07) | 33.64 | 1.00 | 15.18 (9.83–23.46) | 13.75 |
| Eggs consumption | 1.00 | 4.12 (3.39–5.01) | 2.80 | 1.00 | 17.13 (12.25–23.95) | 1.89 |
| Rice consumption | 1.00 | 4.25 (3.49–5.19) | −1.25 | 1.00 | 17.85 (12.76–24.97) | −2.49 |
| Milk consumption | 1.00 | 4.43 (3.64–5.40) | −6.85 | 1.00 | 18.18 (13.00–25.43) | −4.50 |
| Pasta consumption | 1.00 | 4.04 (3.32–4.92) | 5.30 | 1.00 | 17.07 (12.24–23.80) | 2.25 |
| Pulses consumption | 1.00 | 4.12 (3.38–5.03) | 2.80 | 1.00 | 16.27 (11.64–23.75) | 7.12 |
| Nuts consumption | 1.00 | 4.23 (3.48–5.14) | −0.62 | 1.00 | 17.45 (12.49–24.38) | −0.06 |
| Fully adjusted modelb | 1.00 | 2.09 (1.48–2.94) | 66.04 | 1.00 | 10.28 (5.95–17.77) | 43.55 |
Adjusted for country, sex, current maternal smoking, gas cooking, electric heating, fruit consumption, fast food consumption, and butter consumption.
Adjusted country, sex, BMI status, paracetamol use, current maternal smoking, gas cooking, electric heating, cat in the home, dog in the home, physical activity, fruit consumption, eggs consumption, fast food consumption, rice consumption, butter consumption, milk consumption, pasta consumption, pulses consumption, nuts consumption.
We also considered diagnostic labeling indicators. In Saskatoon, among those with current wheeze, 42.6% reported ever asthma while in Skopje, only 10.2% of those with current wheeze reported ever asthma. In addition, wheeze with exercise was much higher in Saskatoon than Skopje (39.0% vs. 14.2%, p<0.001); when we excluded children who wheezed only with exercise from the current wheeze group, the difference in the prevalence of current wheeze between regions was no longer statistically significant (5.5% vs. 4.8%, p=0.32).
DiscussionWe confirmed that the prevalence of asthma and wheeze were both considerably higher in Saskatoon compared to Skopje. In both communities, there was a dose response relationship between asthma or current wheeze and paracetamol use. Despite some variables explaining some variation in asthma and wheeze prevalence, the associations between center and each outcome (asthma and wheeze) remained strong and statistically significant.
Among 13–14 year olds, the observed prevalence of current wheeze in Saskatoon was similar to that observed in the United Kingdom (24.7%).1 Within Canada, when comparing the five Canadian cities participating in ISAAC, there was regional variation in wheeze prevalence (Vancouver: 13.7%, Hamilton: 23.7%, Winnipeg: 25.6%, Halifax: 33.0%) with Saskatoon being in the upper end of this range.14 The observed prevalence of current wheeze in Skopje was 8.8% which was similar to ISAAC Phase 3 results in Eastern and Northern Europe (overall=11.6% although eight out of 11 countries reported a prevalence of 11.2% or less).1 Current wheeze prevalence in Skopje was also similar to more recent studies in the region including Serbia and Montenegro (5.8–12.4%),20 Croatia (6.0–10.5%),21 and a second study from Croatia (2001–02: 8.4%; 2009–10: 14%).22
Generally, the associations observed in this study were consistent between locations. A notable positive association was found between paracetamol and both asthma and wheeze. This association showed a consistent dose-response relationship with each outcome. Positive associations between prenatal and postnatal paracetamol exposure and development and/or maintenance of asthma is well documented and has been reported in many previously published studies,23–25 including the ISAAC Phase Three study that analyzed data from 322,959 adolescents from 113 centers in 50 countries.26 Plausible reasons for this observed association include increased respiratory oxidative stress and/or defective antigen processing with enhanced Th2-cell polarization thereby depleting glutathione in the lungs and/or antigen presenting cells. Other possibilities relate to decreased suppression of cyclooxygenase pathway or direct antigenicity of paracetamol with IgE-mediated immune response.25,27 More recently, it has been suggested that epigenetic effects and antioxidant gene polymorphisms in the mother or child may modify the association between paracetamol and asthma in children.28,29 We observed that paracetamol use was much more frequent in Saskatoon compared to Skopje and that it mediated some of the difference in asthma and wheeze prevalence between the two locations. Unfortunately, we were not able to compare reasons for paracetamol use, which, speculatively, could be due to more frequent infection in Saskatoon adolescents and related to asthma. Alternately, health care access between the two locations could be different, which could also potentially explain the differences in paracetamol use.
In Skopje, the prevalence of regular vigorous physical activity was much lower than Saskatoon and was found to be a risk factor for current wheeze. The worldwide campaign about the health benefits of regular physical activity started later and has been accepted slowly in Skopje, compared to more Western countries. In non-diagnosed or under-treated children with asthma, vigorous physical activity is a well-known trigger for wheeze and asthma exacerbation. On the other hand, low physical activity levels might be one of the reasons for the under-diagnosis of asthma in Skopje as exercise-induced wheeze symptomology could lead to medical intervention and potential asthma diagnostics. For example, active children may push themselves to a point where wheeze may become evident, leading them to the physician, which could lead to investigation for asthma.
Cat in home was found to be a protective factor in Saskatoon while dog in home was found to be a risk factor in Skopje for current wheeze. The literature suggests the relation between exposure to cats and dogs and childhood asthma is complicated. Exposure to pets may increase the risk of asthma symptoms in sensitized children through allergen production or through non-allergic mechanisms such as inflammation caused by endotoxin. On the other hand, early-life pet allergen exposure may be protective for asthma through development of tolerance or through immune system modulation by bacterial endotoxin. There is evidence supporting endotoxin association with asthma severity and wheeze in schoolchildren, especially those with allergies.30,31 Exposure to pet allergens may still occur despite not having a pet present inside the home. While levels of cat and dog allergens are much higher in homes of children with these pets, it has been reported that there were still measurable levels of pet allergens in homes of children without a pet.32 Pet allergen levels in school classrooms were also higher when there were children in the class with a pet at home and may represent an indirect route of exposure.32
The association between diet and asthma is more controversial. Given the lack of dose–response effect and examples where the association with asthma or wheeze was not, dietary results should be interpreted with caution. In addition, we did not assess the Mediterranean diet33 in this analysis and therefore cannot comment on relationships between the Mediterranean diet and asthma or wheeze. Related to dietary consumption and influences on eating habits in relation to asthma, we were not able to investigate the role of food allergy.
Previous work has suggested that the lower prevalence of asthma seen in Eastern and Central Europe may be due, in part, to under-diagnosis.4,5,8 Thus, some of the observed differences could reasonably be from diagnostic labeling. This explanation is supported by our results showing that the association between location and asthma is much stronger than the association between location and wheeze. The proportion of children who wheezed in the past 12 months who also had a diagnosis of asthma was substantially different between locations strongly suggesting regional labeling differences.
While several variables showed a large (>5%) mediation effect, most notably paracetamol use and physical activity, the associations between location and asthma and current wheeze remained strong and statistically significant suggesting that these variables did not explain the differences in asthma and wheeze prevalence between centers. Paracetamol was used much more frequently in Saskatoon than in Skopje. However, reasons for use may lead us to an interpretation of a form of reverse causality when considering asthma and wheeze outcomes, especially with a cross-sectional study. Treatment of infections, which may be the true underlying cause of wheeze or asthma, may involve paracetamol more often in Saskatoon than in Skopje leading to a spurious association. However, dose–response associations between paracetamol and both asthma and wheeze was consistent between locations.
The potential mediating effect of physical activity is supported by the reduced prevalence of current wheeze, resulting in a comparable prevalence of wheeze between Saskatoon and Skopje when exercise-induced wheeze was removed from the prevalence estimate. There has been evidence that increased activity increases the likelihood of wheeze and asthma.34,35 The explanation for this is that children who are more active, exert themselves to a point where wheeze presents, which leads them to seek help from a physician where they then receive a diagnosis of asthma.
We must consider limitations in our study. This was a cross-sectional study and may be subject to the limitations inherent in the design such as lack of temporality, thereby reducing the ability to infer causal associations. Data collection was based on a survey. Despite this, when considering respiratory outcomes, symptoms have been found to be accurately reported by adolescents and strongly agree with parental reports in terms of asthma diagnoses.36 Also, for large population-based epidemiological studies, a questionnaire report has been suggested to be the method of choice37 and relatively accurate based on adolescent responses.36 However, we must acknowledge that there may be recall issues in this group, especially for events that may have occurred when the adolescent was younger. Also, inherent in the design, is the issue around cultural and practical differences between the two settings. There may be patient presenting, diagnostic labeling, and management issues. This not only includes asthma but for use of paracetamol as well. The two populations under study may also be genetically dissimilar, which may account for the differences as well. Asthma is known to have a genetic component but we were not able to assess this in our study. As part of this, it would have been helpful to include information regarding a family history of asthma but, unfortunately, this was not available in the combined dataset as the original ISAAC Phase III questionnaire did not include this question.
A potential concern is misclassification. One example may be the use of self-reported weight and height and their use in classification of overweight and obesity. A strong correlation between BMI calculated from self-reported versus measured weight and height in a large sample of American teenagers has been found, with a conclusion that studies can use self-reported height and weight to understand teen obesity and its correlates/sequelae.38 While there may have been some misclassification, when categorized based on BMI, the associations with asthma should be affected minimally.34 The use of BMI status in Saskatoon could be questioned given the large proportion of missing data in Saskatoon compared to Skopje.
Differences in participation rates between Saskatoon (54%) and Skopje (91%) may have resulted in selection bias of findings for Saskatoon. We can be more confident in the results from Skopje, given the high response rate. It may be that students in Saskatoon were more likely to take part if they experienced asthma or wheeze, artificially inflating the prevalence. While this may have occurred, the results seen were similar to other studies in the region. Also, the magnitude of the differences was so large that the impact of non-participants would be minimal. For example, if all of the non-responders in Saskatoon were free of asthma or wheeze and we recalculate the prevalence based on those who did and did not take part, the prevalence of asthma and wheeze would be 11% and 15%, respectively, both still substantially larger than in Skopje. Despite the differences in response rates, the observed associations between risk factors and asthma would still hold within the sample since for bias to occur, there would need to be response bias in both the exposure and outcome jointly39,40 and we believe this to not likely have occurred to a large degree. Moreover, stratified analyses were completed to further improve the validity of the findings. While having sufficient statistical power in most cases to conduct the analysis, there were some rare examples such as BMI status, where the cell size was extremely small and Type II error must be considered.
Finally, a potential limitation may be the length of time since the data was collected. However, this was an opportunity to investigate research questions which are still currently relevant. Even if the prevalence of disease or risk factors changed between the data collection and now, the associations observed would remain and could be considered in current research. There is no reason to believe that the association between the risk factors and outcomes or explanatory mechanisms would change over the past decade. Future work should focus on more recent temporal trends as well as in depth investigation of the explanatory factors for geographic variation of asthma prevalence.
Our study had several strengths as well. We used consistent and standardized methods in two centers based on a large well-established study allowing us to make comparisons between the two centers. This included a standardized survey designed to focus on children's lung health. Both centers had a large sample size and while the participation rate in Skopje was excellent, the participation rate in Saskatoon was what we expected or better than expected based on recent studies.
ConclusionsThe results of this study indicate that the prevalence of asthma and wheeze is much higher in Saskatoon, a region of heavy Western influence, compared to Skopje. While a few characteristics explained some of the regional prevalence variation, the differences in prevalence between locations remained strong and significant. Further research should focus on the risk factors and potential explanatory factors found as well as include clinical examinations. If there is under-diagnosis of asthma in Skopje, there could also be adolescents who are not properly managed resulting in poor asthma control and an increased burden to the individual, their family, and health care system.
Conflict of interestThe authors have no conflict of interest to declare.
In Skopje, Republic of Macedonia, this research was funded by The Ministry of Education and Science of the Republic of Macedonia provided financial support for the study. In Saskatoon, this research was funded by a grant from Health Canada.
